Primary Energy Consumption (Part II—Electricity Sector)
By Kent Hawkins -- October 13, 2015“By eliminating wind and solar from the 2014–2035 projections, almost $3 trillion in capital costs would be saved globally without any significant loss in needed power generation capacity.”
Part 1 of this series (yesterday) provided an analysis of the global use of primary energy sources. It showed that in projections to 2035 the new renewables of industrial wind turbines and solar panels will provide only about 5 percent of our total primary energy consumption.
This post narrows the focus to the electricity sector where some primary energy sources, the so-called “clean” technologies (wind, solar, hydro and nuclear), are almost exclusively used. This indicates why this sector is the focus for much of the very questionable, ineffective ‘revolutionary’ changes being advocated today.
The trends in electricity-generation primary-energy use are much the same as in overall use, that is, fossil fuels dominate notably, to date and as projected to 2035, in spite of substantial future investments in new wind and solar plant implementation of almost $3 trillion.
Table 1 shows the primary energy inputs to electricity generation expressed in millions of tons of oil equivalents (Mtoe) for 2014 and 2035.
Table 1 – Global Primary Energy Consumption in Electricity Generation for 2014 and projected to 2035 (Mtoe)
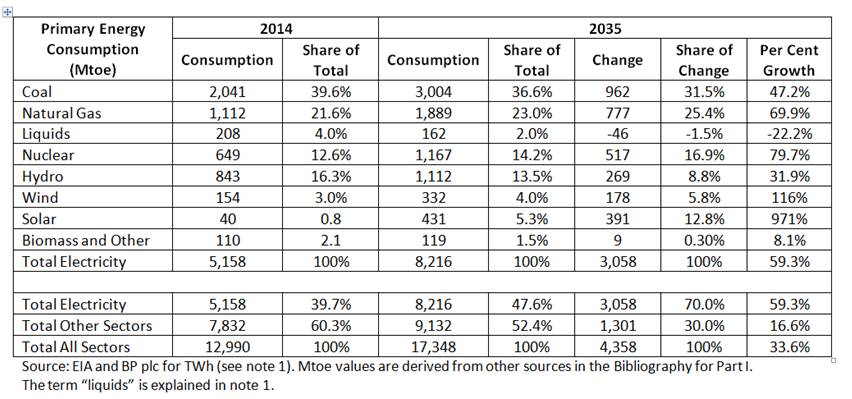
It should be noted that these energy-consumption compilations are typically mathematical models based on electricity produced (expressed in watt-hour terms) as the starting point.[1] As such, they contain some reasonably well measured values (such as electricity production) followed by estimates and assumptions used to produce input energy levels.
All of this should be considered when viewing the results. Further, this introduces some looseness in the values shown, but does not affect the robustness of conclusions drawn.
Summary Points: Table 1
The following observations are offered on Table 1:
- Electricity is becoming increasingly larger in the consumption of primary energy sources, approaching 50% by 2035.
- Coal maintains the largest share to 2035, both in total consumption and change in consumption, and accounts for about two-thirds of coal use globally.
- Natural gas is second place by the same measures.
- The consumption values shown for wind and solar (as well as nuclear and hydro) are the energy equivalents deemed taken from their primary energy flows. In the case of wind it would be interesting to speculate on what affect this harvesting of an important natural energy flow might have on local (and perhaps not so local) climates if pursued aggressively, but this will not be further commented on here. Solar is perhaps a different story and may be a glimpse of possibilities in the distant future, although arguably at the localized, micro-grid level designed primarily to support local consumption, not to feed the grid, as described here.
- The total renewables’ share of primary energy consumption for electricity generation in 2035 is 24%, of which hydro represents about 14 percentage points, or 58% of the renewables’ total.
- In 2035 wind and solar account for about 9% of the total primary energy consumed in the electricity sector. As discussed in Part 1, this represents an unrealistically high representation of their contribution because their value to users cannot be directly compared to the other sources, which can be counted on to provide steady, reliable primary energy flows.
- Remember that what is described here is primary-energy consumption. The level of electrical energy delivered to users is generally much less than this, as explained in note 1.
Questionable mathematics is commonly used to represent different trends. Examples are:
- Focus on percent growth over time. As shown in Table 1 wind and solar win this easily, but a large percentage increase from a small base is not necessarily significant in itself.
- Focus on percentae of totals, which distort the more meaningful absolute values that they represent. In Table 1, such a representation could give the impression that coal use is decreasing, when it is actually significantly increasing.
- Focus on new installed capacities (Bloomberg [2015] slide 33) which easily shows wind and solar with large numbers. This is why Table 1 shows energy flows, not capacities, because the energy consumed/delivered is the more meaningful measure. Wind and solar have very low energy flows from their installed capacities because of the low capacity factors, plus intermittency of the source energy flow in both the short term (minutes) and longer term (hours and days) and shorter plant lifetimes. It can be argued that some natural gas generation plants can have low capacity factors too, but this misses the point that their capital costs are among the lowest while operation costs, largely fuel, are high. These plants are therefore useful for peaking and frequency regulation roles, which means they are more lightly used by choice, and benefit by their low capital costs (in spite of high operating costs) because of this relatively light use. They are usually more responsive to frequent change as well, important in frequency regulation and wind and solar balancing. The corresponding high investment of national wealth in wind and solar should be taken as a warning sign and not a cause for celebration.
- As already touched on in the previous point, the focus on a greater amount of new dollar investment made in wind and solar than other plants, such as those fueled by natural gas, ignores the relative low cost per mega-watt of natural gas plant implementation versus wind and solar. This plus the low capacity factors for wind and solar requires higher capacities to deliver the same electricity will significantly inflate the value of the investments made.
As stated in Part I, anyone suggesting that more wind and solar is the solution, should read European Energy Policy: The ‘Fatal Conceit’ Continues, which reviews the report by the committee of experts that the European Commission established to assess its Energy Roadmap 2050. This should give pause to such notions.
Wasted Energy from Wind, Solar Forcing
An important factor, not taken account in reported fuel consumption and related measures, is the wasted energy introduced into electricity systems with the presence of unreliable and random nature of wind and solar generation. In Part 1 this was also referred to as “friction,” because it is conceptually similar in nature.
Most calculations, as described in Note 1 below, assumes a steady, reliable supply of electricity by all plants, and the balancing plants for wind and solar are forced into an unsteady operation to provide combined overall reliable and steady, and thus useful, electricity to users. This means they will be forced to operate in a less efficient mode, which leads to a higher level of fuel consumption per watt-hour of electricity produced. This offsets fuel savings claimed for wind and solar, arguably to a high degree.
To illustrate the short-term implications: Imagine the effect on gasoline consumed while driving your car on the highway, if you repeatedly every few minutes jam on the brakes and then tramp on the accelerator. Compared to driving at a constant speed for the same trip, considerably more gasoline will be used versus normal driving.
This will show up in additional fuel consumption for the wind and solar mirroring fossil fuel plants. This means the deemed consumption of primary-energy resources used in electricity production is higher than the totals reported above, by an amount up to the total energy consumption of wind and solar, and perhaps more.
Table 2 below assumes the wasted energy is equal to the wind and solar components (as indicated, it could be larger) and is added to natural gas to produce a new, and arguably a more realistic, version of Table 1. It also assumes that the overall consumption of primary energy remains unchanged. The alternative assumption would not change the results appreciably.
Table 2 – Table 1 Adjusted for Wasted Energy due to Wind and Solar
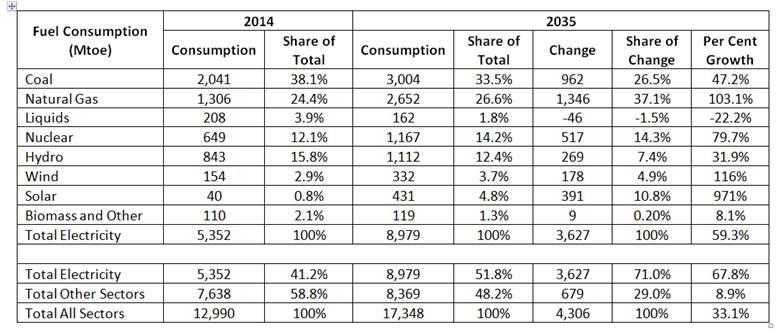
Natural gas consumption now is growing at about the same percentage as wind, but in absolute terms is over seven times the growth of wind.
Eliminating Wind and Solar
The important aspect of Table 2 is that it sets up the analysis to show the effect of eliminating wind and solar from the mix, which is a simple deletion of their rows in the table. This means we are not harvesting the natural wind and solar energy and the fossil-fuel consumption is not changed.
How can this be so? After all the wind and solar capacity and electricity production has to be replaced, doesn’t it? The answer is yes it does, but because the necessary gas plant capacity is already there, but in a relatively unused state spread throughout the gas plant fleet (balancing wind and solar), and these plants can now operate at normal, steady levels to replace the wind and solar electricity component, putting the otherwise wasted fossil-fuel energy to good use.
By eliminating wind and solar from the 2014–2035 projections, almost $3 trillion in capital costs would be saved globally without any significant loss in needed power generation capacity.
Removing wind and solar does not increase emissions, because no extra fuel is consumed, unless wind and solar were contributing to some level of emissions savings, which is arguably unlikely. [2] Part III (tomorrow) will look at the effect on emissions as a result of this for various assumptions of emissions savings from the use of wind and solar, as well as other scenarios to more effectively address emissions concerns.
Conclusion
Some will argue that extensive electrification of the transportation sector, for example, provides the capability of significantly impacting fossil fuel use outside of the electricity sector. To accomplish this, power-dense[3] energy production, delivery, and other infrastructure technologies able to provide copious quantities of reliable electrical energy will have to be developed, engineered, and commercialized.
Unfortunately, only one energy source qualifies, but the Western world is not inclined to aggressively and properly pursue it. That is nuclear, which has its own cost issues in many areas of the world.
—————
Notes
[1] Energy Information Agency (EIA) (2013). International Energy Outlook 2013 http://www.eia.gov/forecasts/archive/ieo13/electricity.cfm. Figure 83 and follow link to figure data.
Here is how BP plc describes its method of calculating Mtoe input.
Electricity from renewable sources is converted to tonnes of oil equivalent following the same methodology used for nuclear and hydroelectricity and is included in the primary energy consumption calculation.
The primary energy values of nuclear and hydroelectric power generation, as well as electricity from renewable sources, have been derived by calculating the equivalent amount of fossil fuel required to generate the same volume of electricity in a thermal power station, assuming a conversion efficiency of 38% (the average for OECD thermal power generation).
Biofuels consumption continues to be included in oil consumption data (see footnotes to oil consumption table).
Fuels used as inputs for conversion technologies (gas-to-liquids, coal-to-liquids, and coal-to-gas) are counted as production for the source fuel and the outputs are counted as consumption for the converted fuel.
This approach may seem to be too broadly applied to be realistic, so closer examination may help. Like many fossil fuel generation plants, nuclear and biomass generation plants produce heat that drives steam turbines, so similar efficiencies apply; wind has a theoretical limit in capturing wind energy of about 59% (Betz Law), but much lower levels are reported in practice; and solar conversion efficiencies are only about 15-20%. Hydro conversion efficiencies range from about 80-95%, so are penalized by this assumption. None of this changes the actual electricity produced as this is the starting point of the calculation. The result shown in Mtoe is the deemed energy content of the primary source (wind, solar, nuclear and hydro fall) that is consumed.
This is also a common practice for reporting within the European Union.
[2] In spite of a number of reports that show wind savings, it has not been conclusively proven. Such attempts mathematically show notable savings, but these do not reflect the reality of the wasted energy issue.
[3] Vaclav Smil describes the importance of this at http://www.masterresource.org/smil-vaclav/smil-density-comparisons-v/.
Bibliography
The bibliography provided in Part I still applies and some of this is repeated here for ease of reference.
Bloomberg New Energy Finance (2015). Bloomberg New Energy Finance Summit 2015. http://about.bnef.com/content/uploads/sites/4/2015/04/BNEF_2014-04-08-ML-Summit-Keynote_Final.pdf
[…] http://www.masterresource.org/energy-sources/primary-energy-electricity-ii/ […]
The reference to nuclear costs in the last sentence needs elaboration. Nuclear plants have high capital costs, which is compounded by long implementation times. The more important measure of costs is the cost of electricity produced (in kWh for example) over the plant lifetime. This is how it is delivered and paid for by users. On this basis nuclear costs are higher than coal and natural gas plants and significantly lower than wind (and solar) when all costs are accounted for. These costs are summarized in Table III-8 in http://www.masterresource.org/false-claims/wind-consequences-iii3/. This is known as the often quoted levelized cost of electricity production, and this table provides a basis for a direct comparison between dispatchable and non-dispatchable plants.
[…] See http://www.masterresource.org/energy-sources/primary-energy-electricity-ii/, under heading ‘Wasted Energy from Wind, Solar Forcing”. Further to the driving a car on a […]
[…] Primary Energy Consumption (Part II—Electricity Sector) […]