Primary Energy Consumption: Fossil Fuels in the Driver’s Seat (Part I – Growth by Fuel)
By Kent Hawkins -- October 12, 2015“Reality is best expressed in the absolute level of consumption for each primary-energy source, both the total and the growth—supplemented by some use of percentages. Using these measures, we can say that, throughout the period 1990 to 2035, fossil-fuel consumption was and will be persistently more significant than wind and solar combined.”
Claims are frequently made that wind power and solar power are the “fastest growing” energy sources, meaning that the world is transitioning away from fossil fuels. Let’s see if this withstands examination.
Such claims are usually expressed in terms of percentage growth over time or by percentages of the total. While mathematically correct, and often misleadingly worded (e.g., note my use of “fastest growing”), these are not reasonable representations of what is actually happening.
Reality is best expressed in the absolute level of consumption for each primary-energy source, both the total and the growth—supplemented by some use of percentages. Using these measures, we can say that, throughout the period 1990 to 2035, fossil-fuel consumption was and will be persistently more significant than wind and solar combined, in spite of aggressive implementations of the latter two. This also holds for each of the fossil-fuel categories alone (that is, coal, natural gas and oil/liquids).
Figure 1 shows the trend of total primary energy consumption.
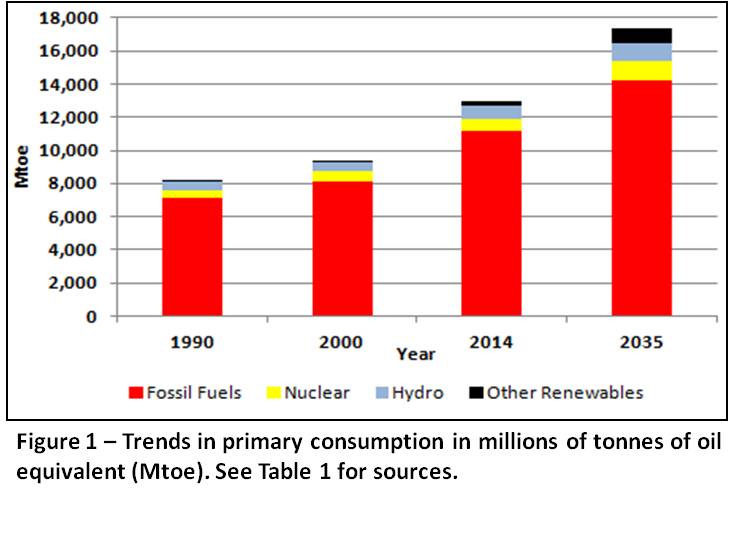
Table 1 provides more detail. Growth is covered below.
Table 1 – Primary Energy Consumed Globally in Million Tonnes of Oil Equivalent (Mtoe) Projected to 2035
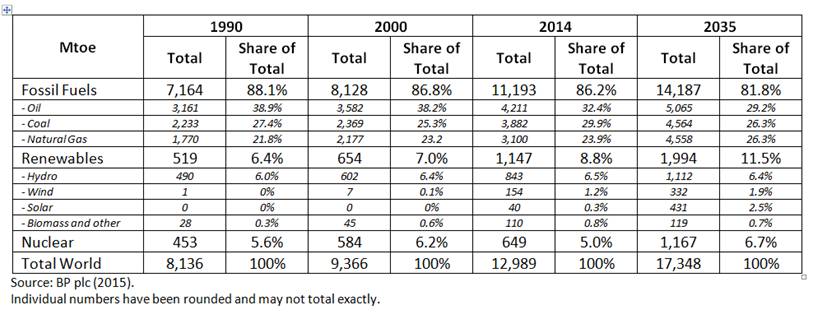
The totals for wind, solar, and biomass for 2035 are calculated from information in Bloomberg (slide 33).[1] Unfortunately there is some “looseness” in all these numbers owing to the nature of their derivation from their sources, as well from analyses in these posts, but it is not enough to affect the robustness of useful insights and conclusions.
Major Points: Figure 1/Table 1
There is a lot to consider in these numbers, but a few major points are:
- They illustrate the shortcomings of focusing only on the percentages of the total, which makes it look as though fossil-fuel use is declining.[2] You can see that absolute amounts tell a different story. If you are worried about emissions, absolute levels are what you must look at.
- However, these numbers assume wind and solar provide reliable, steady energy supply, just as other energy sources do. In fact, their intermittent nature, in both the long term (hours and days) and the short term (minutes) means they are not as effective as reliable sources and cannot be directly compared.[3] As a result there is a wasted energy element not provided for within the fossil fuel consumption to make the combined fossil fuel/wind/solar energy output production useful. This would increase some of the above values by notable amounts[4], and this will be looked at in part II.
- Projections beyond 2035 will likely show similar trends but wasted energy component will grow as well, in step with wind and solar.
- The Fukushima nuclear hiatus is evident in the 2014 numbers.
- The persistent reduction in the use of oil as a percent of the total is largely due to actual and projected improvements in energy efficiencies in the industry and transportation sectors.
Table 2 provides details of the changes in global energy consumption by fuel over the periods shown.
Table 2 – Changes in Global Energy Consumption Globally (Mtoe) for 1990 to 2035
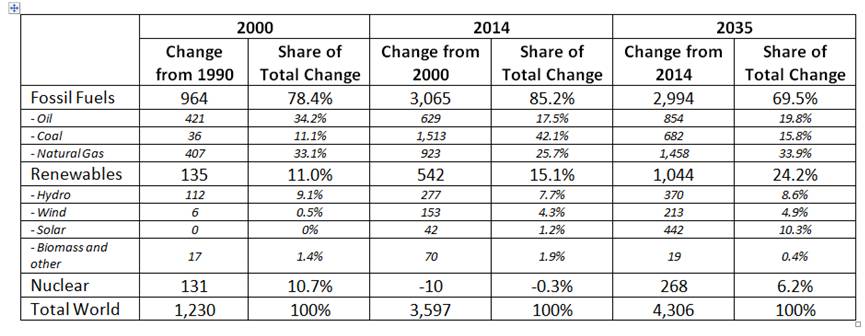
Major Points: Table 2
- Fossil-fuel increases swamp wind and solar to 2014. The projection to 2035 shows a reduction in fossil fuel dominance over wind and solar, but it still exceeds these by a factor of about five times.
- For the period 2000-2014, coal grew about ten times as much as wind and 35 times solar. Oil and gas grew 4-6 times wind and 15-20 times solar.
- For a projection from 2014 to 2035, coal grows three times faster than wind and over fifty per cent more than solar (1.54 times); oil and gas from 4 to 7 times that of wind and 2 to 3 times that of solar, respectively.
Note that the values shown are consumption inputs for the processes that use them, for example, energy inputs to electricity systems – not electricity output to end users. Part II will focus on the electricity sector.
Conclusion
Anyone thinking that the solution is to dramatically increase wind and solar, should read European Energy Policy: The ‘Fatal Conceit’ Continues, which reviews the report by the committee of experts that the European Commission established to assess its Energy Roadmap 2050. This should give pause to such notions.
Three major messages for energy policy based on energy reality are:
- Claims of the dramatic growth in wind and solar, suggesting that these are destined to play a major role, should be discounted considerably. Hopefully, the information provided here will be helpful in understanding such claims.
- Any suggestion that the world is transitioning off fossil fuels should be discounted as well. This is not happening for many good reasons, which are simply that we need this reliable energy source for our general well-being, and there are no other alternatives, except aggressive conservation, which has its own negative consequences.
- If you are concerned about emissions, which is your right, this should shed some light on the challenges and realities of meeting real-emissions reduction. These are not addressed by the policies and pronouncements which are currently unduly popular but in reality very questionable. Emissions will be addressed further in Part III.
————
Endnotes
[1] These were calculated from the information in Bloomberg slide 33, using the following capacity factors: wind – 30%; solar – 20%;and biomass – 90%; and converting to Mtoe. Do not be influenced by claims that technology improvements will make a difference. Wind is basically a mechanical conversion, with little opportunity for technology improvement. Solar does have promise but most likely at the scale of the micro-grid, to help meet local demand and using promising storage capabilities at that level of application. Biomass is largely like a fossil-fuel plant.
[2] See BP plc (2014) slide 18 as an example. Although this example is based on the electricity sector, the absolute numbers tell a different story, as will be shown in Part II.
[3] This is based on the same considerations that show levelized energy costs of non-dispatchable sources cannot be directly compared to dispatchable sources as explained by the U.S. Energy Information Administration, and this is why the EIA shows them in different tables.
[4] Most published energy accounting by fossil-fuel type is simplistically derived from the electricity output by the various plants types ignoring the wasted energy, or “friction”, involved in this balancing process. A possible way to account for this is to add an amount equal to the total wind and solar consumption energy to that for the wind-and-solar-balancing fossil fuel plants.
Bibliography
These are used as sources of data, cross reference and illustration of some points.
Bloomberg (2015). Bloomberg New Energy Finance Summit 2015. http://about.bnef.com/content/uploads/sites/4/2015/04/BNEF_2014-04-08-ML-Summit-Keynote_Final.pdf
BP plc (2015). Statistical Review of World Energy 2015 http://www.bp.com/en/global/corporate/about-bp/energy-economics/statistical-review-of-world-energy.html
BP plc (2014). BP Energy Outlook 2035. http://www.bp.com/content/dam/bp/pdf/Energy-economics/Energy-Outlook/Energy_Outlook_2035_booklet.pdf
International Energy Agency (IEA). 2014 Key World Energy Statistics http://www.iea.org/publications/freepublications/publication/KeyWorld2014.pdf
U.S. Energy Information Administration (EIA) (2015). Annual Energy Outlook 2015 – With Projections to 2040 http://www.eia.gov/forecasts/aeo/
U.S. Energy Information Administration (EIA) (2014). International/Energy Outlook 2014: World Petroleum and Other liquid Fuels – With Projections to 2040. http://www.eia.gov/forecasts/ieo/pdf/0484(2014).pdf
U.S. Energy Information Administration (EIA) (2012). Fuel used in electricity generation is projected to shift over the next 25 years. http://www.eia.gov/todayinenergy/detail.cfm?id=7310
well stated Kent, however a minor quibble. You state “If you are worried about emissions, absolute levels are what you must look at.” Not exactly, as emissions/mmbtu have improved quite rapidly. Thus we may be (and in many locations are in fact) seeing lower emissions even as higher levels of fossil consumption proceeds.