Wind Consequences (Part III: Total Costs)
By Kent Hawkins -- September 20, 2012This post completes the determination of wind costs, and Part IV covers subsidization and emissions. Part I, Introduction and Summary, contains links to all the posts in this series.
Just about any analysis you see understates wind’s cost. In fact there can be no comparison between the costs for wind and reliable, dispatchable generation plants such as coal, nuclear and gas plants. Reliability is so important in electricity systems, and wind’s persistent erratic behavior is so problematic that any electricity it produces is not usable and is a threat to electricity system reliability.
Add capacity from reliable generation plants flexible enough to balance wind’s erratic output and a steady, reliable electrical energy flow can be provided. However there is a substantial cost associated with this. As shown in Part II, for wind to produce the same amount of useful, reliable electricity over 40 years, wind and associated balancing overnight plant capital costs are almost 3 times that for nuclear, the most expensive conventional generation plants reviewed.
Many of these considerable costs can be “hidden” within a new generation plant program and arguments that the grid must be improved anyway. See Part II for further discussion on the so-called “smart” grid considerations.
As wind penetration increases into high single digits, another approach becomes increasingly necessary. That is to dump wind production in excess of some minimal amount by curtailment, or by selling it to some customers or other jurisdictions at almost no cost, and who are sometimes paid to take it. The real, full costs will be borne by the jurisdiction hosting the wind plants through increased electricity rates or taxes. Further, depending on timing and other circumstances, it may not be possible to find such customers.
In this post we will see: (1) the impact of such measures when wind plants are present, and (2) in the Wind scenario, with wind penetration at 38%, that it is not supportable.
The only other way that wind could be made useful is if there was sufficient storage capability, which does not exist for the foreseeable future.[1] In any event such storage would not necessarily be environmentally friendly and would be expensive as well. Extensive commercialization of wind plants cannot be justified on this basis.
The closest to such an arrangement is Denmark, which dumps most of its wind production to Norway and Sweden, which together obtain 75% of their electricity from hydro. Their joint hydro production is 30 times the size of Denmark’s wind output.[2] The large size of the Norway/Sweden hydro resource is sometimes mistakenly seen as an opportunity for more wind deployment in the rest of Europe, but it really represents the size of capability required to support Denmark’s tiny wind production for a number of reasons, including operational constraints as experienced in the US Northwest. In “wet” years, when the Norway/Sweden reservoirs are full, they cut back on wind imports from Denmark. Often missed in all this is that wind is often just displacing the normal operation of another renewable, no emissions energy source.
Levelized Implementation Costs
A view of the total levelized costs per MWh is provided by the DOE/EIA.[3] I suggest some of their cost plant implementation costs components, although complex, are questionable. This is the reason for a focus on this aspect here. For example the DOE/EIA:
· Uses a 30 year cost recovery period for all technologies, although it is not a reasonable assumption that wind turbines have a plant life that long. A more realistic position would be no more than 15 years, which will significantly alter the results.
· Penalizes greenhouse gas intensive technologies without Carbon Capture and Storage (CCS) with a 3 percentage point higher cost of capital than other plants. This may be limited to coal or coal-to-liquids plants, but this is not clear. The DOE/EIA says, in effect, this imposes a $15 per metric tonne emissions fee. If this is valid, wind plants should be similarly penalized because of the increase in emissions they impose on wind balancing fossil fuel plants. Thus the DOE/EIA implies that wind plants have no emissions associated with their use in electricity systems.
In its representation, the DOE/EIA has made an important improvement in recognizing the non-dispatchable fuel sources, such as wind and solar, cannot properly be compared with those that are dispatchable, and are shown separately. This follows the treatment I have previously provided and explained. I suspect this acknowledged distinction will be lost on most users of DOE/EIA reported costs.
The following is a better representation of the relative costs of the scenarios, which are now close to comparable because the non-dispatchable nature of wind has been coupled with flexible gas plant production providing the “equivalent” of a dispatchable combination. Table III-1 shows the elements on a levelized cost basis, with which comparisons can now be made.
Table III-1 – Levelized Implementation Costs for New Plants
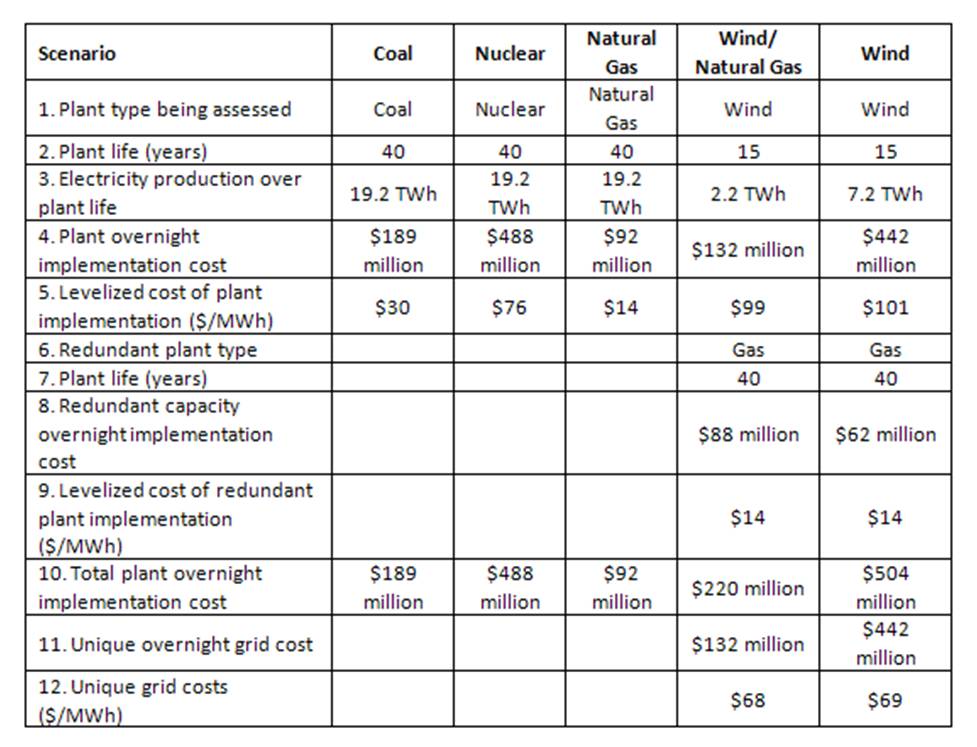
The levelized implementation costs are based on the overnight plant implementation costs (Table III-1, line 4) to meet the electricity production gap in year 12 for each plant type (financed at 7% amortized over the plant life of 40/15 years)[4] divided by the electricity produced over the plant life. A shorter financing period, as the DOE uses, will reduce interest costs, which will yield lower costs for coal, nuclear and gas plants. In the case of coal, nuclear and natural gas plants this is (using coal as an example):
Levelized implementation costs for coal plants
= 567 (total amortized implementation costs $million) / {40 (years) x 0.48 (TWh in year 12)}
= 567 x 106 / {19.2 x 10⁶ (converting to MWh)}
= $30/MWh
In the case of wind in the wind/natural gas scenario, the year 12 electricity production is 0.14 TWh giving 2.2 TWh over 15 years (0.14 x 15).
Levelized implementation costs for just the wind plants alone
= 217 ($million) / {15 (years) x 0.14 (TWh in year 12)}
= 217 x 106 / {2.2 x 10⁶ (converting to MWh)}
= $99/MWh
The levelized implementation costs shown for the gas plants in the wind scenarios are at least as low as that for the gas plant scenario, so the latter is used. A refinement could be made here but is ignored for simplicity.
A similar calculation for the wind scenario produces a levelized implementation costs for wind of $101/MWh.
The levelized plant implementation costs illustrate that, although capital costs can be quite high in some scenarios, the capital cost view of new plant implementation can be quite different when looked at in terms of the electricity delivered. This is the most informative view as electricity is generated, delivered and used in energy terms (e.g. MWh) and this is shown in Table III-1, lines 5, 9 and 12. It is important to remember that this is not the usually reported levelized cost per MWh, which may include possibly tax treatments, and operational costs, such as fuel and other operations and maintenance. The latter will be shown below. Also note that the levelized costs reported elsewhere for wind may not include grid investments unique to wind, and the necessary fossil fuel balancing generation.
Operations and Maintenance (O&M)
The previous section takes into account only the implementation costs. Table III-2 provides the levelized Operations and Maintenance (O&M) costs for a complete treatment.
Table III-2 – Levelized O&M Costs for the Scenarios ($/MWh)
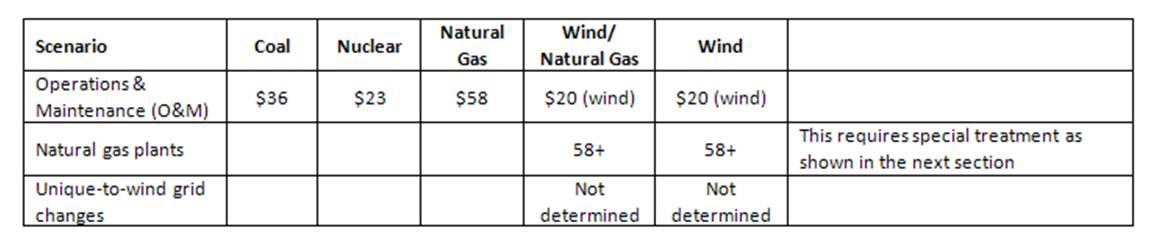
O&M rates are from the referenced DOE/EIA reports. Wind O&M rates are set at twice the rate shown there as it has been factored for the differential in financial treatment used by the DOE/EIA, which assumes a 30 year financial period versus the 15 year plant life used here.
Full Costs Over 40 Year Period
The above considerations provide the basis for the full costs for the scenarios by 2025. For levelized cost purposes, the plant implementation costs are divided by the electricity produced by them over respective generation plant lives as shown in Table III-1, line 2.
As wind plant life is 15 years a decision has to be made whether or not to replace them. My position is within this 13 year period, more likely sooner rather than later, wind plants will be recognized as not feasible and will not be replaced. However the wind balancing plants and unique to wind grid changes will persist. It is possible, but unlikely, that the nature of the wind balancing plants will be such that some or all will not have useful roles in the generation portfolio at that time. The grid changes will almost certainly not. In general there is a high potential for stranded costs.
If the wind plants are replaced then the original investments in wind balancing plants and grid changes will continue to have a role.
Tables III-3 and III-4 show the basis for the calculation of total costs for the wind/natural gas scenario, which now incorporate the fuel provision costs for the non-wind plants, which is the other component of EI not evaluated thus far. Note it is assumed that the gas plants are meeting the extra demand created by wind’s high EIe. So the allocation of gas plant costs to wind are: (1) The full wind balancing gas plant capacity, as wind must have this capacity to provide the total balancing requirements, plus (2) only the EIe component for O&M, and finally (3) the inefficiency imposed on the load component due to wind balancing operation. For details of the latter see Calculations.
The gas plant inefficiency has considerable impact on the emissions performance of wind as well.
In the wind/natural gas scenario, the remaining gas production is not allocated to wind, but to meeting the normal demand component of the electricity production gap.
Table III-3 – Wind Plants not replaced at End of Life (Wind/Natural Gas Scenario)
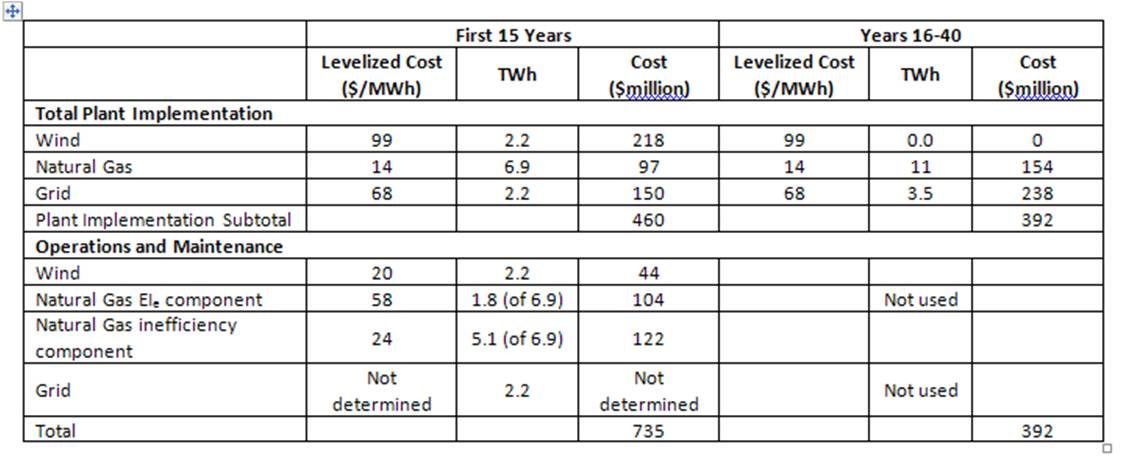
In years 16-40 the natural gas plants and grid changes are shown at the continued amortized rates. No assumptions are made about inflation in O&M costs. By this calculation the total cost over this period of 40 years is $735 + $392 (million) = $1,127 million or 1.1 billion per TWh. The total cost for the U.S. based on 2010 consumption of 4,000 TWh would be at least $1.1 billion x 4,000 = $4.4 trillion.
The levelized cost for wind is {$1.1 (billion) x 109 (convert to dollars)} / {2.2 (TWh produced) x 106 (convert to MWh)} = (1.1/2.2) x 103 = $500/MWh
If the natural gas plants are continued to be used in years 16-40 for other purposes, the total wind costs are reduced by $154 million to $973 million or $1.0 billion and the wind levelized cost to $455/MWh.
Table III-4 – Wind Plants Replaced at End of Life (Wind/Natural Gas Scenario)
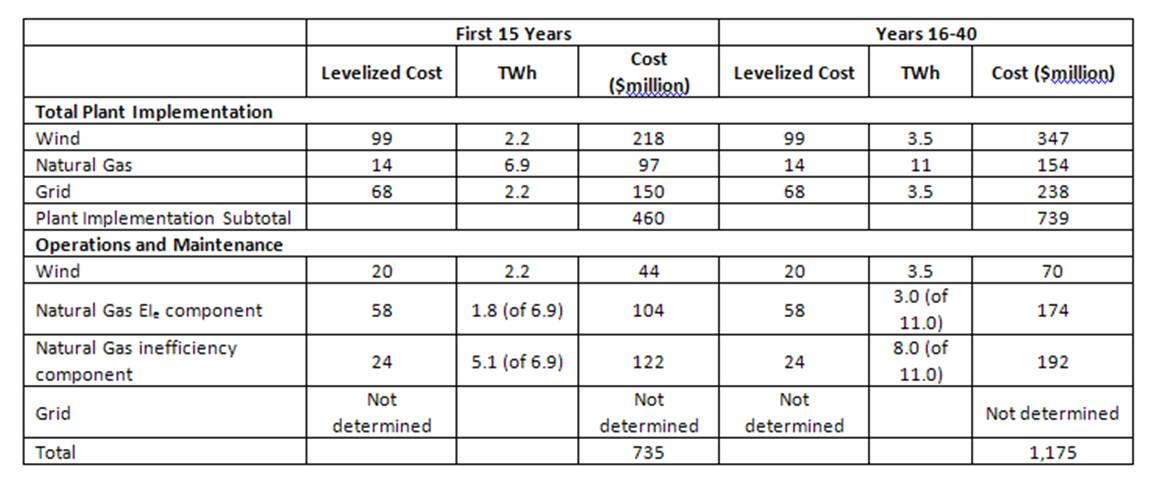
By this calculation the total cost over this period of 40 years is $735 + $1,175 (million) = $1,910 million or $1.9 billion per TWh. The total cost for the U.S. based on 2010 consumption of 4,000 TWh (assuming growth is handled by other plant sets) would be at least a total cost of 1.9 x 4,000 = $7.6 trillion.
This produces a levelized wind cost of {$2.0(billion) x 109 (convert to dollars)} / {6.2 (TWh produced) x 106 (convert to MWh)} = 1.9/5.7 x 103 = $333/MWh.
Tables III-5 and III-6 provide the same calculations for the Wind scenario. In this case the only gas production assumed is that to meet the EIe requirements, which is consistent with the wind/natural gas scenario approach. Unfortunately this gets a little complicated, and simplifying assumptions have been made.
The underlying assumption here is that wind production at 0.48 TWh in year 12 is projected for the next 15 or 40 years, depending on the option taken. Remember that the wind capacity is 184 MW in an electricity system that needs only 230 MW to meet peak demand, with “normal” generation plants. So there is clearly considerable need on a short term basis for dumping/curtailment. During periods when the electricity production falls below this annualized level some wind balancing capacity and production must be present. Also, to achieve the annual 0.48 TWh, from time to time compensating wind production over the annualized 0.48 TWh will have to occur, also requiring wind balancing capacity and production.
If not adequately accommodating these considerations, but at least to acknowledging the need for more gas plant capacity and production, the following assumptions have been made: (1) for capacity purposes the capacity factor for new the gas plants in this scenario has been reduced from 0.60 used in the wind/natural gas scenario to 0.50, and (2) Some small measure of the new gas plant meeting load is also included, but only the inefficiency component. See Calculations for details. As the gas plant capacity in this scenario is relatively low, it is recognized that this understates the costs and events that will in reality have to be met. However the full component of grid costs has been left in as these are front loaded investments and might be needed for dumping wind elsewhere.
Full marks to anyone who is able to follow all this. Anyone who still thinks wind at this level is feasible does not get a passing grade. The basic message taken from this should be that wind really complicates matters, in analysis and in real life.
Table III-5 – Wind Plants not replaced at End of Life (Wind Scenario)
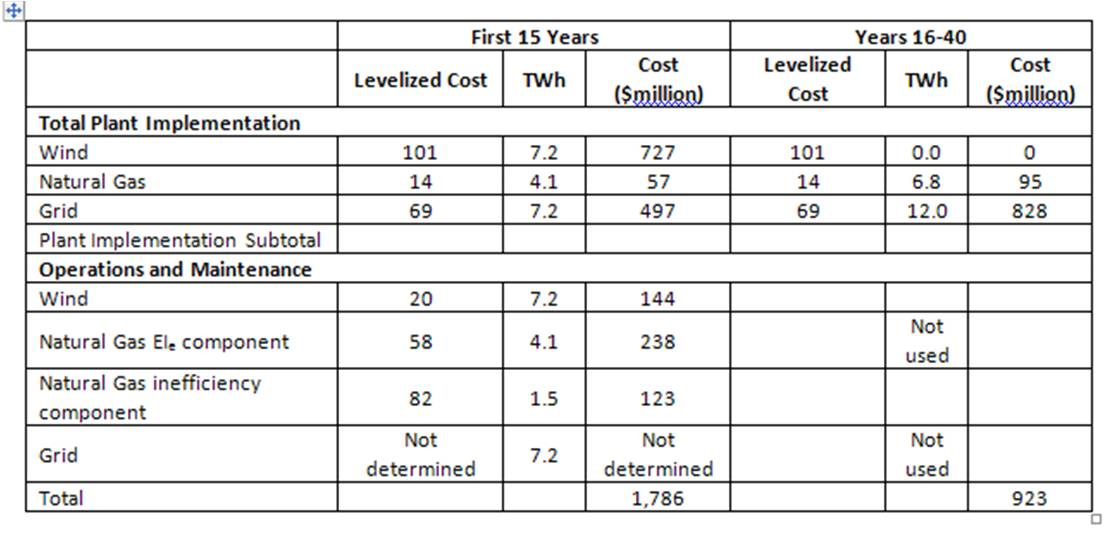
By this calculation the total cost over this period of 40 years is $1,786 + $923 (million) = $2,709 million or $2.7 billion per TWh. The total cost for the U.S. based on 2010 consumption of 4,000 TWh (assuming growth is handled by other plant sets) would be at least a total cost of 2.7 x 4,000 = $10.8 trillion.
This produces a levelized wind cost of {$2.7 (billion) x 109 (convert to dollars)} / {7.2 (TWh produced) x 106 (convert to MWh)} = 2.7/7.2 x 103 = $375/MWh.
Table III-6 – Wind Plants replaced at End of Life (Wind Scenario)
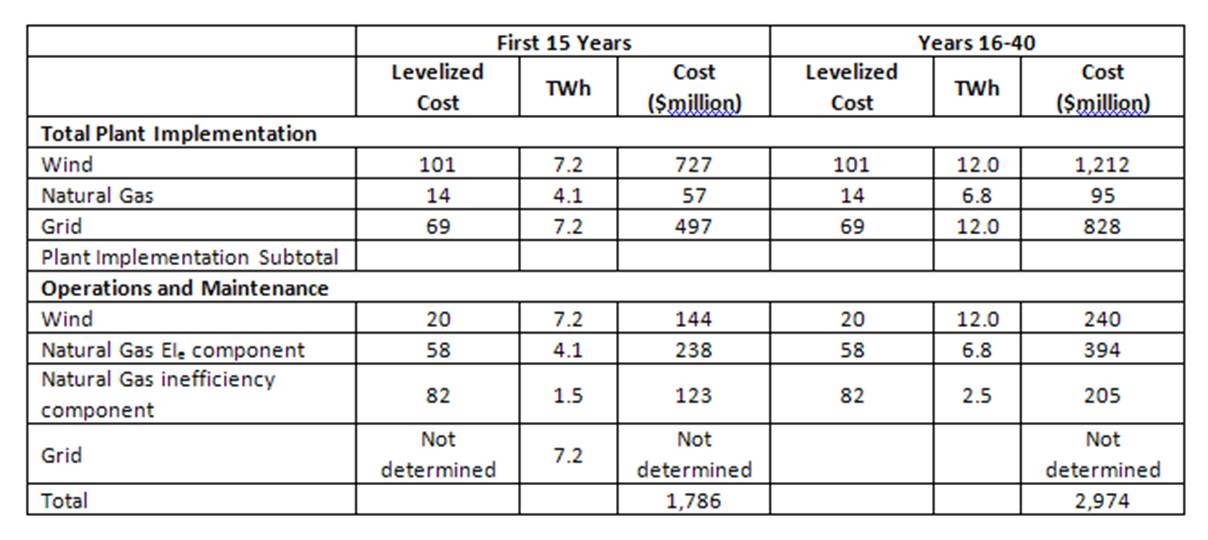
By this calculation the total cost over this period of 40 years is $1,786 + $2,974 (million) = $4,760 million or $4.8 billion per TWh. The total cost for the U.S. based on 2010 consumption of 4,000 TWh (assuming growth is handled by other plant sets) would be at least a total cost of 4.8 x 4,000 = $19.2 trillion.
This produces a levelized wind cost of {$4.8 (billion) x 109 (convert to dollars)} / {19.2 (TWh produced) x 106 (convert to MWh)} = 4.8/19.2 x 103 = $250/MWh.
Table III-7 – Levelized Cost Summary
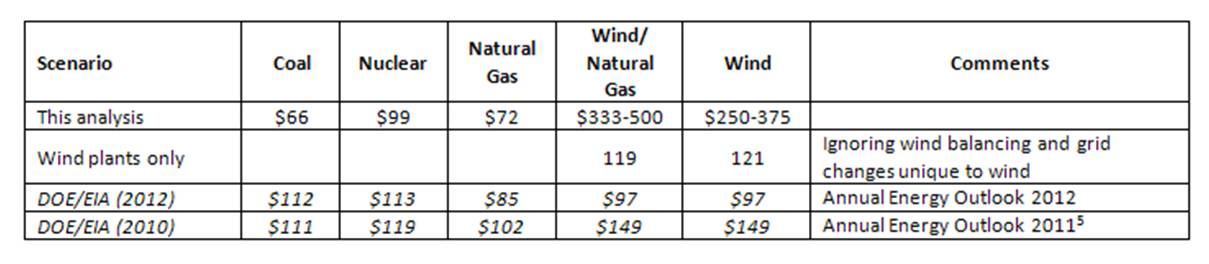
The most dramatic variance with the DOE/EIA levelized costs are in the wind scenarios and the reasons for the differences should be obvious – assumed plant life/financing period, grid and redundant balancing plant costs.
The difference in coal scenario levelized costs in part is due to not taking the three percentage point capital cost rate increase used by the DOE/EIA for this technology in the absence of Carbon Capture and Storage capability.
Total Costs
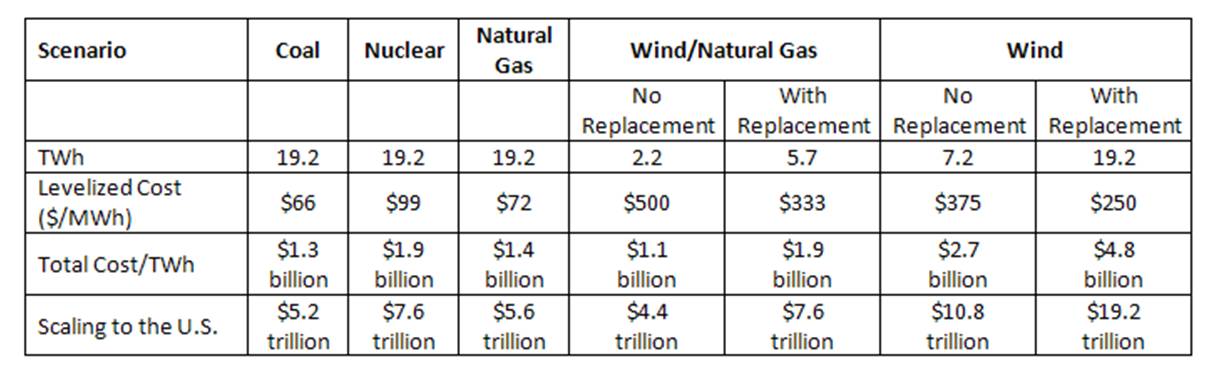
Table III-8 summarizes the total costs for all scenarios, with the proviso that the Wind scenario costs are likely understated and wind at this penetration is not feasible as described in Part II.
Table III-8 – Total Costs for All Scenarios
Making comparisons is complex. Two factors point to an approach:
- The two wind “No Replacement” options leave a TWh gap over 40 years, and must be replaced with other generation resources. So the realistic comparisons to other scenarios, total costs are more like the “With Replacement” options.
- It is likely that within the 12 years analyzed here wind will be seen as not a feasible and will be abandoned as a policy. This suggests that for realistic comparisons to other scenarios, levelized costs are more like the “No Replacement” options.
In summary, wind is a loser on costs. In light of the very high stakes involved in all scenarios, wind plant implementations cannot be sustained because they divert a large portion of national wealth into unproductive and very questionable, debt-laden investments. Early decisions involving a change of course away from wind policies are required to avoid future electricity supply problems due to lead times for the “conventional” generation plants that must inevitably be built.
Using these cost considerations, Part IV will look at the subsidies involved for each scenario and the consequences of wind’s persistent erratic behavior on emissions, which is another dismal story for wind. Note that Part I has links to all the posts in this series.
[1] Hawkins Kent (2011). “Windpower Emissions: the Kleekamp Critique…” See the Storage Capabilities section and note [i] http://www.masterresource.org/2011/01/kleekamp-part-iis/
[2] Some incorrectly believe that pumped hydro is involved. It is impounded run-of-river hydro electricity generation.
DOE/EIA (2012). “Levelized Cost of New Generation Resources in the Annual Energy Outlook 2012” http://www.eia.gov/forecasts/aeo/electricity_generation.cfm
DOE/EIA (2012). “Assumptions – Electricity Market Module” http://www.eia.gov/forecasts/aeo/assumptions/pdf/electricity.pdf
[4] The Excel PMT function was used to determine the total payments made (total financed cost). For example, in the coal scenario the overnight capital cost is $189 million (Table III-2, line 4), and the total financed cost over 40 years is $567 million. The DOE/EIA uses a real after tax weighted average cost of capital of 6.8%. 7% was arbitrarily chosen on that basis.
wind plant implementations cannot be sustained because they divert a large portion of national wealth into unproductive debt-laden investments
Exactly. Look at Europe, on the verge bankruptcy after spending bundles of money on heavily-subsidized green energy. So, when the Democrats passed their cap & trade bill in the House in 2009 that mandated insane 83% CO2 cuts by 2050, if the bill had made it to Obama, we wouldn’t have seen wind and other fanciful green energies making up more than an iota of this lost energy. Our country, already in a fiscal mess, could not maintain such prodigal spending.
Moreover, as far as the full cost to society of wind power, consider also the documented health problems and loss in property values in the vicinity of windmills. And the thousands of pretty little birds, and Bald Eagles, killed by these monsters. Wind power is truly a monstrous proposition.
[…] http://www.masterresource.org/2012/09/wind-consequences-iii3/#more-21800 […]
Some very interesting information here. I’m a budding oil and gas investor that at some point was interested in the possibilities that may come from wind powered solution…I must say that my opinions on such are withering away…
Some very interesting information here. I’m a budding oil and gas investor that at some point was interested in the possibilities that may come from wind powered solution…I must say that my opinions on such are withering away…
Investing in wind can provide generous returns. Many UK and US politicians and establishment figures are doing it.
But note that the returns do not come from selling the energy, which, as has been shown above, is not a viable activity. They come from milking subsidies and taxpayer grants.
You can get very rich this way. Many ‘environmental’ organisations already are…