Wind Consequences (Part IV – Subsidies and Emissions)
By Kent Hawkins -- September 25, 2012This post is part of a five-part series on the adverse consequences of imposing industrial-scale wind plants on electricity systems. The series shows that there is no valid reason to pursue the policy of implementing new renewable energy sources in electricity generation, especially wind.
This post provides more information on the subsidies and emissions considerations for the scenarios summarized in Part I. Parts II and III dealt with cost implications. Part V this Thursday will focus on a number of other issues providing a complete picture of wind’s undesirability and unfeasibility in all respects.
Part I also provides links to the rest of the series.
Subsidies
Because subsidy issues are often raised, comparing those for wind and other generation plants, it is appropriate to show their effect on a MWh basis, regardless of the absolute amounts. The subsidy related to producing a useful output is the important consideration, because this is how electricity is generated, used and paid for. Table IV-1 shows this, but at the level that the wind plant owner experiences, not the full costs of wind to society, that is including wind balancing plant and unique-to-wind grid investments. Note the very high wind subsidies, especially relative to this limited view of costs.
Table IV-1 – Levelized Costs (For the New Plants Being Assessed) and Subsidies ($/MWh)
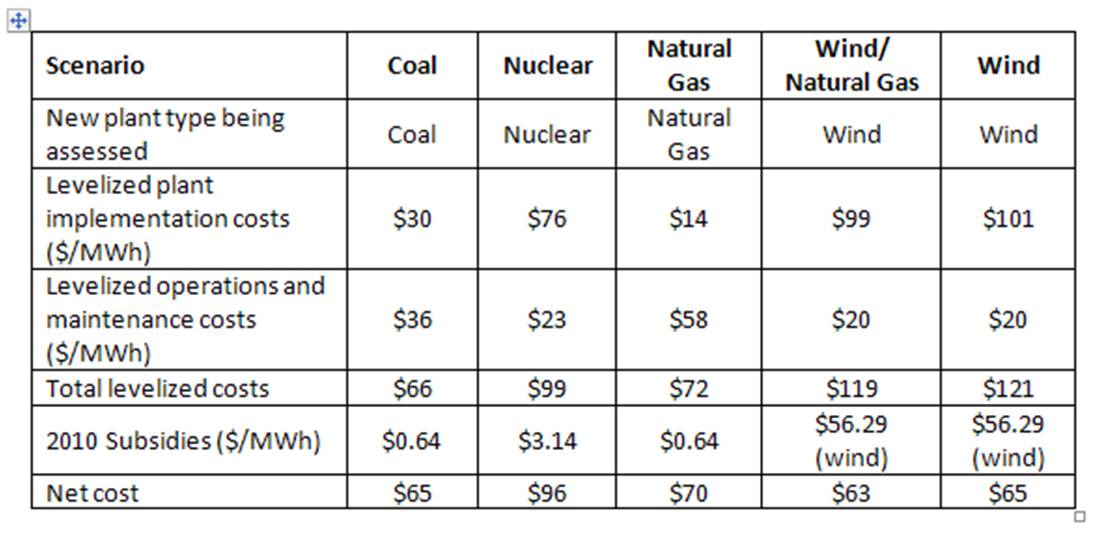
Source for subsidies: “Hard Facts: An Energy Primer”
This invalid, superficial view of wind subsidies appears to put wind at the same “cost” as the coal and natural gas plant types, and notably below nuclear. As described in Part III, comparisons cannot be made without the full wind costs taken into account. Remember this when claims are made about wind being competitive with other generation plant types as above.
High subsidies are claimed as needed because wind is promoted as being a new technology and therefore as needing support to encourage improvement, as other electricity generation technologies have enjoyed. First, wind is an old technology that has been in use for hundreds of years, and current wind turbines are basically little more than “modernized” versions. There is not much that can be improved upon to improve the conversion capability from wind to electrical energy, especially at the industrial-scale level of grid-feeding wind plants. Because wind turbines are very mechanically oriented, about the only approach available is to keep increasing the size of the already massive wind turbines being implemented today. However, this is a marginal and not desirable consideration considering the structural aspects and hardly justifies subsidization.
Finally the subsidization argument is sometimes supported by the very large energy resource potential represented by wind, which it is. The two most important arguments against this reasoning are (1) the highly diffused nature of the energy source that makes it useless for today’s developed societies (those wanting more information on this important aspect can look to these sources here, here and here), combined with (2) the reality that the conversion technology has reached its worthwhile limits. As an example, solar is a different consideration, because of the possibility of improved conversion technologies and in a truly distributed generation environment, but this is beyond what should be focused on for commercialization for decades.
Emissions
This raises the contentious question of the level of emissions savings provided by wind plants, which has never been conclusively determined, taking into account all the factors. Further, there is no published accurate, minute-by-minute, actual emissions by individual plant. Generally speaking, currently reported emissions information is just an estimate based on calculations using assumptions and simple algorithms. In some cases actual measurements are taken but are no better than those calculated as reported by the International Energy Agency (see page 35). A report by The Sustainable Energy Authority in Ireland, “Renewable Energy in Ireland”, in Appendix 1 also refreshingly recognizes the limitations to existing reporting methods.
There is an inescapable consequence to introducing wind’s production persistently erratic (over shorter periods) and unreliable (over longer periods) into electricity systems. Other generation plants must react to wind’s random minute-to-minute fluctuations as well as longer term absences and appearances. In effect, wind is another form of load on the electricity system that must be responded to in addition to the “normal” changes in demand. This forces other generation plants to operate less efficiently than they would in “normal” operations providing the steady, reliable electricity supply that modern societies require.
The result of the combination of these two sources (demand and wind) in the short term is a fairly random set of fluctuations with a variability of greater range than each individually, and this increases with wind penetration. Please, no further comments from the supposed “Statistics Professor” that the combination of two such random events in real time is the square root of the sum of the squares of the two inputs.
In other words, wind imposes a significantly greater need for frequency regulation control. Although not much reported on, frequency regulation generation plants appear to consume more fuel and produce more emissions dealing with this than they would if the normal short term variations in demand did not exist, even if the actual “average” amount of electricity produced is less during frequency regulation operation versus normal, steady operating conditions.
It appears that an international energy consulting firm, KEMA, has reported on this, as indicated by this study from the Netherlands, home of KEMA. This reference is also cited in another KEMA study (page 4 and note 1.). These claim that short term cycling coal and gas plants increases the fuel consumption (and hence emissions) over the normal operation of these plants even though they are producing less electricity during the cycling process. I unsuccessfully attempted to obtain a copy of this twice cited study from KEMA on two continents.
Here is a simple analogy. Imagine driving a car on a major highway at a normal (and fuel efficient) speed of say 55 mph. This corresponds to the normal operating conditions for fossil fuel plants, but ignoring normal short term demand fluctuations. Now imagine the same circumstances but introduce the repeated, and in short succession, applying of the brakes to reduce speed quickly to say 45 mph, and then pressing on the gas to accelerate back to 55 mph, or all sorts of combinations and ranges of this. This corresponds to the impact of wind fluctuations over and above normal demand fluctuations. Now imagine that the rate of change of the application of brakes and accelerator are amplified by this raised to the power of three. This is because with a wind turbine a doubling of wind speed increases electricity output by a factor of 8, and reducing wind speed by half reduces electricity output by factor of one-eighth. What do you think will be the effect on the fuel consumption, emissions and wear and tear on the engine, transmission and other moving parts of the car?
Now step out of this analogy and re-enter from a different point of view. The car in this thought experiment is now the wind production, not the wind balancing plants responding to it. Consider the effect on the other “normal” traffic around you. This represents a higher level view of the impact of introducing wind plants into an electricity system.
On the subject of plant start up and shut down to accommodate longer periods of wind variability, it appears that newer plants are more efficient in doing so. This should not be a distraction from the realities of the frequency of this need over time and the necessity of some existing plants being forced into doing this with the introduction of wind. Claims that future improvements in wind forecasting might provide some help here, but this should be relatively marginal. To put this in perspective, think in terms of weather forecasting in general.
As all the analyses of wind emissions effects that I have reviewed are incomplete, this prompted me to develop and continue to refine a calculator for fossil fuel and emissions savings for wind plants.[1] The calculator’s purpose is to provide a framework for the range of considerations required and, using fairly straight forward calculations, show the impact of wind. I produced a range of results depending on different input assumptions. The assumptions are necessitated by the lack of adequate data as described above. I believe that the most adverse for wind will be borne out when finally admitted to by those know and cannot or will not speak out (for a variety of reasons), and those who do not know and possibly do not wish to.
I could provide extensive references on all sides of this issue, but this would not resolve it today. This in itself should give readers pause for concern on this important subject.
Considering all this, my inescapable position is that wind plant presence in an electricity system does not contribute to fuel or emissions savings, and may actually increase these.
Cost of Emissions Savings
An important consideration in comparing the scenarios is their relative ability to reduce emissions, as well as the associated fossil fuel consumption, and the related costs in doing so. As for the above analyses this also takes the approach of looking at this on the basis of the year 12 new plant information and extending this over 40 years. As we have seen this amounts to 19.2 TWh of electricity production, except for some wind scenarios/options. As previously shown, there are options at the 15 year point for wind, as follows:
- Option 1. – Remove and do not replace the wind plants. In this case the gas plants and grid changes unique to wind may represent stranded costs or they might be useful in the ongoing generation fleet portfolio, or some blend of these two considerations. In this analysis the more likely full stranded costs are included as shown in Part III, Table III-3 and 5. Wind production for these scenarios over 15 years only is 2.2 and 7.2 TWh respectively.
- Option 2. – Re-invest in new wind plants to the capacity that existed at year 15. In this case the gas plants and grid changes unique to wind would be needed as before. The new wind plants will carry an implementation cost at each 15 year interval and produce the same amount of electricity over each 15 year period. The costs are as shown in Part III, Tables 4 and 6. Wind production for these scenarios over 40 years now is 5.7 and 19.2 TWh respectively.
In all cases the same levelized cost rates for wind will apply, assuming constant costs for wind plant installation and all costs for each scenario. Anyone wanting a more precise result, assuming some costs will increase and others decrease, can do so with more extensive analysis than provided here. Again, such added precision would not likely materially change the results. For example higher gas prices will affect all three of the gas and wind scenarios.
In the non-wind scenarios, the total costs can be determined by multiplying 19.2 TWh x 106 (to convert to MWh) by the levelized cost per MWh. The wind scenario cost are as determined in Part III, This cost can then be divided by the CO2 emissions saved by each scenario.
As already explained in Part I, I am working on the basis that it is better to be approximately right rather than wrong with considerable precision.
Table IV-2 provides the results for the scenarios, assuming coal plants are replaced in all scenarios. Emissions savings are less if other plant types are replaced, for example hydro and nuclear. See this post on the problems of cycling nuclear plants. In the two wind scenarios a range of CO2 emissions savings rates from 0.1 tonnes/MWh (to save dividing by 0 and getting an answer of infinity for the cost of savings per MWh), and a generous 0.3 tonnes/MWh. If this seems unreasonably punitive to wind, review the section on “Emissions” above.
First some sample calculations. The basis for emissions saving is taken to be coal plants that produce CO2 emissions at the rate of 1.1 tonnes of per MWh. For an emissions rate for gas plants at 0.5 tonnes/MWh, the rate of emissions savings is 1.1 – 0.5 = 0.6 tonnes/MWh. So for the gas plant scenario the emissions savings over 40 years are:
Gas plant emissions savings = 0.6 (tonnes/MWh) x 19.2 (TWh) x 106 (converting to MWh) = 11,500,000 tons or 11.5 million tonnes
In the wind/natural gas scenario, assuming the wind plants are replaced, at a wind plant emissions savings rate of 0.1 tonne/MWh the emissions savings are:
Wind savings = 0.1 x 5.7 (TWh) x 106 (converting to MWh) = 570,000 tons or 0.6 million tonnes
Table IV-2 – CO2 Emissions Savings and Associated Costs Relative to Existing Coal Plants
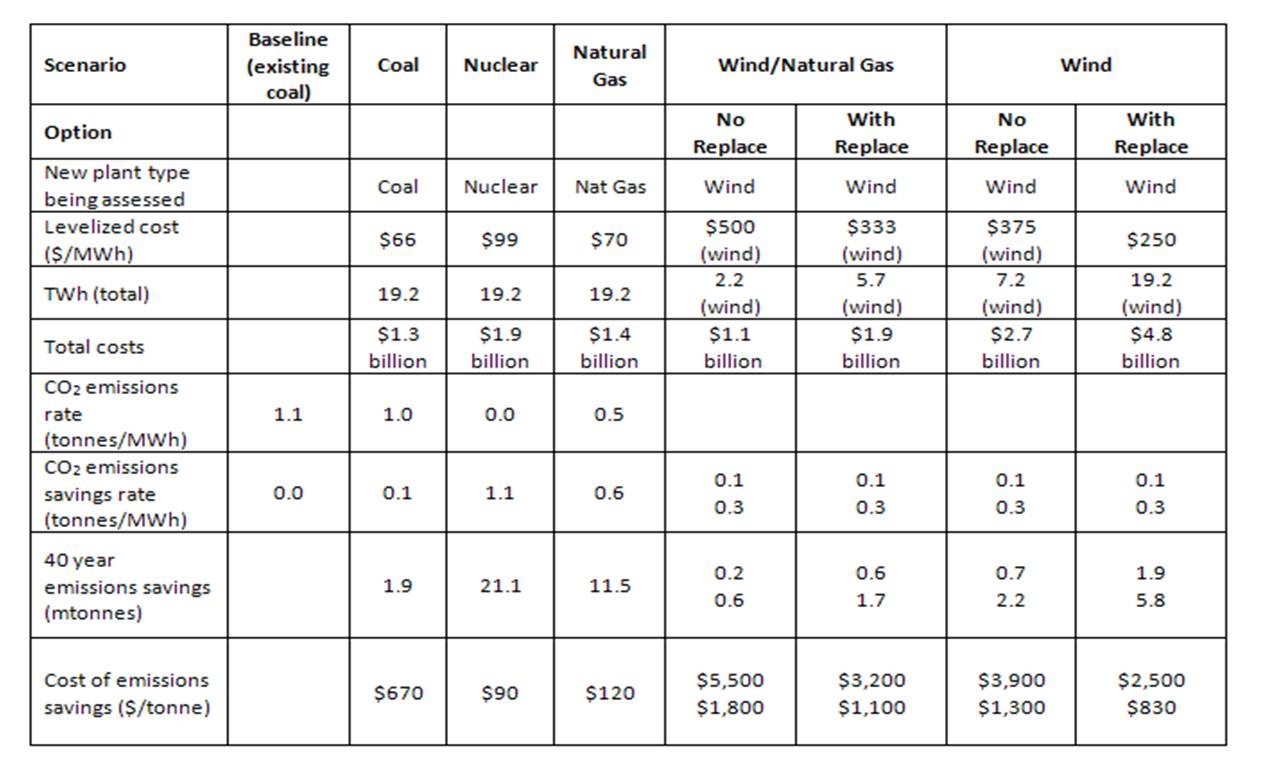
By these measures wind is more expensive by thousands of dollars per tonne of CO2 saved than nuclear or natural gas. The more realistic wind scenarios/options are the “No Replacement” ones, because support for wind cannot persist as reality sinks in.
Note that any contemplated imposition of a carbon tax on fossil fuel plants would not put wind plants at the same cost of emissions savings as nuclear and gas, unless such a tax was thousands of dollars per tonne. As far as nuclear is concerned, wind proponents might try to justify additional costs as well. Remember I used significantly higher implementation costs than the DOE/EIA to provide for such eventualities. In addition such tax on wind balancing plants should be charged to wind, so this becomes a bit of a “merry-go-round”.
In this analysis all plants are given the benefit of their TWh produced even though this includes the energy invested component. Looking at this from the point of view of plant production after deduction of the electrical energy component of EIe would widen the gap between the two wind and the other scenarios.
Implications for the U.S.
Remember the above information is on the basis of 1 TWh in year 0. Table IV-3 translates this information to the US case based on 2010 electricity production of 4,000 TWh. In the same year the US 2010 CO2 emissions due to electricity production was 2,389 mtonnes.[2]
Table IV-3 – Implications for the US
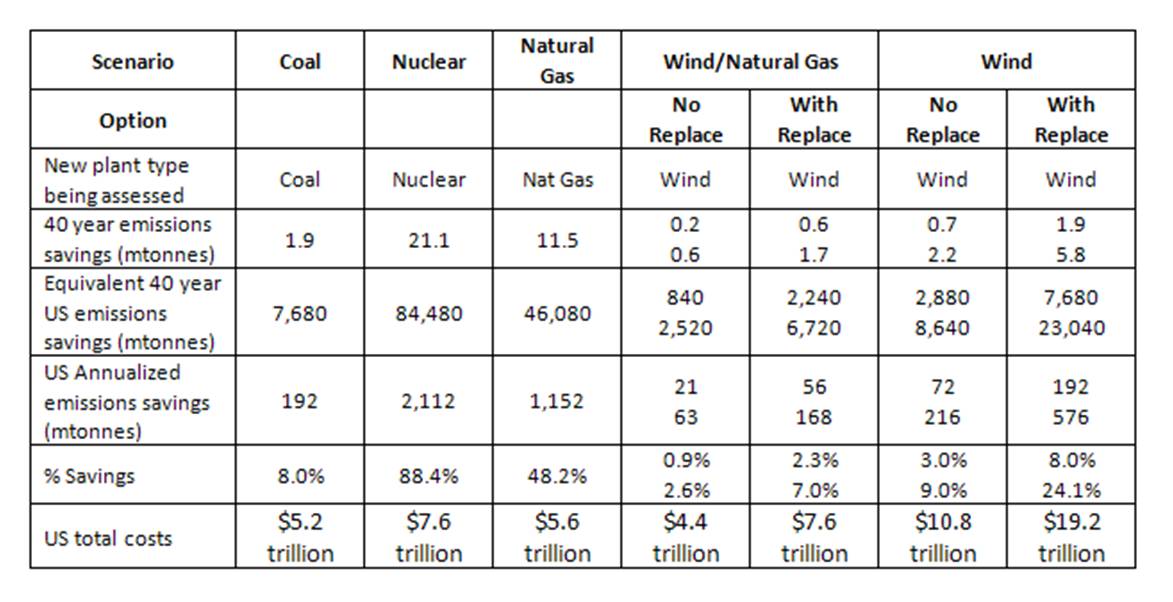
The most likely outcome of pursuing wind as a CO2 emissions reduction strategy is the Wind/Natural Gas scenario with the No Replacement option, as it should demonstrated within this 15 year time frame that wind is not a feasible policy. The sooner the better.
For comparison purposes the Wind/Natural Gas and Replacement Option is more equitable as this is the realistic limit of wind penetration, and all plants being assessed are producing over the period of 40 years. At best, the wind savings are most likely in the range of few percent over the life of the wind plants at a cost of $7.6 trillion, compared to nuclear with 88% emissions savings at the same cost and natural gas at 48% savings for $5.6 trillion.
Coming Next
Part V will provide a brief review some of the many other undesirable aspects of wind plants, all of which are needless and unavoidable if the fundamental feasibility case (technical, financial and operational) for wind is properly evaluated, and, of course, some concluding remarks. In summary, we must stop the folly of supporting the implementation of wind plants, and like industrial-scale, low quality, grid-feeding electrical energy sources.
[1] There are a number of posts for the calculator reflecting changes and improvements, which did not alter the nature of the results. Here are the related posts in order of appearance.
As first introduced, which admittedly contains some “glitches” http://www.masterresource.org/2009/11/wind-integration-incremental-emissions-from-back-up-generation-cycling-part-i-a-framework-and-calculator/
The remaining posts in this first series are Parts II, III, IV and V, which supplies the first set of updates.
Further updates (including a link to access the latest version) and analyses were provided in a two part series starting here.
[2] DOE/EIA (2010). “Electric Power Annual 2010 Data Tables” http://www.eia.gov/electricity/annual/html/table3.9.cfm
Some wind studies I’ve examined have costs at the lower end of this analysis but still many times the cost of power from natural gas. The cost for 12GW amounted (1/3 offshore) amounted to $63B including $17B for 4700 circuit miles of 500Kv transmission. This equates to 25 cents per kWh of which 6.8 cents per kWh is for transmission. (You could build operate and fuel a Gas turbine for less than the cost of the transmisson alone).
But since you still need the gas turbines for backup you only save the fuel cost or about 2-4 cents/kWh.
Spending 25 cents on wind to save 2-4 cents worth of natural gas. What a bargain!!
Instead of building 12GW wind for$63B you could also eliminate the same amount of CO2 by building 4 GW of Gas turbines for $5B to replace old inefficient units. I suspect a similar situation exists in many parts of the country.
The wind in this case reduced CO2 at a cost of $450 per ton or about 30 times that used in the analysis of Waxman Markey.
The cost disparity is so large (wind 5-10 times the fuel it displaces) that one doesn’t need to do a sophisticated analysis of all the operational problems, etc to show its folly.
Power Engineer,
Thank you for your comments, which are welcomed.
I am not surprised that costs you have examined are at the lower end of my results. For example in the case of transmission, there are costs other than those for high voltage transmission lines, which themselves I suspect are subject to closer examination for completeness. Part II provides more information on the grid aspects, including the issues (and costs right down to smart meters) of the supposed “smart grid”. I have seen a major manufacturer’s report that outlines all the problems very effectively for the first half, and then in the second provides all the network solutions that they can provide to address these.
It is interesting to note that The Battle Group’s report on “Transforming America’s Power Industry” (http://www.brattle.com/_documents/UploadLibrary/Upload725.pdf ) could not reliably predict the magnitude of the effect of supporting renewables. This is to be understood given the complexity and unknowns of the grid changes that would be needed, including “Smart Grid” (including demand management) components.
I think it safe to say that no one knows what the grid will look like in 30-50 years, let alone the costs. I also suggest we could spend considerable sums in premature schemes solely to support non-dispatchable renewables, which will likely become stranded costs. In this area I have outlined as best I can the reasons for my estimates. I admit to consciously erring on the high side, but I have found little comprehensive analysis, and I suggest history tells us it is best to estimate high in such matters.
I am sympathetic to your comments about costs alone should be sufficient to make the case. However my approach here is to recognize that it is important to appreciate these other issues to properly understand the total costs and other implications. Unless this is done the approach becomes piece-meal and subject to such arguments that the benefits are so large, and any other disadvantages so inconsequential, as to make almost any cost acceptable – and, oh by the way they will say, your costs are disputed anyway. End of story.
In summary I believe any arguments for or against wind have to be within a broad framework, which I have attempted to provide, and this does not lend itself to a simple analysis. But the math is simple, as it should be.
The myth that wind’s emissions savings are mitigated by cycling has been debunked:
http://www.nrel.gov/electricity/transmission/western_wind.html
Michael,
Nice try.
Because of their highly variable and random production over short time periods (minutes), wind and solar PV cannot be realistically or properly analysed using statistical methods to evaluate real time events. This statistical approach hides the real time impacts, and electricity systems must balance load and generation in real time (again minutes).
To illustrate, I have done some analysis of the BPA wind performance, at 5 minute intervals (which still masks some greater volatility) and 14% wind penetration in energy terms, which shows that, statistically speaking, the standard deviation of the increase in ramping of load minus wind versus load alone is 26 MW. However, the real time effects show over 8 instances per day (one every three hours on average) of over more than three times this level (three standard deviations), with one event per day (on average again) in excessive of 200 MW which is over 8 standard deviations. Note that the ‘averaging’ over time of these events does not mean that their occurrence cannot be more concentrated in real time. There are more ‘black swans’ in wind production than statistical approaches are designed to handle, if you want to avoid severe consequences. For real world experience, talk to the financial industry about this.
Statistical analysis is based on the assumption that the distribution of 99.7% of all events is contained within three standard deviations. Therefore the BPA analysis shows that three standard deviations should exclude only 7 ‘black swans’ or extraordinary events. Over the period measured there were 52 or over 7 times this number. This shows that it is questionable and risky to apply statistical analysis here in connection with our electricity systems on which so much of our well-being depends.
For the purposes of planning reserve requirements based on the use of reliable, dispatchable generation plants in the electricity system (and wind and solar PV are neither), statistical methods have some value.
Having said all this, statistical analysis of wind and solar PV performance may have some value if limited to providing some indication of the relative effect of their use (1) between jurisdictions, and (2) within a jurisdiction between time periods and wind and solar PV penetrations, for example. But, and this is important, it is not valid for the determination of absolute values, especially actual reserves required, stress on wind balancing plants and, importantly, emissions.
I should introduce you to the ‘Statistics Professor’ who some time ago in a comment tried to convince me that statistical methods are applicable in the analysis of real time wind performance, claiming that the ‘square root of the sum of the squares’ formula properly captures the real time effect of combining two random series – in this case the net of wind and load and load alone. Perhaps you already know him, being of like mind on this issue.
In short, you have neither proved your case, nor disproved mine.
It looks like this issue is not going to go away, so for a more complete response I will have to look at completing my BPA analysis when time permits.