Wind Integration: Incremental Emissions from Back-Up Generation Cycling (Part II)
By Kent Hawkins -- November 16, 2009My initial post, “Wind Integration: Incremental Emissions from Back-Up Generation Cycling: (Part I: A Framework and Calculator),” provided an overview of a fossil fuel and CO2 emissions calculator. It showed that industrial wind plants do not provide the claimed reductions in these important areas, which brings into question their value as good public policy.
This post provides some background, a base case and the results of taking necessary additional considerations into account. The base case has two scenarios.
The first is that every MWh of wind production directly reduces the full fossil fuel consumption and CO2 emissions for every MWh of the “displaced” fossil fuel plant, which is a very simplistic view. The second takes some limited considerations into account, which can show that as much of 85 percent of the simplistic-view savings are still achieved. Calculator runs illustrate how similar results can be produced.
Background
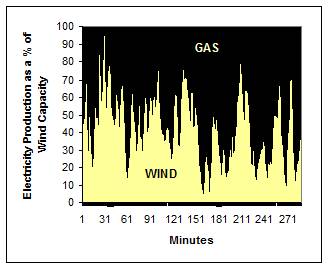
A major consideration is the need for fast-responding gas generation plants to mirror or shadow wind’s highly volatile output, especially during periods of high wind production. Figure 1 illustrates the concept. The gas production is shown in black and is necessary to render wind’s output useful. As the gas production is the complement of that for wind, the vertical axis has to be read in reverse for gas. While operating in a wind-shadowing/wind-mirroring backup role, the gas turbine plants consume more gas and produce more CO2 emissions per MWh than in their normal mode of operation.
Figure 1 – Illustration of the Shadowing/Backup Concept
The calculator treats these two considerations separately. The first, fossil fuel consumption (gas) per MWh, is increased by an efficiency loss factor, or heat rate penalty. The second, CO2 emissions per MWh, is increased by another efficiency loss factor, which is greater than the heat rate penalty and non-linear. This second factor is derived from a paper by White and is not in addition to the heat rate penalty.
The calculator credits wind with the full electricity production contribution as measured over a year, regardless of its short term volatile nature. The question is: what is the effect on gas consumption and CO2 emissions for the combination of wind and gas? As indicated, it is often claimed that industrial wind plants reduce fossil fuel consumption and CO2 emissions by an amount obtained by multiplying wind’s electricity production (in some measure of watt-hours) times
- A fuel consumption factor usually taken, for example, as that for a gas turbine in a normal operation mode, for the first value; and
- A CO2 emissions factor per watt-hour, usually an electricity system average or marginal value, for the second.
This will be referred to as the typical claim. It is often made by wind proponents, including government bodies wishing to promote an industrial wind power policy.
However, the literature on the subject shows a range of opinion for reductions from this typical claim, from only 10-15 per cent through to a total offset and even to the possibility of actual increases in fossil fuel and CO2 emissions. White provides an extensive review of the subject. As an example beneficial to wind, Katzenstein and Apt conclude that there should be only a small reduction from the typical claim, but their analysis requires careful evaluation. Whatever amount claimed, almost all ignore one or more of the factors described in the first post.
As a general comment, and as already mentioned, more comprehensive representation over the range of gas plant production in wind-shadowing/backup mode and wind volatility on a short time interval basis would be needed to produce more accurate fossil fuel use and CO2 production than the calculator. In the absence of such analyses, this calculator represents a good approximation of these effects.
Further, for applicability to a specific jurisdiction, demand characteristics and existing and planned generation plant portfolios would have to be taken into account.
Base Case
As indicated, there are two scenarios:
- The first is that which is often claimed by wind proponents and policy makers and is a simplistic view.
- The second shows the results of introducing a heat rate penalty for CCGT plants used in the wind-shadowing/wind-mirroring backup role. The CO2 emissions increase factor is ignored at this point. This indicates how some analyses, not necessarily by wind proponents, can demonstrate some fossil fuel and CO2 reductions, but less than the above simplistic view.
The wind and gas plant parameters are the same as shown in the initial post.
Figure 2 shows the gas savings in millions of cubic feet per year (MMcf/yr) for the two scenarios. The first, “Typical Claim,” assumes there is no inefficiency factor (heat rate penalty) applied and that every MWh of wind production saves the natural gas consumed by the equivalent gas plant production in normal operating mode. The second shows the reduction due to a reduced efficiency in the gas plant of 15 per cent, which causes increased gas consumption reducing the claims made for wind by 39 per cent.
Figure 2 – Base Case Fossil Fuel Savings
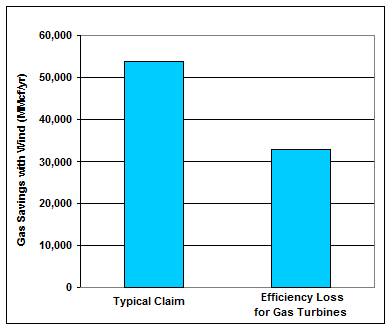
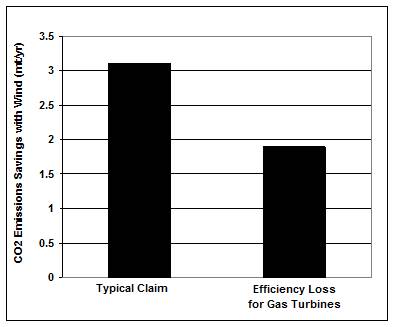
Figure 3 shows the CO2 emissions in million tons per year (mt/yr) based on the same considerations. The same percentage reduction in CO2 emissions occurs.
Figure 3 – Base Case CO2 Emissions Savings
Based on these results, which involve limited considerations, it can be seen how it is possible that some analyses show a degree of savings with the introduction of wind plants. If the gas turbine heat rate penalty is reduced to 10 per cent, the reductions become 17 per cent, that is, the calculator shows values of 83 per cent of the “Typical Claim,” or simplistic view.
This base case will now be compared with the effects of adding the more responsive OCGT gas plants to the mix along with other factors, the results of which are very dramatic.
Inclusion of OCGT Plants and CO2 Emissions Increase Factor
The results shown are for a 75:25 mix of OCGT:CCGT for half the year (assumed high wind production) and 25:75 for the other half (assumed low wind production). This is an input parameter for the calculator that can be varied as well as the percentage of the year to which they apply.
Figure 4 shows this effect on gas consumption. The term “Typical Claim Scenario” is used to capture the change to the “Typical Claim” as a result of using OCGT plants.
Figure 4 – Effect on Fossil Fuel Savings of Introducing OCGT Gas Plants
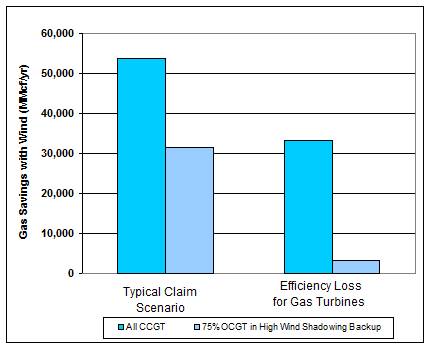
Just introducing OCGT gas plants reduces the gas savings by over 40 per cent as shown in the typical claim scenario. The effect of CCGT 15 per cent heat rate penalty plus the inclusion in the mix of OCGT gas plants, with a heat rate penalty of 20 per cent, reduces the gas savings to almost zero.
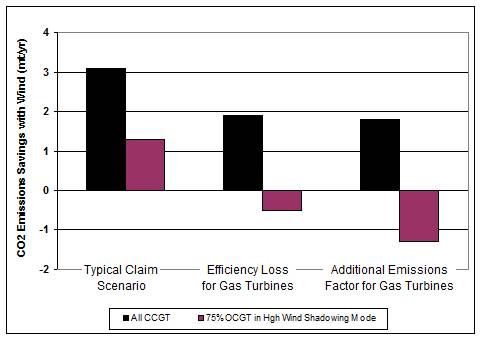
Figure 5 displays the effect on CO2 emissions. Note that with the introduction of OCGT plants:
- Even including only the heat rate penalties of 15 per cent for CCGT and 20 per cent for OCGT plants, without the additional factors for CO2 emissions, the emissions reductions become negative, that is, there are more CO2 emissions with wind present than if CCGT plants were carrying the same load alone.
- With the associated increase in emissions efficiency factors (17 per cent for CCGT and 34 per cent for OCGT), the resulting CO2 emissions savings become substantially negative.
Figure 5 – Effect of Introducing OCGT Plants on CO2 Emissions Reductions Factors
I suggest that the reason that such results are not normally seen is in part due to the unavailability of the necessary data to perform the required analysis. As already indicated, the calculator provides an interim assessment and framework until sufficiently comprehensive studies can be performed.
Effect of Reduced Wind Capacity Factor
The previous analyses assigned wind a capacity factor of 28 per cent, which may not be achievable for a number of reasons, for example: reduced availability of good wind sites as wind penetration increases and curtailment of wind production, particularly in high wind periods, by the system operator.
The technical appendix to Part I shows the effect of a range of wind capacity factors from 20 to 28 per cent. The lower capacity factors result in further and significant increases in fossil fuel use and CO2 emissions with the presence of wind plants.
Conclusions
As with any such study, one can object to some of the considerations used in developing this calculator. Nevertheless, robust conclusions can be drawn. More detailed information on the calculator is available on request.
The next step would have to be an integrated and extensive analysis of industrial wind power output for a lengthy time series, with data provided for short time intervals of minutes, a similarly extensive analysis of gas turbine plant (and other generation plant types as desired) operation in wind-shadowing/wind-mirroring backup mode, modeled against a background of a demand profile with the same type of time series, and taking into consideration the underlying generation portfolio and grid topology. The analysis would also have to include changes in the generation portfolio as a result of the introduction of wind plants, for example the increased need for OCGT gas plants.
This appears not to have been performed to date, which is surprising given the importance of the subject. In the meantime, it can reasonably be asserted that industrial wind plants do not come close to claimed benefits in terms of reductions in fossil fuel consumption and CO2 emissions. When considerations of the impact on the gas plant used in this calculator are applied, such benefits approach zero and can be reversed to add to the electricity system consumption of fossil fuel and production of CO2 emissions.
In summary, relative to CCGT plants operating alone with the same capacity as the wind plants:
- In the high range of possible annual capacity factors for wind, at 28 per cent, with the introduction of OCGT gas plants and reduced efficiency considerations for the wind shadowing/backup, the calculator shows that the presence of wind results in:
- Almost zero gas savings; and
- An increase in CO2 emissions of 12 per cent.
- In the low range of possible annual capacity factors for wind, at 20 per cent, the above results become:
- An increase in gas consumption of 10 per cent; and
- An increase in CO2 emissions of 25 per cent.
Part II continues Hawkins’ rationale for developing a means–a calculator–for studying all the thermal implications involved in wind integration. Essentially, what he calls for is a chronological load dispatch analysis sufficiently fine-grained to observe the behavior of all the generating/regulating units necessary to accommodate wind volatility. He focuses on natural gas units because, on most grids, this would provide the rapidly responsive generation necessary to follow and balance wind flux–which is in addition to load flux and even more desultory, since it’s completely random. However, his calculator could also factor coal units, particularly for grids like the PJM that have so much coal generation. There are coal plants that, with inefficient ramping, producing heat rate penalties approaching 40%.
As I said in another post, Hawkins poses a method for examining wind’s ability to offset carbon emissions throughout a grid’s entire cycle. Presently, for a variety of not very good reasons, there exists no systematic realtime load dispatch measurement of carbon emissions offsets. Consequently, any statement about them bears the same level of reality as the BCS college football polls. And none of the federal subsidies for wind are indexed to actual measured reductions in CO2.
I hope others will build upon Hawkins’ work here by at least insisting that the bedrock claims for wind–that it will reduce substantial amounts of CO2 and back down the fossil-fuel industry–be supported by actual evidence.
[…] pair of posts at Master Resource (part I, part II) explore the degree to which variable wind power leads to lower efficiency and increased air […]
Dear Mr Hawkins,
as indicated i the message that I left yesterday (4 Dec 2009) in your blog (under Part I of your work on Wind Integration), I am part of a group in Belgium who is intended to build a Calculator similar as the one you have now developped. Our objective is, naturally, the same as yours. Now, since you have already set the foundations for such work and since you offer (In part II) to share some of your experience, I would very much like to get in touch with you asap to discuss futher the matter. You can reach me through e-mail (patrice.doultremont@gmail.com) or by phone (0032 475 700 077).
I thank you in advance,
P.O.
Patrice,
I have tried to reach you unsuccessfully at the email address you provided. Please contact me at kenth@kos.net
Kent
Excellent analysis – quite refreshing. I would appreciate any additional information you are willing to provide on the calculator.
Best regards.
Several agencies in California are currently running a series of computer simulations to examine the operational impacts of a 33% Renewable Portfolio Standard and one of the questions they expect to answer more definitively is the extent of any reductions in gas consumption and CO2 emissions. Mr. Hawkins certainly raises a good point, but if more detailed studies support his point, the alternative is likely to be addition of very expensive storage that will raise the cost of renewable energy even further rather than any meaningful scaling back of renewable energy development.
[…] Part 2 […]