Wind Consequences (Part II: Analysis Approach and Implementation Costs)
By Kent Hawkins -- September 18, 2012Part I yesterday provided an introduction and summary of results; this post describes in more detail the analysis approach and implementation costs. Parts III and IV will cover the full costs and other results.
As will be seen, dealing with wind is not as easy as some would suggest.
Analysis Approach
This analysis looks at a 13 year period (years 0-12) in which the demand growth and plant retirement due to obsolescence/age will be each 2% per year compounded. Assuming year 0 is 2012, year 12 is 2025. Table II-1 shows the situation at year 12.
Table II-1 – Year 12 Situation for a Year 0 Demand Level of 1.0 TWh
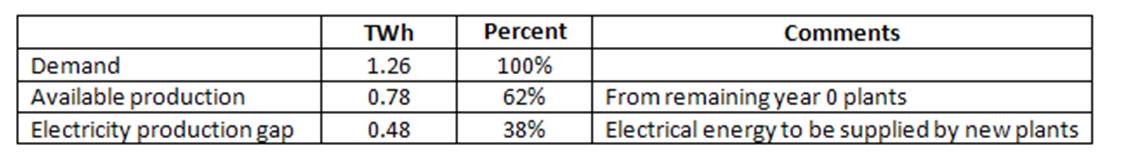
Using demand of 1 TWh in year 0 allows easy scaling for a particular jurisdiction. For example in 2010 the total US electricity production was about 4,000 TWh.
The profile of the new generation capacity to meet the electricity production gap of 0.48 TWh would normally be a combination of plant types depending on a number of considerations. However in most cases, this analysis shows the effect of using one plant type only to meet the electricity production gap. This is done to illustrate the performance of the energy source involved.
When wind is present, another plant type must also be included to balance wind’s persistent erratic behavior. This is otherwise redundant new capacity, meaning over and above that which would normally be required. There are two “wind” scenarios. One is a combination of wind and natural gas to meet the electricity production gap. Given the belief, by some at least, that more extensive wind implementation is desirable, the second scenario addresses this, allowing wind to provide the full 0.48 TWh, which we will see is not feasible.
My calculations are simplifications of complex considerations. There are more precise/sophisticated approaches in other studies, which may appear more impressive, but these will be obscure to many, and not necessarily more accurate, due to some or all of the following:
- Sophistication of the approach, meaning the assumptions and treatment of the considerations are so difficult to understand that the whole process is largely inaccessible to many people. It also has the appearance of validity because of this. Further the authors themselves might be blinded by this.
- Inappropriate use of complex mathematics, which is often a substitute for thinking/understanding on the part of the author(s) and readers.
- Accuracy and incompleteness of the underlying public data, especially emissions data.
- Omission of some of the necessary considerations, as included here, resulting in an even more “simple”, but superficial, approach, which does not produce useful results.
So my analysis falls between these two positions. It is more straight-forward and transparent, and I suggest sufficiently indicative of realistic results. See the DOE/EIA assumptions for electricity calculations in the Energy Outlook 2012 for an example of more complex treatment of the issues.
However complexity is hard to avoid given the nature of the matter. So the logic I use is complex because of the many factors at play, and this is unfortunate but necessary. On the other hand, the mathematics that follows is reasonably straight forward, the most complex being the determination of the “payment” amount for a given interest rate over time for a capital investment.
In the paraphrased words of Nassim Taleb, one can be wrong with great precision (for whatever the reason and by whatever means) instead of approximately right.[1] As well one can be wrong by being simple, but superficial.
There is so much detail that it is not practical to present it all in this series. Those interested can see it at Calculations.
Scenarios Analyzed
The scenarios analyzed are for coal, nuclear, natural gas, onshore wind/natural gas combination, and onshore wind to meet the electricity production gap, respectively. Offshore wind is not considered because it will perform no better overall than onshore.
The analysis draws on information in DOE/EIA publications.[2] For new plant implementations the “advanced” plant type information is used. In the natural gas cases, performance is taken to be the average of advanced combined cycle and advanced combustion turbine information. This combination in the natural gas scenario provides a good baseline for comparison purposes.
Table II-2 shows results in year 12 for these scenarios, assuming that in each case the energy source(s) indicated provides the total electricity production gap.
Table II-2 – Results for Year 12 by EROEIe Performance
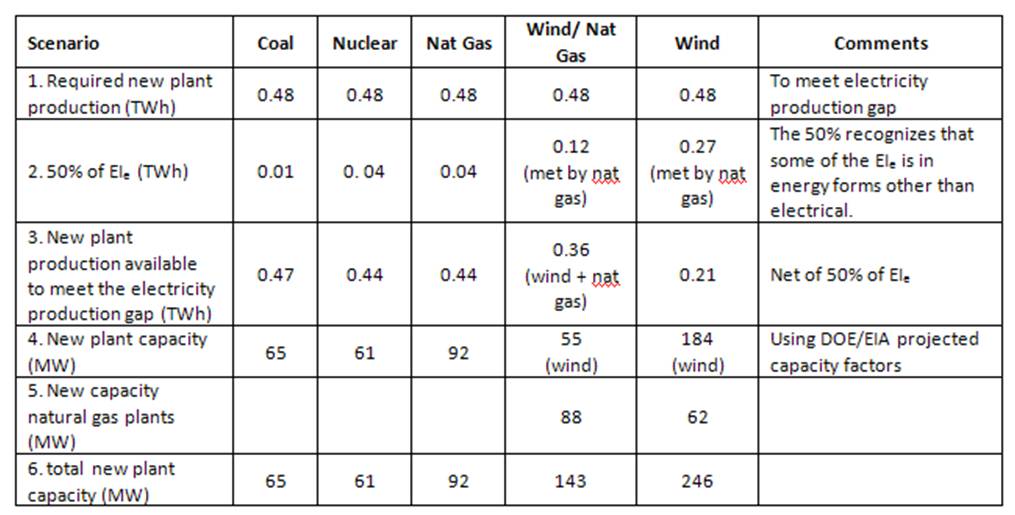
At a high level of analysis, it appears that all energy sources identified in each scenario can fill the production gap to meet the future demand, as shown in row 1. Row 3 demonstrates the effect of deducting 50% of the energy investment (EIe) required for the new electricity infrastructure. This shortfall increases dramatically as EROEIe decreases. Note the 50% factored electrical energy component of EIe component in row 2 does not contribute to meeting the demand shown in row 1. It represents an increase in demand.
The shortfall due to the factored EIe (line 2) may be made up from existing plant capacity, increasing the capacity factor for new plants or by adding additional new plants. This is a complex matter and depends in part upon the profile of the plant portfolio retired/added and those remaining over the analysis period. For example existing or new hydro generation plants typically have a low capacity factor and cannot realistically be relied upon for more production, and existing or new plants supplying base load already have a high capacity factor and consequently are not available for additional production. In the higher EIe scenarios, it is assumed that additional new plant capacity is required.
For the wind/natural gas scenario, duplicate, reliable, flexible capacity, that is 88 MW of gas plant capacity, is required for wind balancing. In this analysis it is higher than the full wind case for a number of reasons:
- The 38% wind penetration represents a level that is not supportable within an electricity system without substantially more gas plant balancing capacity than that shown here.[3] This is a complex scenario to analyze and the most straight forward approach is to assume substantial wind curtailment, or some other form of dumping, such as export or paying some customers, who are able to accommodate it, to take the excess electricity produced. The analysis assumes an annualized average of 55 MW for wind, so curtailment would occur to a high degree when the wind electricity flux exceeds 55 MW (MWh/h) in real time. Alternatively, gas plant capacity would be required to meet demand during periods of real time wind production below 55 MW. The wind balancing gas plants will operate at lower efficiencies as a result.
- Higher gas plant capacities would be an alternative approach, otherwise wind may have gained too much in this analysis. Some attempt has been made to indicate this, primarily to introduce it as a factor to be noted, but it is not easy to project the amounts involved, because this would be dependent on the inevitable curtailment levels described above. This approach would also mean some of the existing plant base would have to be reduced to accommodate the combined wind/gas production, which may or may not be feasible, depending on the profile of that portion of the total plant fleet. There are cost consequences in this connection, which are covered below.
To remove the wind scenario would leave open the question as to its consequences. So it has been left in with the understanding that it is not a realistic option at all, but some measure of these consequences can be determined.
There are other factors not covered in the wind scenarios. First is the effect of the inevitable lower wind capacity factors as penetration increases due to the better sites being already taken. Second, payments that would likely be made to (1) wind plant owners to compensate them for curtailment, otherwise they would not be financially viable (alarms bells should sound here), and (2) conventional plant operators who will be required to reduce production, otherwise reasonably expected to be earned, due to policies requiring wind to take precedence, as it occurs.
Finally, do not be distracted by reports of wind causing low (or even negative) electricity rates in the wholesale markets. The costs shown here must be paid by someone and will appear in taxes and retail electricity rates in the jurisdiction hosting the wind plants.
The adverse effects of wind imposition increase with wind penetration. Table II-3- provides this for the wind scenarios, which is aggressive at 11%. This is in the range of the most wind intensive countries in Europe (including Denmark after taking exports into account), which are at domestic saturation levels. Remember though that these countries are dependent on international markets for their otherwise unsustainable wind turbine manufacturing industries so must live with the consequences to promote the policy. The US wind penetration in electrical energy terms in 2010 was 2.3%.[4]
Table II-3 – Wind Penetration
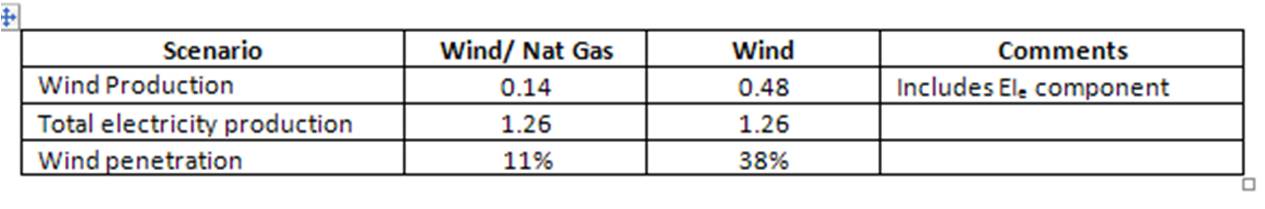
Be careful with wind penetration statistics to properly understand them. First they should be in energy terms, not capacity, and should be free of exports and any special treatment of curtailment.
New Generation Plant Implementation Costs
Table II-4 shows details of the cumulative overnight implementation costs for new plants at year 12. Reserve considerations are covered in Calculations. In the wind scenarios these are part of all the total costs associated with the persistent erratic nature of wind. This starts to explain the significant variance with DOE/EIA reported amounts when levelized costs are shown in Part III. So the following information starts on the path of providing a basis for comparison to the other plant types.
Table II-4 – New Plant Cumulative Overnight Implementation Costs at Year 12
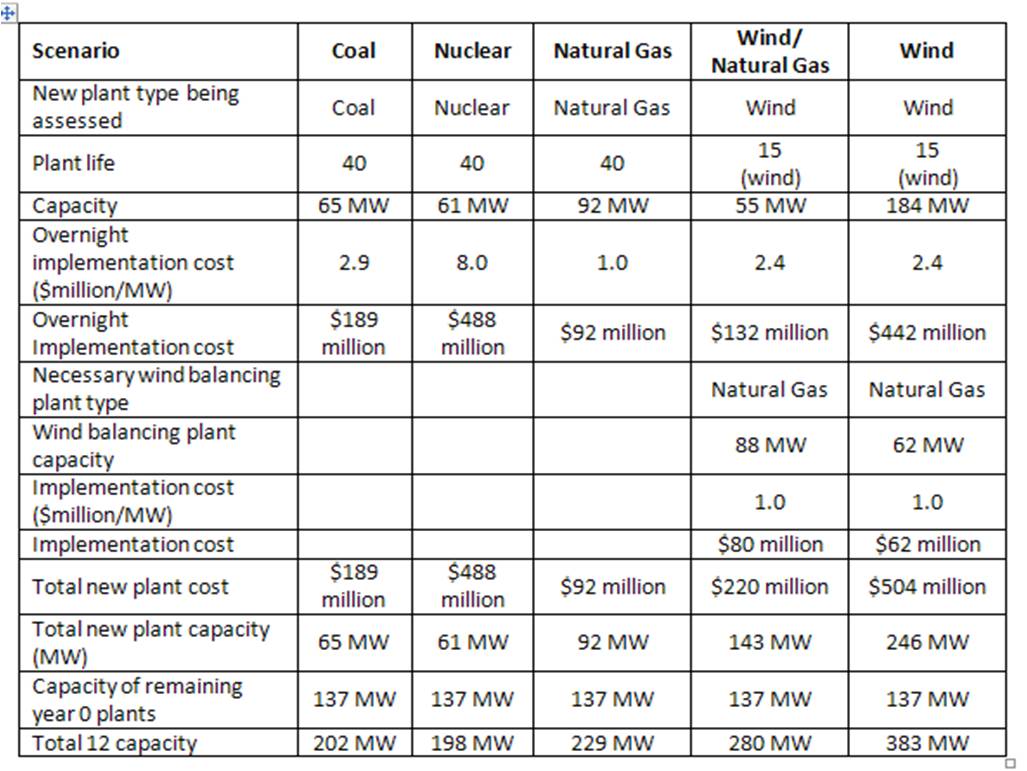
DOE/EIA overnight capital costs are used except in the nuclear scenario, for which a higher implementation cost of $8.0 per MW (versus the DOE/EIA cost of $5.3 million) is taken to be conservative. The wind/natural gas case has lower implementation costs than nuclear largely because of the gas plant contribution, which provides 70% of the electricity production gap due to the assumed 30% capacity factor for wind. A more instructive comparison can be seen in the wind scenario.
However, remember that in both wind scenarios, the wind plants produce for only 15 years versus the other plant types, which have longer lives. For comparison purposes, both wind scenarios should assess the costs for two wind plant replacements over the 40 year period, which would raise the wind/natural gas new plant cost to $476 million and the wind scenario to $1,389 million. As we will see this is not the total picture.
For the Table II-4 values, the US investment, excluding unique-to-wind grid investments, for the wind/natural gas case would be $212 million (per TWh) x 4,000 (total US TWh in 2010) = $712,000 million or $712 billion and consistent with my findings elsewhere.
In the wind/natural gas scenario the gas plant capacity is required to ensure wind is fully balanced. Some of this capacity is generating electricity that is balancing wind, but coincidentally is meeting some demand. The full plant implementation costs are attributed to wind, because wind requires that capacity to be there for it to work in an electricity system. When full wind costs are allocated in later posts, the “normal” costs of the gas plant operations and maintenance, including fuel costs which are significant, are not attributed to wind, even though the energy flux is part of the necessary wind balancing. However there is an efficiency loss for wind balancing plants and this is attributed to wind costs.
A baseline of the minimum total capacity needed to meet future demand appears to be in the range of 198-229 MW per TWh of electricity production (Table II-3). An analysis in Calculations supports 230 MW. The coal and nuclear scenarios show lower numbers because of their high capacity factors, and the simplifying assumption that each scenario, except for the wind/natural gas combination, shows the effect a single fuel source used to meet the electricity production gap.
So, in the wind/natural gas case an additional (that is over and above what would normally be required to meet demand) 50 MW (280–230 MW), or 91% of the wind capacity is needed for 11% wind penetration. This additional capacity is fairly consistent with the concept of wind capacity credit forecasts from the German Energy Agency (dena) for 8% wind penetration, which shows that additional redundant capacity of 94% of the wind capacity is required.[5] According to dena and other sources, capacity credit decreases as wind penetration increases, so the new gas plant capacity here is likely understated for 11% wind penetration.
To further understand the impact of the wind scenario, Table II-5 scales to U.S. electricity system the plant types being assessed.
Table II-5 – Scaling Capacities to the U.S. Electricity System of 1,100 GW
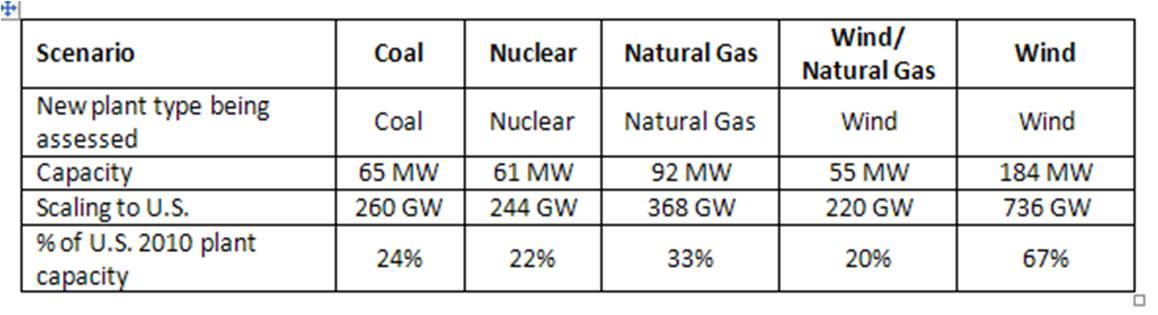
In the wind/natural gas scenario adequate wind balancing capacity has also been added to absorb wind’s persistent erratic behavior. In the wind scenario, as already noted, considerable wind curtailment would have to occur otherwise the remaining 364 MW of the U.S. generation capacity (1,100 – 736) would be totally inadequate to balance wind. This is not a recipe for a reliable electricity system.
Grid Costs Unique to Wind
Generally speaking, the existing electricity grid is a distribution network to users from centralized generation plants, which are sited depending upon need. It is established to serve users. Changes to this grid will be necessary over the period studied due to replacement, increases in demand, including regional shifts in demand, and upgrades or improvements in grid technology. The provision of economic, reliable electricity, as and when required, is a social need and these costs should be shared amongst all generation sources.
On the other hand, again generally speaking, grid changes needed to accommodate wind are for energy collection, otherwise not needed long distance transmission to demand locations and user demand management systems needed to serve wind’s shortcomings. In other words, grid changes unique to wind plants, are primarily due to (1) the dispersion of the energy source (fuel), wind (and solar radiation), (2) the need to site these plants where the energy flux is strongest, not necessarily near to demand centers, and, (3) such other technologies (such as smart meters) that purport to facilitate the integration of unreliable, random wind production through possible demand limitation and conveniently provide the electricity cost rate capability needed to finance them. They serve the wind plants.
These grid changes unique to wind are substantial, with a required monetary investment of about the same order of magnitude as the wind plants. In smaller wind penetrations with curtailment not as large, some transmission lines must have the capacity to carry up to full wind production, not the annualized average at 30% of capacity. I have not seen a comprehensive study and these costs are hard to quantify, but I have previously made an attempt to do so here and here. Table II-6 shows these cost estimates for the scenarios.
Table II-6 – Overnight Grid Implementation Costs Unique to Wind
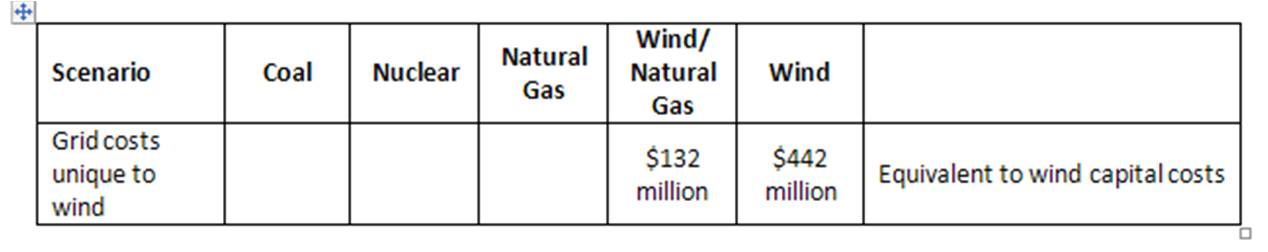
The grid costs are amortized over 40 years. At the 15 year plant life for wind plants three ongoing options present themselves.
- Option 1. – Remove and do not replace the wind plants. In this case the unique-to-wind grid elements may represent stranded costs or they might be useful in the ongoing electricity system, or some blend of these two considerations. Most likely they will be stranded costs.
- Option 2. – Re-invest in new wind plants in the same location to the capacity that existed at year 15. In this case the above grid elements would be needed as before. This analysis provides for this.
From an EROEI point of view, the grid changes unique to wind are included in the net EROEI calculated for wind. The EI burden of these grid changes is assumed to be 1 year of wind plant production, added to that of the wind plant EI. This represents one-half of the EI energy burden for the wind plants themselves, but could be larger.
Claims are often made about the smoothing benefits of geographic dispersion of wind plants. Although this might seem intuitively so, real experience shows this does very little improve wind’s overall persistent erratic behavior.[6]
For information on smart grid issues, and the reasons for not moving too quickly into this area, see my articles at MasterResource.[7]
Coming Next
As interesting and informative as the overnight implementation costs for plants and grid changes might be, they only show part of the cost picture. Wind is not doing well, and it does not get any better. Simply put: wind is not a “plug and play” option.
The next post will develop the full costs, which will take into consideration whether or not the wind plants are replaced after 15 years. My expectation is that by 2025, likely much sooner, we will have finally come to our senses that grid-feeding, industrial-scale wind is not feasible and not worthy of commercialization.
[1] Taleb, Nassim (2007). “The Black Swan”, Random House, p74
DOE/EIA (2012). “Levelized Cost of New Generation Resources in the Annual Energy Outlook 2012” http://www.eia.gov/forecasts/aeo/electricity_generation.cfm
DOE/EIA (2012). “Assumptions – Electricity Market Module” http://www.eia.gov/forecasts/aeo/assumptions/pdf/electricity.pdf
[3] Denmark is a case in point. It has a wind penetration as a percentage of domestic consumption in the high twenties. It manages this by exporting the majority of the wind production to Norway/Sweden where the combined hydro capacity is 30 times Denmark’s wind production. For more information see “Peeling Back the Onion of Denmark Wind (Part III – Wind Electricity Used in Denmark”, at http://www.masterresource.org/2010/10/denmark-part-iii-internal/
[4] DOE/EIA (2011). “Electricity: Detailed State Data”, first spreadsheet. Penetration calculated from totals at bottom of first spreadsheet. http://www.eia.gov/electricity/data/state/
[5] Study commissioned by the German Energy Agency, Deutsche Energie-Agentur GmbH (dena) (2005), “Planning of the Grid Integration of Wind Energy in Germany Onshore and Offshore up to the Year 2020 (dena Grid study)” http://www.susplan.eu/fileadmin/susplan/documents/dena-grid_study_summary.pdf. Wind capacity credit can be calculated from Tables 1 and 5 in the Appendix as follows for 2010: 1.8 (GW statistically guaranteed) / 29.8 (GW wind installed) = 6%. This means 94% of wind capacity has to be provided by redundant reliable capacity to ensure overall electricity system reliability (at a fairly liberal 99%). Actual wind penetration in 2010 was only 37.5 TWh, or 6% penetration, lower than 2005 projections of 29.8 (GW) x 0.18 (CF) x 8760 (hours per year) = 46,989 GWh or 47 TWh. http://www.renewableenergyworld.com/rea/news/article/2011/03/new-record-for-german-renewable-energy-in-2010 . This suggests that the projected penetration was expected to be about 8%. The conclusion is that more gas plant capacity is needed than shown in my calculations above. For more information on capacity credit considerations see http://dialogue.usaee.org/index.php?option=com_content&view=article&id=95&Itemid=113
[6] The following is a list of references on this subject:
http://www.ref.org.uk/attachments/article/227/info%20note%20ref%20%20poyry%2031%2003%2011.pdf
http://www.slideshare.net/JohnDroz/energy-presentationkey-presentation slides 70-73
Wind Power in Ontario: Quantifying the Benefits of Geographic Diversity
http://www.wind-watch.org/documents/site/uploads/oswald-energy-policy-2008.pdf
http://aefweb.info/data/Wind%20farming%20in%20SE%20Australia.pdf
[7] Hawkins, Kent (2011). “The Smart Grid and Distributed Generation: A Glimpse of a Distant Future” http://www.masterresource.org/2011/04/the-smart-grid-and-dg/ and (2010) “Smart Grid Problems Revealed: The NERC Study” http://www.masterresource.org/2010/08/smart-grid-nerc/