Wind Integration: Incremental Emissions from Back-Up Generation Cycling (Part V: Calculator Update)
By Kent Hawkins -- February 12, 2010Why has California expressed concern over the EPA holding up approvals for natural gas-fired power plants?
Answer: because state regulators know that California’s gas plants are crucial for establishing new wind and solar projects. After all, firming intermittent power sources is essential short of employing cost-prohibitive battery packs to continuously match supply to consumption.
But the analysis can go a step further. What if the gas backup actually runs more poorly in its fill-in role than if it existed in place of the wind and/or solar capacity? It does run less efficiently, in fact, creating incremental fuel use and air emissions that cancel out the fuel/emissions “savings” from wind.
Thus California should go a step further than just allowing new natural gas capacity. Regulators should rethink the rational of wind per se and block its new capacity–if only by removing the government subsidies that enable industrial wind power in the first place.
Background
Parts I to IV (links provided at end) introduced an analytic framework and calculator as a working hypothesis to assess the impact of industrial-scale wind on fossil fuel consumption and CO2 emissions. This post, Part V, provides an update to the calculator. The methodological framework has not changed, and the need for confirmation from actual performance data using extensive real-time local dispatch analysis at finely grained time intervals capable of accurately and sufficiently assessing how wind affects all the variables within the electricity system remains. In summary, the calculator:
(1) refines the emissions rates for the fuel plants modeled;
(2) improves the manner in which fossil fuel consumption is calculated, which increases the amounts previously reported; and
(3) adds a coal plant scenario.
This update also includes examples of the use of some of the input parameters to incorporate subtleties not considered in Part I and Part II.
A number of phrases can be used to reflect the wind shadowing/backup issue, for example “wind mirroring” and “wind balancing”. For ease of continued reference the terms “wind firming” will be used, and for the combination of wind firming plus wind the term, “firmed wind”. An illustration of this relationship was provided in Part II, Figure 1. Wind proponents claim that this relationship is “frictionless” and does not provide significant inefficiencies. The updated calculator continues to demonstrate that the introduction of wind power into an electricity system increases the fossil fuel consumption and CO2 emissions beyond levels that would have occurred using efficient gas plants alone as the providers of electricity equivalent to the firmed wind.
Derivation of Fossil Fuel and CO2 Emissions Increases
The same method is used as before and is represented graphically in Figure 1. It is derived from information in Reduction in Carbon Dioxide Emissions: Estimating the Potential Contribution from Wind Power and shows the effect on percent increases in CO2 emissions due to reductions in generation plant efficiency (heat rate penalty). To illustrate: a 20% loss in efficiency produces a 21% increase in CO2 emissions for CCGT plants; a 29% increase, 29% for OCGT plants; and a 28% increase for coal plants using bituminous coal. One change, the refinement, is to determine the percentage for all CO2 emissions increases from the top end of the efficiency for each plant type. This produces slightly lower values than previously used.
With respect to coal plants there are a number of variables that require assessment, such as identifying the kind of coal used and the type of plant deployed. To avoid becoming too complex, the behaviour of only bituminous coal plants is evaluated.
Figure 1 – Fossil Fuel and CO2 Emissions by Plant Type and Efficiency
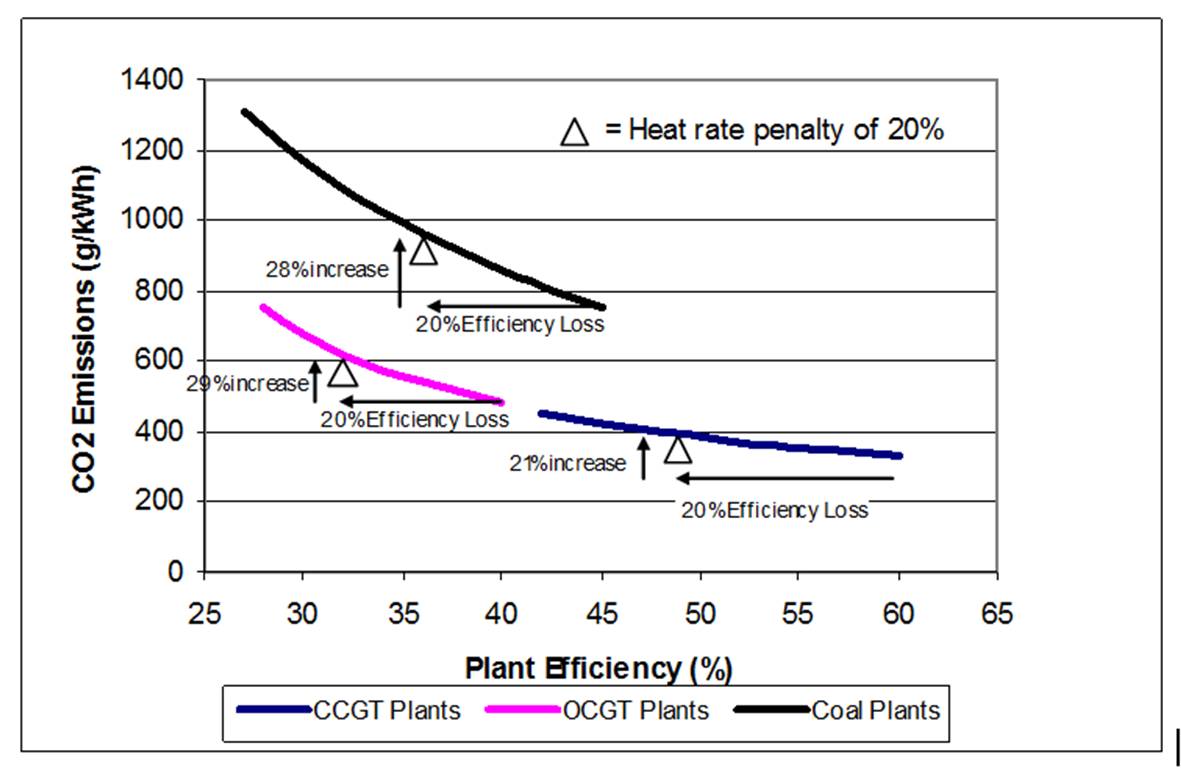
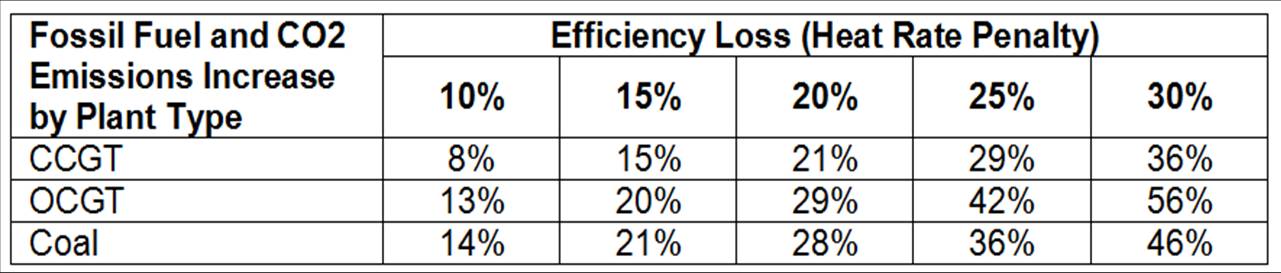
Table 1 shows the increases in CO2 emissions and fossil fuel consumption (as it is in direct proportion to the CO2 emissions) of the three plant types for a range of efficiency losses derived from Figure 1.
Table 1 – Fossil Fuel Consumption and CO2 Emissions Increase for Plant Efficiency Loss
There is inevitably some controversy about this. There are studies that show these effects are small, but close scrutiny finds them to be limited or lacking in some important way. Examples are those relying on macro analyses of a nation’s energy use, with the assumption that the introduction of wind provides little or no inefficiencies at lower levels of analysis. This is the main reason why I emphasize the need for a comprehensive framework at the appropriate grid level, and have attempted to provide one. The next step remains the detailed analyses to reflect the real-time effects as described in the introduction.
To illustrate that there is a very notable impact on fossil fuel consumption and CO2 emissions from fossil fuel plants mirroring wind’s frequent and extensive volatility, consider the dramatic difference in miles per gallon of gas (and resulting emissions) when driving in the start/stop, speed-up/slow-down conditions in the city versus driving at a steady rate on the highway.
In spite of this driving analogy, if you take the view that these effects are zero to negligible (and rely on studies that “establish” this), then the calculator will show results accordingly. On the other hand, there are others who will argue for higher efficiency losses than Table 1 shows, for example 40%. For the calculator runs below, mid-range values between these two opposite views were selected, rightly or wrongly assuming that this is where the action takes place.
Applying Efficiency Loss and Other Factors to Calculator Runs
The calculator starts with a specified amount of wind capacity and calculates the electricity produced over a year (MWh/y) assuming operation at 100% capacity, ignoring scheduled and unscheduled maintenance. 100% is used as wind production can vary over its full range of capacity. This represents firmed wind electricity, which is comprised of wind (20-30%) and wind firming (70-80%) generation. The calculator compares the effect on fossil fuel and CO2 emissions of this firmed wind production to that of same generation from CCGT plants operating alone, that is, without the presence of wind in the electricity system (“no wind” case). No conclusions are made about the gas plant capacities involved.
Table 2 provides the input parameters used in the two calculator runs shown in the next section. Because wind production tends to be low for about half of the year (typically warm months) and high for the remainder (typically cool months), the calculator allows for input parameters to be different for these two periods. The proportion of the year for each and the amount of wind production in each can be varied.
Other considerations, not attempted in Parts I and II, can be looked at. For example:
- The CCGT:OCGT mixes can be altered in more detail.
- With sufficient production from fast reacting OCGT plants, CCGT plants in the wind firming role might be able to operate at higher efficiencies. In this case the calculator input for the fossil fuel and CO2 emissions increases for CCGT plants can be set at lower values, especially as the wind capacity factor decreases.
Table 2 – Input Parameters For Calculator Runs Used
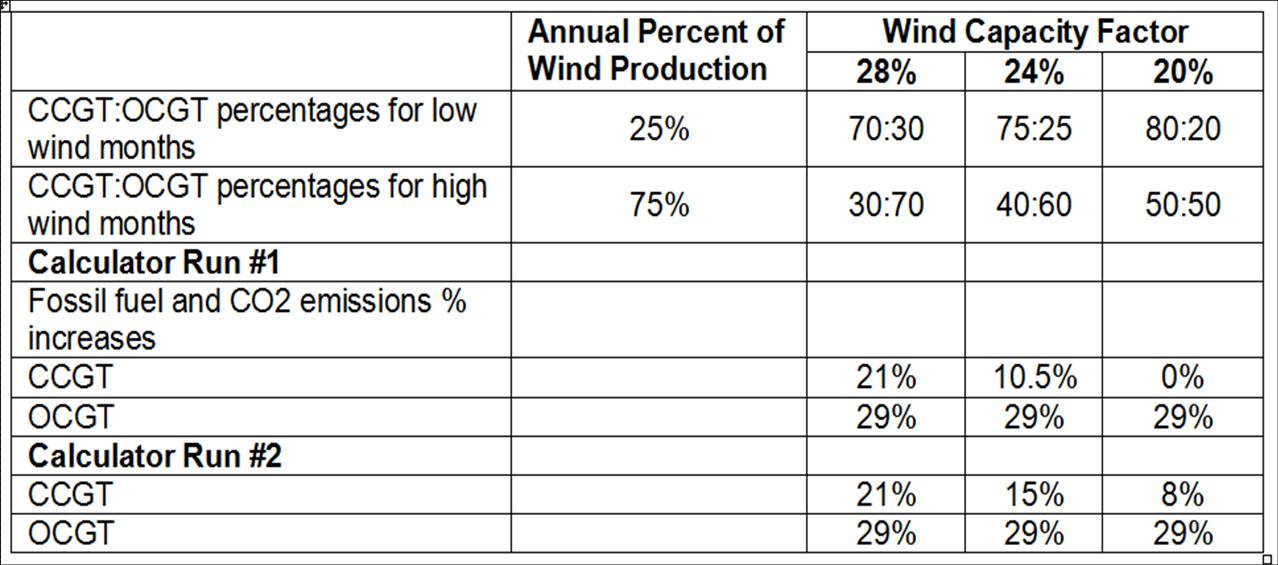
As wind capacity factor is decreased it is reasonable to assume that wind volatility will also be reduced, in part due to wind curtailment during its highest and most volatile periods. This is reflected in:
- The higher percentages of CCGT in the mix
- The reduced percentage factors for fossil fuel consumption and CO2 emissions for CCGT plants.
It should be remembered that the typical wind proponent claim for fossil fuel plants in a wind firming role, based on simplistic considerations, is that there is no need for (1) efficiency loss considerations and consequently no fossil fuel and emissions increases over efficiencies experienced in “normal” operations; or (2) the introduction of faster-reacting gas plants, such as OCGT.
Gas Plant Results
Figures 2 and 3 show the results of the calculator runs for the Table 2 parameters. In all cases the fossil fuel consumption and CO2 emissions show an increase with the presence of wind (negative values in the charts).
As might be expected the increased gas consumption and CO2 emissions with the presence of wind increases as the wind capacity factor increases. This reflects the increased amount of volatility of wind production, especially during high wind production periods.
Figure 2 – Fossil Fuel Savings Compared to “No Wind” Case
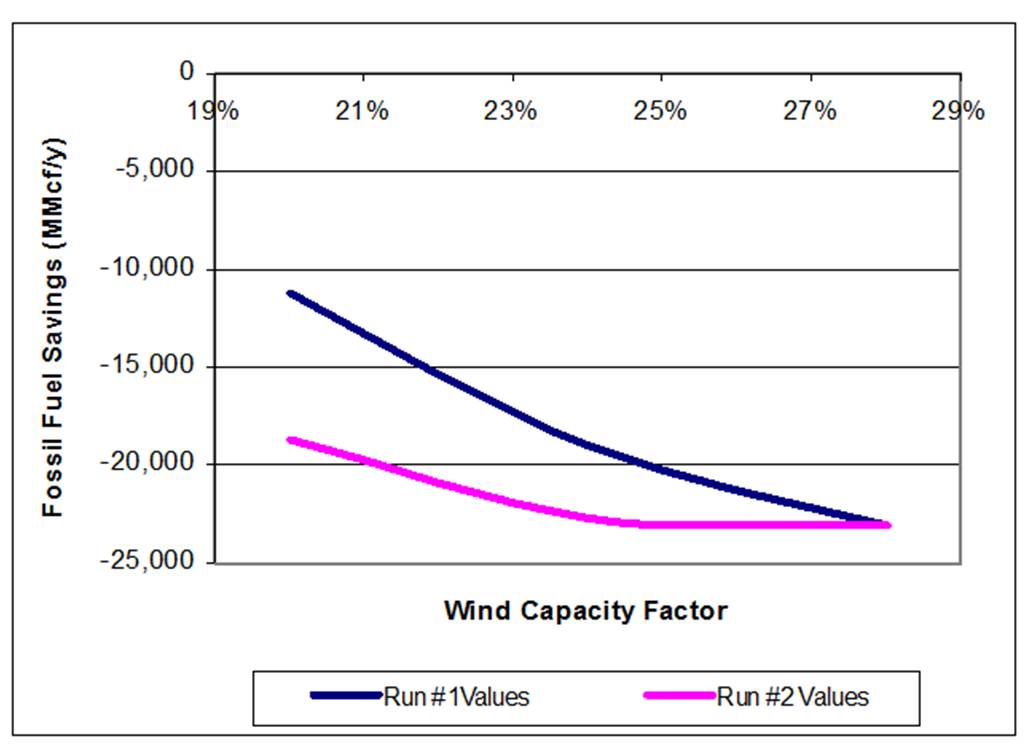
Figure 3 – CO2 Reductions Compared to “No Wind” Case
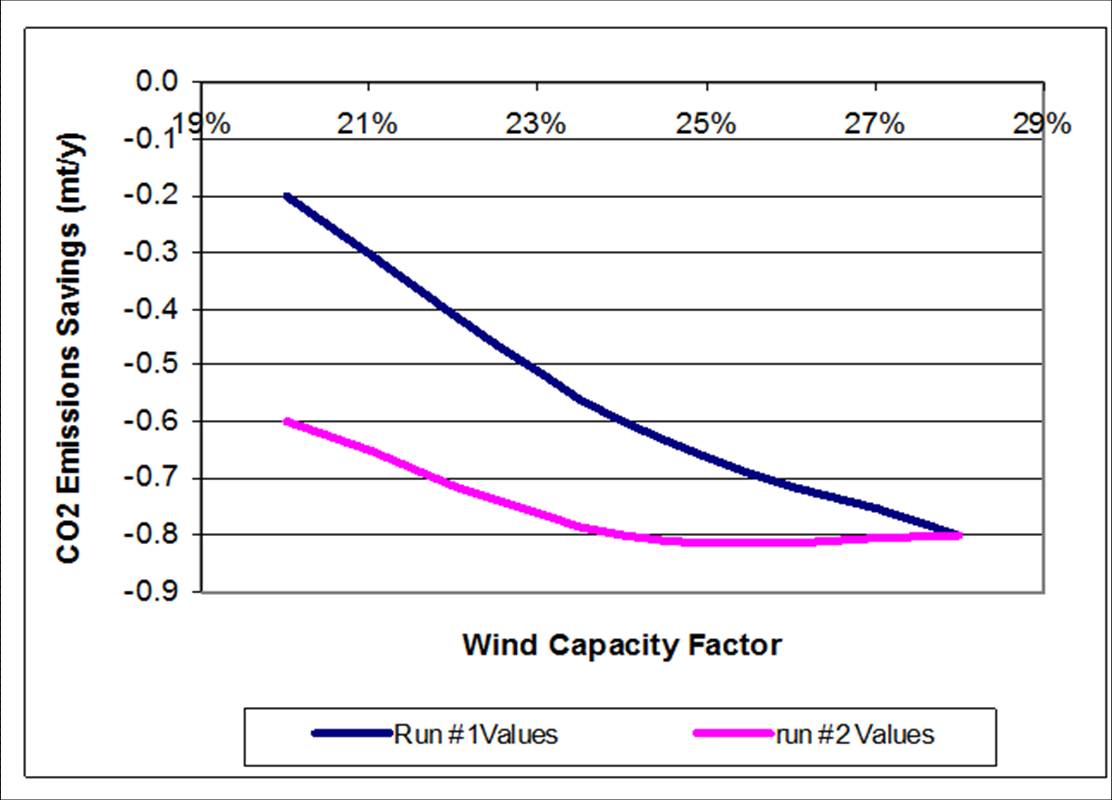
If it is assumed that the CCGT plants in the wind firming mix are somehow able to operate normally throughout the year, then the results show a fairly consistent level of savings of about -0.2 mt/y of CO2 emissions over the range of wind capacity factor shown.
Coal Plant Results
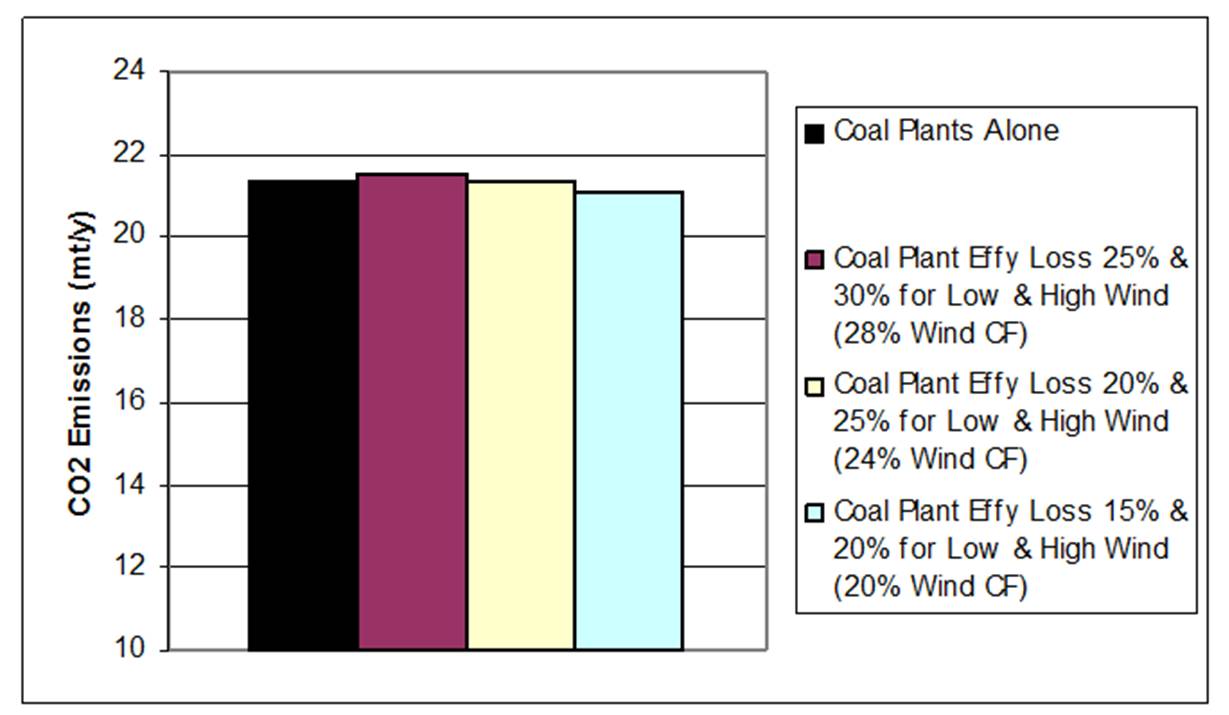
Figure 4 shows the CO2 emissions from coal plants under several circumstances:
- The first case is a coal plant capacity operating alone providing electricity at the capacity of prospective wind plants. In these circumstances the coal plants emit 21.3 million tonnes of CO2 per year (mt/y) assuming 0.76 tonnes/MWh (t/MWh) at an efficiency of 45%.
- The following scenarios show the CO2 emissions as a result of introducing wind plants of the same capacity. So wind and coal are sharing the associated electricity generation, with wind’s proportion set by the wind capacity factor. A capacity factor of 100% is used for coal because it is presumed to be a portion of the total coal plant capacity in the electricity system. Now this sub-set of coal plant(s) is operating in a wind firming role, assuming for this illustration that they are capable of doing so. A range of coal plant efficiency losses (heat rate penalties) is used as well as wind capacity factors (CF) is shown. Arguably heat rate penalties of even 40% might apply.
The calculator shows that any reductions in CO2 emissions at the point of wind plant generation are effectively offset by the reduced efficiency of the coal plants. Note the y-axis scale has already been shortened.
Figure 4 – CO2 Emissions for Coal Plants Alone versus Acting as Wind Shadowing/Backup
The following section extends this view of total CO2 emissions to include the effects of introducing gas turbine plants in the wind firming role.
Summary of a Range of Scenarios for Displacement of Coal Plant Production
Many jurisdictions have an electricity generation profile showing a large proportion of coal, some gas, perhaps some nuclear, and often little hydro. The conventional wisdom is that wind power can be used to replace/reduce the coal production. To put this into perspective the following scenarios are used.
- The base case shows the CO2 emissions from the coal plant production being displaced, as shown previously in Figure 4. The coal plant production is the equivalent to the proposed firmed wind plant production over a year.
- This shows the affect of adding wind using coal acting alone as the wind firming generation, also as shown previously in Figure 4. The question is: are coal plants are able to do this over the full range of wind volatility? Wind proponents claim that, with the introduction of wind, the coal plant CO2 emissions will be reduced by the amount of wind production. The calculator shows otherwise.
- OCGT plants are added to the mix to assist coal in the wind firming task. The coal/OCGT mix used is shown in Table 3.
- To eliminate the coal production a combination of CCGT and OCGT gas plants is used for wind firming.
- Finally, the result of replacing the coal production using CCGT plants alone is shown (no wind case).
In all cases the wind production is set by its capacity factor, and the wind firming production is the balance.
Table 3 shows the input parameters used to produce the results in Figure 5 for scenarios 2, 3 and 4. Scenarios 1 and 5 are the CO2 emissions for coal and gas plants respectively, operating normally and producing steady electricity.
Table 3 – Input Parameters for Figure 5
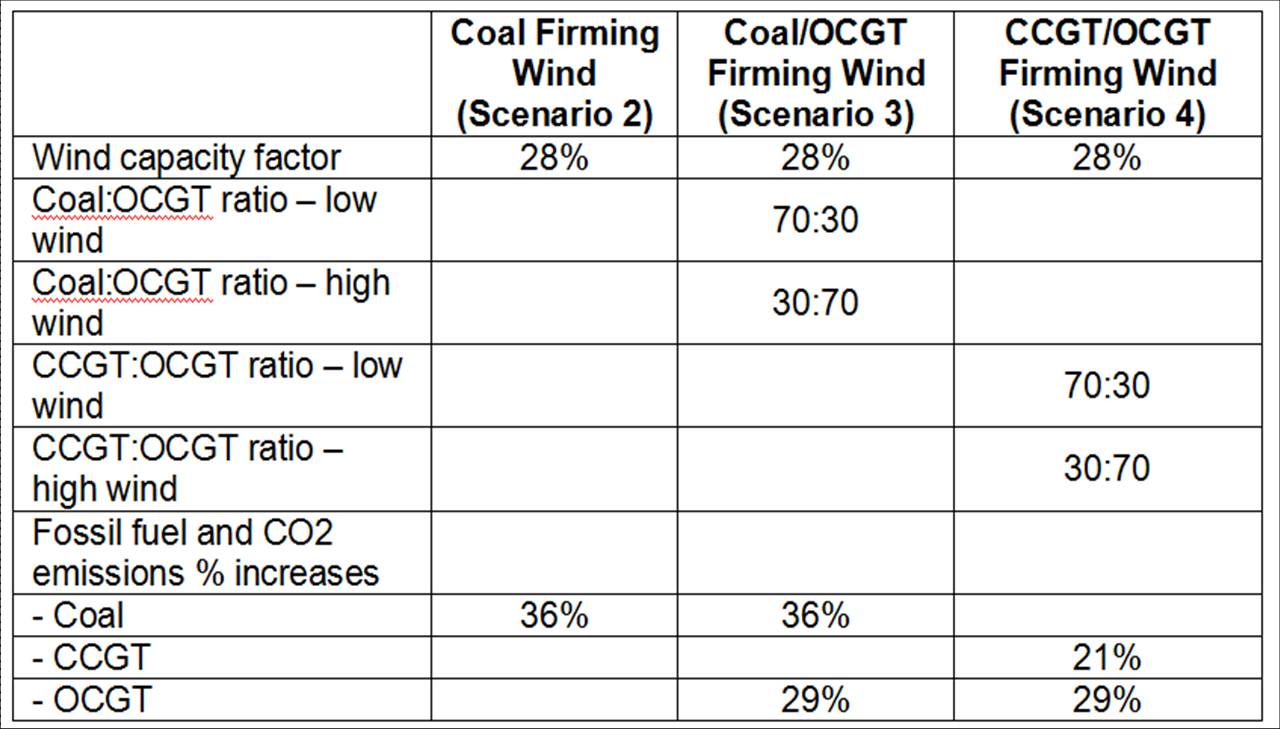
Figure 5 – Comparison of Coal Replacement Scenarios
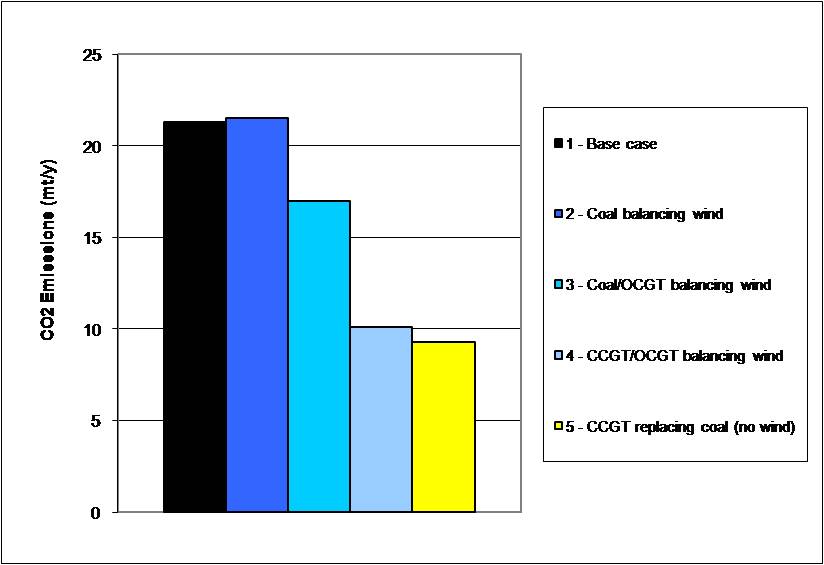
This illustrates the point that the important question with respect to the effect of the introduction of wind is not what electricity production means is being displaced, but what is acting in the wind firming role. This is shown by the result that the wind firming generation would be more effective without wind. In effect, wind is displacing the firming production, and the firming production is displacing coal.
There can be an exceptions to this, for example with the availability of sufficient impounded hydro supply to firm wind as discussed in Big Wind: How Many Households Served, What Emissions Reduction? (Part 2). However, most jurisdictions do not have this luxury.
Conclusions
It is not my intention here to advocate a specific generation means for any jurisdiction, but rather to illustrate the effects of wind penetration on fossil fuel consumption and CO2 emissions across a range of probable policy choices. What emerges from this analysis is that in electricity systems that must choose among fossil fuel-fired means of integrating wind volatility, no plausible scenario seems to exist where wind can play a positive role as the means to achieve fossil fuel or greenhouse gas emissions savings.
Appendix: Links to Previous Parts of this Series
- Part I presented a framework of the necessary considerations and an interim assessment of the effects on fossil fuel consumption and CO2 emissions until sufficiently comprehensive studies can be performed in the areas indicated.
- Part II reviewed the simplistic, incomplete approach that is usually claimed by wind proponents and policy makers. Introducing necessary considerations shows the dramatic, negative impacts presented in Part I.
- Part III critically reviewed an article by Milligan et al, introduced in a post on Knowledge Problem in response to Part I. The Milligan article is an example that claims negligible reductions from the theoretical maximum and contains questionable material.
- Part IV reviewed considerations involving reciprocating engine gas plants for wind firming and the paper by Campbell which addressed the effects of substitution away from baseload generation to peaking and mid-merit, and intermittent sources, as the result of increasing intermittent production.
For a copy of the calculator contact the author at kenthawkins@rogers.com.
As most grids (both here and abroad) need capacity and not energy, it does seem counterproductive to waste capital building wind farms rather than something that actually works. There are huge efficiency savings in building a current state of the art anything (coal, ng, etc.) to replace a vintage plant (or to repower that vintage plant.) Doing so over and over could actually provide a modern grid, not some 1800’s version of ludism. Such a move improves from ~31% efficiency to ~50% efficiency while still providing capacity and energy, yet with resulting fuel and emission savings. California regulators used (circa 1985) to demand production modelling, which when done showed the same results (albeit applied to DSM programs) as Mr. Hawkins. The difference there was to work bottom up replicating the behavior of each plant and T-line in the grid (along with end-use level demand profiles.) Mr. Hawkins calculator is an elegant simplification for working top down.
An interesting new preprint titled “Effect of Wind Intermittency on the Electric Grid: Mitigating the Risk of Energy Deficits” from http://arxiv.org/abs/1002.2243
Kent, I think I understand your and other critics arguments, but how about a real world look. What has been the emissions impact on ERCOT in Texas?
Does anyone have an idea on actual hours of operation changes and emissions? ERCOT has Coal, Nuke, NGCC, Cogen, etc.
Also, I was questioning the comment that you have to have MW for MW back up (SR?) for your wind load.
A few weeks back someone posted the link to ERCOT’s current load http://mospublic.ercot.com/ercot/jsp/frequency_control.jsp At the time the Spinning Reserve was about equal to the wind generation – both in the 5 to 6 GW range (on 40 GW load). However, in tracking (spot checks) I noticed this morning Spinning Reserve was at 5.3 GW and wind was at 0.7 GW – and this has not been uncommon. Now in the last hour SR has dropped some; but this has been the case frequently. BTW, here is the link to the wind forecasts. http://www.ercot.com/content/gridinfo/generation/awsforecast/Aggregate_latest.csv (50% & 80% Prob of exceeding)
The questions that Javelina Tex poses should rightly be asked of the limited liability wind companies doing business in Texas and around the world. Instead of hiding real-world wind performance behind gross statistical analyses that mask the way its frenetic behavior impacts other grid systems, why not demand chronological load dispatch modeling at, say, 15-minutes intervals, revealing the relevant thermal activity involved in wind “integration?”
Kent Hawkins clearly understands the need to verify the predictions of his “calculator” through comparison with reality. Note what he says:
“The methodological framework has not changed, and the need for confirmation from actual performance data using extensive real-time local dispatch analysis at finely grained time intervals capable of accurately and sufficiently assessing how wind affects all the variables within the electricity system remains.”
The stumbling block he and others have encountered to gaining access to such performance data is in the form of proprietary confidentiality claims, used particularly by the wind industry to avoid allowing the public to scrutinize the very information that would substantiate its case–or subvert it entirely, as Hawkins’ work seems to indicate it would.
Integrating wind volatility affects routine regulatory reserves, as well as the spinning reserves. And, at times, even non spinning reserves, since sizable wind penetration means that at times there will be wide and sudden swings of wind ebb and flow that even the spinning reserves can’t handle. All this also threatens grid reserve margins.
I don’t believe Hawkins or anyone else has said that wind requires a straight up one for one compensation from conventional generation. However, common sense should indicate that enabling a wind project’s rated capacity on the grid requires conventional compensation infilling the difference between wind’s rated capacity and its capacity factor–at all times. Over the course of a year, well over 70% of wind’s rated capacity must come conventional generators, working inefficiently to do so, as Hawkins shows. This inefficiency has financial and thermal cost implications, again as Hawkins predicts.
E.On Netz in Germany maintains that, once wind penetration reaches a critical level affecting marginal reserve supply, then additional conventional generation must be brought on board at from 880-90% of the rated capacity of wind on the system.
Kudos to Tom Tanton for revealing the work done in California so many years ago. Why isn’t such analysis a boilerplate requirement as a means of indexing wind’s bloated windfall from the public treasury to actual measured reductions in systemwide CO2 emissions? If it were, would wind wither away? Very likely.
And thanks to tmtisfree for the preprint information, which again seems to be raising the same issues as Hawkins by identifying the relevant variables that must be accounted for properly when examining the extent to which wind technology can offset greenhouse gas emissions. Indeed, reality might reveal that, in most cases, the addition of wind in the generation mix would only make the situation worse.
Finally, an EPA looking at the whole envelop of environmental impact/value.
Years ago I posted on many blogs that wind was not the answer for these same reasons, but got flamed.
Later I tried to convince people that TB Pickens only wants to make his resources of natural gas worth twice as much (and make billions), not save the world with wind farms, and again got flamed.
Drive through Nebraska, Oklahoma, Kansas, etc. you don’t even see mechanical windmills pumping water for a holding tanks any more. IT IS NOT RELIABLE. Wind sort of works for a hunting cabin that has large batteries and kerosene lanterns. But you still take along a gas generator these days, if you want hot water and most other comforts we require today. And Solar is almost as bad, but at least slightly more predictable.
20 years ago a co-worker put up a 500kw wind generator on a tower . The only reason it lasted 15 years was that he was a electrical maintenance technician and knew how to repair everything that broke. Otherwise, he would have spent twice what he paid for the tower, generator and controller, on maintenance of the system. Can you/your neighbor fix a windmill, generator, anti-reversing relay/controller? Do you/they have an electrical license? (needed in many states)What does it cost to get your furnace ready for winter? Well double this every year. Does anybody ever explain this to the people that spend $20,000-50,000 on a backyard wind generator/solar panel? Now that he is retired, he retired his windmill also.
JavelinaTex
You raise some typical but important questions. What follows are brief answers.
First with respect to emissions impact in Texas. Reported total emissions probably conceal more than they reveal. Some questions are: what are all the contributions by the various generation sources, including demand changes, rather than a total net number, and how are they determined – by actual measurement by fossil fuel consumption, or algorithm based on a “standard” emissions factor and electricity production? For example jurisdictions have shown emissions reductions during the economic slowdown as a result of reduced demand. As Jon Boone reiterates, detailed studies and data are lacking, or not made available, to reflect what is really happening in the “real world”.
Further to Jon Boone’s comments I would add that I believe you are referring to the calculator using the full wind capacity to calculate the firmed wind production. This is because wind can vary over the full range of its capacity and does so to realize the full production amount it is credited with over time, say a year. This is also consistent with the idea that wind has no capacity value in that it cannot be relied upon in real-time to produce electricity. Remember though, the calculator gives wind the full credit for its aggregate electricity production (MWh) over a year, and wind thus contributes 20-30% to the firmed wind production.
Turning to another measure of generation performance, capacity credit, this is the amount of wind capacity that can be relied upon statistically, say over a year. For wind penetration in energy terms over a few percent this is typically about 10% of rated wind capacity. For ERCOT it is 8.7%. In Germany it is less than 8%. Therefore, in capacity terms (or MW), for capacity planning purposes, 90%+ of conventional generation capacity, over and above peak demand plus reserves must be available to support wind. E.ON Netz in Germany states wind needs 90% backup, and this is repeated by other German sources. This is a statistical expectation, and although useful for planning purposes to provide a specified level of electricity system reliability, it is not an indication of what wind can provide in real time, the world we live in.
Again enter capacity value, and for wind this is 0%. Viewed this way, that is in real-time, wind capacity must be backed up 100% by conventional capacity, if it is being depended upon say at peak demand, or if acceptance of its production by the grid is mandated, for example, by such mechanisms as Renewable Portfolio Standards (RPS).
Spinning reserves are another consideration and your observations may not reflect what is actually happening. For example, “standard” spinning reserves (or other normal system reserves) should not be used to firm wind, because their designed purpose is to perform other grid stability/reliability functions. Inasmuch as they are being misdirected to wind firming, grid reliability is being jeopardized. This would be like not buying insurance for your house, which works fine until catastrophe strikes. Wind firming can be performed, for example, by other generation means being cycled to mirror wind, and by demand management and wind curtailment. There is no firmer wind than when wind is not producing or not allowed on the grid. Even Gross, a proponent of wind, makes a distinction between normal reserves and wind firming needs.
The document referred to by tmtisfree is recommended reading.
Kent,
A few issues I see…
First, it is established fact that wind has capacity factor equivalent to less than 10% of rated generation and will typically produce electricity in the range of 20 to 35% of rated capacity in the year. With some periods at a very high level and others very low to nil.
Also, there is no doubt that fossil fuel generators will have greater emisssions per unit of out put when operated at less than 100% rated load; hence the heat rate penalty and greater CO2 emissions per unit of output. Criteria emissions are likely highly proportional to fuel consumption and CO2 is most certainly proportional.
The above are indisputable facts and reciting those doesn’t support the hypothesis. What matters is how it all works together on the grid in actual operations.
Now the reason for my earlier question and a potential fallacy in the calculator. From what I can tell, you are using a wind capacity of 3,200 MW and then basing the heat rate penalty upon fossil fuel plants off that level. In reality, the 3,200 MW will be made up of many much smaller gas units; and these will likely be combined cycle. For example, You might have two 200 MW CTs with a 200 MW steam turbine using the waste heat for a total of 600 MW per set. You then will have six of these sets for a total of 3,600 MW, which may be spread among the grid. As it is actually dispatched, you will have 5 of these 600 MW sets operating at rated load and will have one CT running near rated load, and perhaps another 200 MW to take any variations. Now if you place wind into the mix and have 1200 MW of generation, you will back off two complete CC sets and will have the other four sets running rated load and your CTs following load. So over the period of time on the grid, you will have only a unit or two operating at a sub optimum load and this will occur anyway.
Now, Coal Plants are likley a bit tougher case, as you will have larger units (250 MW, 500 MW) and it will depend upon the turn down capability of each unit. My experience is that heaters (which is what your furnace is anyway) generally have little turn down capability. Savings come from complete shut down.
Now, where I think you have to show that wind causes greater emissions besides the relatively small inefficiencies imposed on the marginal gas or coal units will be from increasing the amount of spinning resevere on line and also the amount of generation that must be able to be brought on line with less advance notice than spinning reserve. That is why I asked the question of how ERCOT spinning reserve requirements compare to PJM or some other NERC area. In spot checking, I have seen ERCOT wind generation hit as high as 16 to 17% of system load and I have seen it as low as 1%… and sometimes on the same day (only being slightly facetious)… and this brings up the other area where there is risk of suboptimal operations that will negate emissions savings claimed for wind. Wind being high at night and tending to drop off during the afternoon will tend to make it increasingly difficult to operate CC plants in full CC mode if the wind demand gets too big as a percent of load and NGCC winds up being the marginal source of power much of the time.
In general on ERCOT, most every evaluation I have seen has shown loss in natural gas demand for EG due to wind (Tudor Pickering, Wood MacKenzie & Black & Veatch). Yes, it is hard to compare exactly as every day and year is different, but there is no doubt that the greater wind share is eating into Nat Gas demand for EG.
If it wind forced truly inefficient operation on NG units you would see negligible reductions in absolute fuel use.
Finally, the EPA web site does have emissions data for power plants down to the unit level. Whether these are exact measurements or calculated off of fuel use, I don’t think it really matters as if the imposed inefficiency is as great as hypothesized, the results will show up in the numbers with out regard to whether they are acutally measured or estimated off of fuel use.
Kent, in general I suspect you have a legitimate point, as I understand it, I think the mechanism for the inefficiency you propose exists only in an increase in spinning reserve vs. what would be requireed without wind; and 2) the risk that NGCC gets pushed into the marginal role in the Merit Order to the point where large quantities of capacity can only run on CT mode where without wind they would be mostly in CC mode.
I see alot of hypothesis on what large levels of wind penetration will do to a grid, but there is precious little investigation and discussion on what the impact is on ERCOT where these levels are currently being dealt with.
BTW, the 3/2/10 WSJ had an feature article on the impact of wind on natural gas generation.
Finally, there is the question of potential solutions or minimization strategies. One that I can think of is Compressed Air Energy Storage. While it is possible to argue with the “heat rates” claimed as they do not consider the electricty used to compress the air, perhaps they may be a method to balance system loads and once again Texas would be an ideal testing ground due to the availability of a huge number of salt domes in the vicinity of both gas pipelines, power plants and the grid.
JavalinaTex – IER just released a report that states a ratio of sold generation displaced by wind in ERCOT. I talked to a few people at IER about it, and they agree it does not imply fuel or emissions savings at the same ratio. The exact displacement ratio would be difficult to test “real world” unless someone sets up an isolated case, but the modeling can be refined. It’s just a matter of time and cost.
JavalinaTex Do you happen to know the efficiency rate of compressing air using an electric motor, and then making electricity from releasing it through a turbine? With that, capital and maintenance cost and hours per year and a ratio of time between compressing and releasing the gas, you could come pretty close to figuring the costs. of course the labor involved is no longer an expense when selling to the government – to them it’s a source of Keynesian revenue.
This response to JavalinaTex’s last comment has been delayed in part because I have been having direct communications with this person.
JavalinaTex, I believe you are using capacity credit values (10%) which is different than capacity factor. The 10% number (8.7% in ERCOT and less than 8% in Germany is a statistical expectation over time (say 1-3 years) of availability of capacity and is largely used for capacity planning purposes. It also is the foundation for the reality that wind needs almost duplicate capacity from balancing sources to ensure electricity system reliability.
Regarding your comment about a fallacy in the calculator, you are taking a simplistic application of it. As indicated in my Part V post you can add the type of nuance that you are suggesting by assuming for example that some portion of the gas turbine generators are operating a high efficiency. For example Peter Lang in Australia cut the increases in CO2 emissions in half on the basis that some wind mirroring could still operate efficiently. We had quite a discussion on this, including another consideration – grid topology. It is not necessarily true that an aggregate of 3,200 MW can act in concert to balance widely distributed wind plants. Further as you indicated providing gas to widely distributed gas plants has its own particular set of problems, which become greater as more wind capacity is added
With respect to published emissions data, I am looking forward to the release of a study performed for the Colorado electricity system on this basis, which appears to be consistent with the calculator and is referred to here. Note the correction on the Denver Business Journal site which says that the study focused on coal-fired plants.
I agree that impact on spinning reserves is inevitable, but there is more to reserves than reflected in spinning reserves. I also suggest that that there is some “furious paddling below the surface” that is typically treated as an “externality” (in other words ignored) in most analyses, which is misleading. In other words the issue is greater than the normal way of looking at reserves, which is multi-layered, and this is where confusion lies. This is a long discussion. Even Gross et al, whose paper is often cited to show the low impact of high wind penetration, concedes that these are really separate issues, and should be treated as such.
Finally, remember that I do call for comprehensive studies based on real life experience at high wind penetrations, using fine-grained time intervals. I expect the calculator results will be validated by these.
Kent,
Your series of submissions, and the comment on them, at this very interesting blog site is a new discovery for me – via a comment on Scientific American. Therefore, I have not examined the fine detail of your calculations.
What concerns me is that readers, including the SciAm commentator, will throw out the baby with the bath water. It would seem worthwhile to consider other approaches to addressing the intermittent nature of wind power generation.
Recognizing the problem of wind variability, it has seemed natural to pair the establishment of a substantial with a substantial power storage facility. Most simple of these would be a pair of reservoirs with a significant difference in altitude. When the wind farm produced energy in excess of demand, water would be pumped from the lower reservoir to the upper one. When stored power is needed water turbines would generate power as water flowed from the upper reservoir to the lower one. Are you aware of any cost analysis done along the lines of this simple model?
Kenneth
Pumped hydro storage is currently used in a number of jurisdictions, including Germany, the State of New York and Ontario, Canada. It has limited application because of the need for large reservoirs. Uses include meeting peaking power requirements. Considerations include:
• Appropriate land formations, especially near demand or wind plant centers otherwise additional transmission lines may have to be built.
• Total capacity, storage and discharge rates available.
• Local permitting for the building of the large reservoirs needed as well as any new transmission lines required. Environmentalists will have a lot to say on this.
In summary, there is limited potential for providing the necessary capability to overcome wind’s chronic intermittance at the scales projected for wind implementations.
I have not looked at financial feasibility, but I do not imagine the costs would merit the benefits for very large wind implementations and the capacities of reservoirs required compared to other generation means.
For other aspects of feasibility David MacKay has performed an analysis for the UK in his book “Sustainable Energy – without the hot” air on pages 190-194. In summary he concludes it is limited. The book can be downloaded at no cost at http://www.withouthotair.com/download.html .
There are better solutions to our electrical energy needs than that offered by highly intermittent new renewables, especially utility-scale wind power, and any associated schemes to address their generally undesirable characteristics. I cover these at http://www.masterresource.org/2010/03/integrating-renewables-have-policy-makers-faced-the-realities/ .
Kenneth Gibson,
Pumped hydro is costly and does not match well with intermittent power supplies (solar and wind power). You might be interested int this article and the discussion below which I believe would answer your questions.
http://bravenewclimate.com/2010/04/05/pumped-hydro-system-cost/
Peter,
Thank you for this additional and very informative information.
Kent,
I should have mentioned that variable speed pump turbines are beginning to be used commercially, and the Japanese are the leaders. However, this does not change the situation by much – wind power is still ludicrously expensive for a low value power supply – a power supply no electrcity distributor would buy if not forced to do so.
This links below list some pumped hydro schemes that are being built or recently completed around the world, including some with variable speed pump turbines.
http://www.hydroworld.com/index/display/article-display/357777/articles/hydro-review-worldwide/volume-16/issue-6/articles/cover-story/snapshots-of-pumped-storage-projects.html
http://www.powermag.com/issues/cover_stories/Kannagawa-Hydropower-Plant-Japan_461.html
http://en.allexperts.com/e/p/pu/pumped-storage_hydroelectricity.htm
This http://www.rowa-ag.ch/images/PDFs/ref_JinPinStudie_d.pdf
gives an idea what an underground power station might look like for the Tantangara-Blowering or Tantangara-Talbingo pump storage scheme I linked to in the previous post. For these two projects we’d probably need 12 instead of 8 pump-turbines, pressure tunnels and tailrace tunnels. I would not want to waste this site on energy storage for wind power. The great value of pumped hydro sites would be for energy storage for nuclear power. That way we could have near zero emissions electricity from 25GW of nuclear power and capability to provide up to 33GW of peak load every day. However, if this site was designed for storing wind energy, the 8GW of pumped hydro power and say 50GW h of storage would last only 6 hours of no wind. That’s not much help when we have 5 days or more of little wind power.
Our few viable pumped hydro sites are far to valuable to waste on trying to make intermittent energy sources into a stable electricity supply.
[…] units normally used only at peak demand, would save no carbon dioxide emissions. And as Canadian Kent Hawkins shows, modeling a combination of coal and natural gas for wind balancing results in more carbon […]
[…] ways over time. The Bentek study is supported by the work of engineers like Kent Hawkins in Canada (here and here), Peter Lang in Australia (here and here), Bryan Leyland in New Zealand, Jim Oswald in […]
I have a question regarding gas generation in wind firming.
To answer the question you will need a good understanding of how the Kent Hawkins Calculator works. You can get it by asking him to send it to you. His email address is: kenthawkins@rogers.com
The web site is: http://www.masterresource.org/2010/02/wind-integration-incremental-emissions-from-back-up-generation-cycling-part-v-calculator-update/
And a summary paper showing the comparison of the calculator outputs with the results of recent studies is here: http://www.masterresource.org/2010/06/subsidizing-co2-emissions/#more-10349
My questions are:
1. How can the CCGT and OCGT gas generators be dispatched so they come on line to firm wind power when the wind power is fluctuating wildly?
2. How much duplication of gas generation capacity would this cause?
I understand there is a limit to how often a gas turbine can be started and stopped per day (I understand the maximum is 3 times per day).
Let’s assume we have a low wind season (say 6 months) and a high wind season also of six months.
In each season, the wind power can fluctuate between zero and full power.
I suspect the Ken Hawkins calculator is overestimating the emissions produced by gas turbines when wind firming because I suspect the amount of OCGT has been overestimated and the amount of CCGT has been underestimated, especially in the low wind period. I imagine that CCGT should provide most of the power during the low wind period. But that means say 80% of the installed capacity must be CCGT.
During the high wind period we’d need more OCGT. The total gas generating capacity required would total more than 100% of the wind capacity.
If the wind power is fluctuating wildly how are the OCGT’s dispatched during falling wind power? Once all the OCGT’s are on-line, there are no more left to bring on-line as the wind drops further. I am having trouble understanding why we wouldn’t need almost 100% OCGT and say 80% CCGT to allow us to firm wind power.
Can someone please explain, in a system that is only wind and gas (exaggeration to make the explanation simple), how would the dispatching of the OCGT and CCGT’s be managed?
I should have been clearer with my statement about “wind fluctuating wildly”. I am talking about the large swings in power output that can occur over hours as experienced by all 1900MW of wind power connected to the Australian National Electricity Market grid. The wind farms span a region 1200 km east-west by 800km north-south, although most of the capacity is in South Australia. You can see the charts of the wind farm output here:
http://windfarmperformance.info/
Choose the month you want to see from the bottom left.
This chart shows the total output of all windfarms in the NEM for September for example:
http://windfarmperformance.info/documents/analysis/monthly/aemo_wind_201009_hhour.pdf
You can make your own charts from here:
http://www.landscapeguardians.org.au/data/aemo/
In August (our high wind period), total NEM wind power output fluctuates between 0% and 85% CF in seven major cycles, The fluctuations are between 20% and 70% of full power (1900MW) in a few hours.
However, in May, there was a period of about a week with minimal wind output.
If we had enough CCGT’s I expect we’d use them during the period of no wind. But we need OCGT’s to ramp fast. So it seems to me (exaggerating) we need nearly 100% CCGT to give us the least emissions in the low wind period but we need nearly 100% OCGT to be able to firm the rapidly changing wind output when the wind power is dropping fast. That means we need nearly twice as much gas capacity as wind capacity if we want to minimise emissions from backing up for wind. I am exaggerating to make it easier to explain my question. I recognise that in reality there are many other generators in the mix and dispatching is complicated. However, it makes it easier to understand the questions and the explanation if we can simplify it to considering a simple system with just wind and gas generators.
I want to clarify the reason for my question. For a long time I’ve had two concerns about the emissions from firming wind power. I believe (but I may have this wrong) that the calculator may not be allowing for these properly. Or if it is doing the calculations properly, then it is not making these effects transparent. They are:
1. I suspect more OCGT + CCGT capacity is required than wind capacity. So if we have 1GW of wind capacity, we may need nearly 1 GW of OCGT alone. But if we want a mix of CCGT and OCGT to reduce emissions and fuel costs, then I suspect we may need more than 1GW of CCGT + OCGT. But how much more? That is what my questions is getting at. (if I am correct it increases the capital investment in gas generators required to back up for wind, so it further increases the cost of electricity).
2. I suspect more CCGT and OCGT must be kept running in spinning reserve in a mixed system of CCGT + OCGT than is commonly recognised. So this means more fuel is burnt, more emissions and higher cost electricity. That is why I am asking about how the OCGT and CCGT are dispatched when the wind power is dropping, rising and fluctuating. Wind forecasting is not good and the operators cannot rely on it. They have to keep more plants running than they would if there was no wind capacity in the grid.
I am wondering if the calculator is taking these effects into account. If so, how can I see these effects? How can they be made visible. Or how can it be an explicit input so the users of the calculator have to actually consider how much extra capacity is needed and how much extra plant must be kept in spinning reserve or partly loaded (i.e. at lower efficiency and higher emissions per MWh).
By the way, I realise the Bentek and Netherlands studies are actual measurements of power output and fuel used, so suspect these studies do take the effects I am concerned about into account. If so, it would be good if the calculator could quantify and make visible the magnitude of these effects. (My gut feeling is that effect 2 amounts to around 10% to 20% more emissions than if the gas generators could exactly firm for the wind power (i.e. with no more spinning reserve or part loading than is needed to follow the changes in the demand (load).)
[…] electrical engineer Kent Hawkins wrote in February 2010 that “the introduction of wind power into an electricity system increases the […]
[…] The results from my calculator for these jurisdictions […]
[…] electrical engineer Kent Hawkins wrote in February 2010 that “the introduction of wind power into an electricity system increases the […]
[…] the fray. … The Bentek study is supported by the work of engineers like Kent Hawkins in Canada (here and here), Peter Lang in Australia (here and here), Bryan Leyland in New Zealand, Jim Oswald in […]
[…] the fray. … The Bentek study is supported by the work of engineers like Kent Hawkins in Canada (here and here), Peter Lang in Australia (here and here), Bryan Leyland in New Zealand, Jim Oswald in […]
There’s definately a lot to find out about this issue.
I love all of the points you made.
[…] electrical engineer Kent Hawkins wrote in February 2010 that “the introduction of wind power into an electricity system increases the […]
[…] electrical engineer Kent Hawkins wrote in February 2010 that “the introduction of wind power into an electricity system increases the […]
[…] and reports about the Wind+Gas package: one, two, three, four, five, six, seven, eight, nine, ten and […]
[…] and reports about the Wind+Gas package: one, two, three, four, five, six, seven, eight, nine, ten and […]
[…] electrical engineer Kent Hawkins wrote in February 2010 that “the introduction of wind power into an electricity system increases the […]
[…] electrical engineer Kent Hawkins wrote in February 2010 that “the introduction of wind power into an electricity system increases the […]