Wind Integration: Incremental Emissions from Back-Up Generation Cycling (Part I: A Framework and Calculator)
By Kent Hawkins -- November 13, 2009Editor note: Mr. Hawkins’ study is presented to increase the interest in this highly important, politically sensitive issue of incremental pollution from firming up industrial wind power. This post has been joined by Parts II-V, with Part V providing updates to the calculator and links to the other posts.
Integrating random, highly variable wind energy into an electricity system presents substantial problems that subvert wind technology’s ability to offset the use of fossil fuels–and avoid air emissions, including carbon dioxide (CO2). Measuring this accurately is important because many believe that wind projects significantly reduce such emissions.
This analysis finds that natural gas used as wind back-up in place of baseload or intermediate gas (in the absence of wind) results in approximately the same gas burn and an increase in related emissions, including CO2. Extrapolating from this example to the whole, the working hypothesis is that intermittent wind (and solar) are not effective CO2 mitigation strategies because of inefficiencies introduced by fast-ramping (inefficient) operation of gas turbines for firming otherwise intermittent and thus non-usable power.
Analysis
In the absence of extensive real-time load dispatch analyses at finely grained time intervals capable of accurately and sufficiently assessing all the variables affecting electricity system behavior as wind energy penetration increases, I propose a method – a calculator – that captures a wide range of considerations. I am unaware of any previous attempt that is as inclusive as what I present here and welcome reader comments for improvements on the present framework or alternative approaches.
This model, or calculator, provides a framework for the considerations involved and an interim assessment of their effects until sufficiently comprehensive studies can be performed in the areas indicated. It shows the impact on fossil fuel consumption and CO2 emissions compared to typical claims by wind proponents and other bodies, including some government policy makers. As it is parameter driven, the calculator allows examination of the sensitivity of these considerations. The result is that the typical claims are not supported, except by ignoring most of the following considerations:
- The amount of wind mirroring/shadowing backup required.
- Inefficient operation imposed on the mirroring/shadowing backup, in terms of both the fossil fuel consumption and CO2 emissions, treated separately.
- The need to make comparisons, with respect to gas plants, of:
- Case A – The more efficient Combined Cycle plants (CCGT) operating alone, in other words without the presence of wind, versus;
- Case B – The appropriate mix of gas plant type used to balance wind’s volatile output. This includes the need to introduce less efficient, but faster-reacting, Open Cycle Gas Turbine gas plants (OCGT) to mirror/shadow the wind production, especially as wind penetration increases.
- The effect of reduced wind capacity factor.
- The effect of wind output exceeding 1-2 percentage points of a total electricity system, on a country or regional basis.
The framework used is similar to that of Warren Katzenstein and Jay Apt (see citations below). It focuses on the wind/gas plant combination and has general applicability. Additional considerations involving wind’s impact on other electricity system elements particular to a specific jurisdiction, such as baseload capacity as analyzed by Campbell, will have to be assessed separately and could have implications that further offset wind’s claimed benefits.
Table 1 provides basic information on the wind and gas plants for the results contained in Figures 1 and 2.
Table 1 – Wind and Gas Plant Information
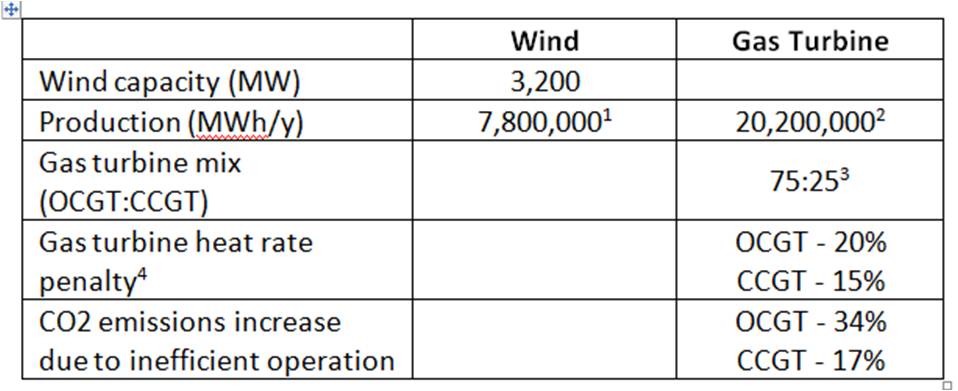
Notes to Table 1
- 1. Wind capacity factor used is 28%.
- 2. Gas production is the balance need to equal wind at 100%.
- 3. This applies for one-half the year “high wind production period”.
- 4. Basis for gas consumption.
Figure 1 below displays the calculator results for fossil fuel savings. The “Typical Claim Scenario”, which ignores the heat rate penalties, shows over 50,000 MMcf/yr savings assuming CCGT plants only. In this case, introducing OCGT, again without heat rate penalties, reduces the savings to about 30,000 MMcf/yr. Introducing heat rate penalties and using CCGT only produces savings of about 30,000 MMcf/yr as well, but the inclusion of OCGT plants reduces gas savings to almost zero.
Figure 1 – Fossil Fuel Savings
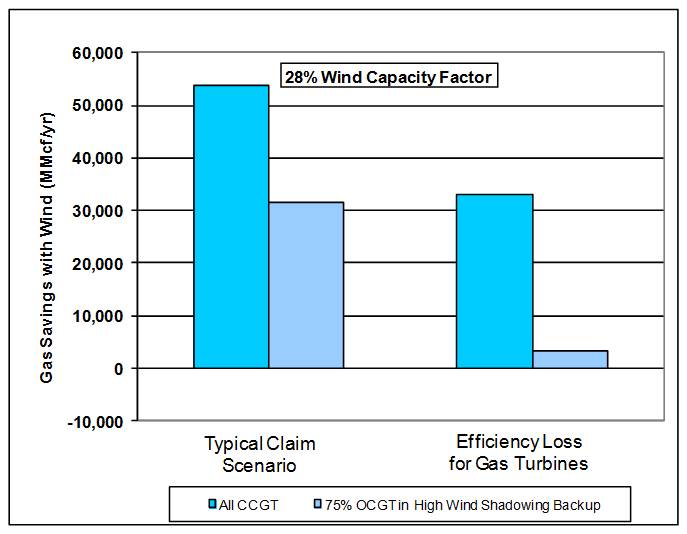
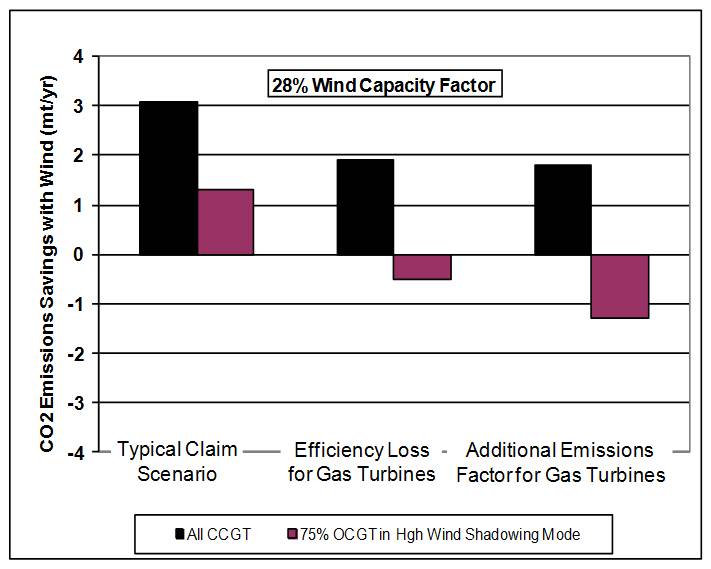
Figure 2 displays the results for CO2 emissions savings. The “Typical Claim Scenario” shows annual savings of about 3 million tons of CO2 ignoring any OCGT considerations and any effect of heat rate penalties or the related CO2 emissions increase factor. Introducing OCGT within this scenario cuts the savings by more than one-half. Using the inefficiency factors and only CCGT shows that the CO2 savings are reduced by about one-third, but introducing OCGT drives the CO2 savings into the negative category.
Figure 2 – CO2 Emissions Savings
Conclusion
Notwithstanding the nature of the calculator, robust inferences can be drawn from its results because the analysis captures a fuller range of considerations. The general conclusion is clear: industrial wind power does not produce the claimed benefits of reductions in fossil fuel consumption and CO2 emissions when up-and-down backup generation inefficiencies are taken into account.
Technical Appendix: Sensitivity Analyses
To answer questions about the effect of varying some of the input parameters used, further analyses have been developed. In particular, the effects of varying the OCGT:CCGT mix in high wind production periods and the heat rate penalties and related CO2 emissions increase factors are analyzed. Also, as the calculator divides the wind year into high and low wind production periods, the effect of varying the skewing of wind production between these two periods is also presented.
Varying CCGT/OCGT Mix
The first shows the effect of varying the OCGT:CCGT mix for the wind high production period. The 25:75 ratio for OCGT:CCGT gas plants for low wind production periods is held constant for all cases shown. All other parameters are held constant. Figure 1 shows the results for gas savings and a range of capacity factors. Negative values represent increased gas consumption.
Figure 1 – Gas Savings for a Range of CCGT/OCGT Mix and Capacity Factors
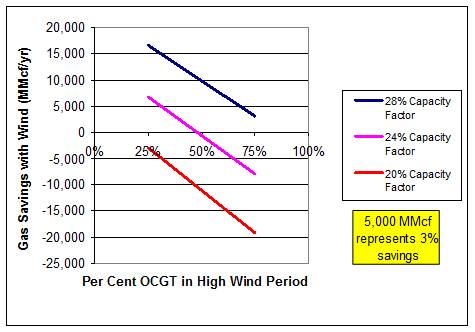
Reducing the OCGT component to 25 per cent at a 28 per cent wind capacity factor still produces only about 25 per cent of the simplistic, Typical Claim scenario reductions.
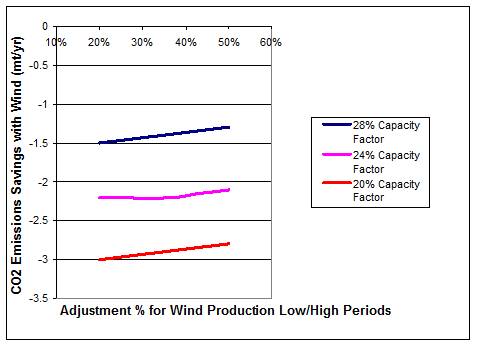
Figure 2 shows the results for CO2 emissions savings. Again negative values represent increased emissions over CCGT plants operating alone. Reducing the OCGT component to 25 per cent at a 28 per cent wind capacity factor yields effectively zero CO2 emissions savings.
Figure 2 – CO2 Emissions Savings for a Range of CCGT/OCGT Mix and Capacity Factors
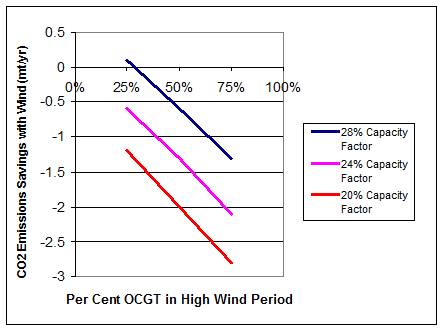
The lower ranges for OCGT plants in the mix are likely not feasible.
Varying the Heat Rate Penalty of the Gas Plants
Some may argue that the heat rate penalties in the examples shown above are either too high or too low. Figure 3 and Figure 4 show the effects for the values used, plus or minus 5 percentage points for CCGT plants. This produces a range from 10 to 20 per cent for CCGT plants and 14 to 27 per cent for OCGT, with corresponding CO2 emissions increase factors. Other parameters are held constant at the values used for the 15 per cent (CCGT) and 20 per cent (OCGT) heat rate penalties calculator runs. The “x” axis is in CCGT terms.
Figure 3 – Effect of Heat Rate Penalties on Gas Savings
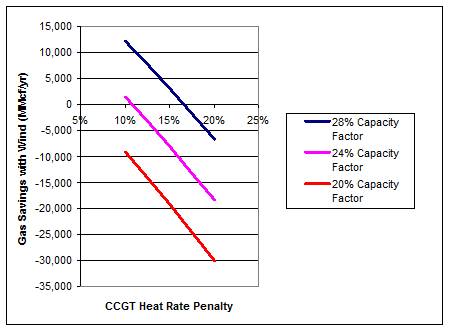
Figure 4 – Effect of Heat Rate Penalties on CO2 Emissions Savings
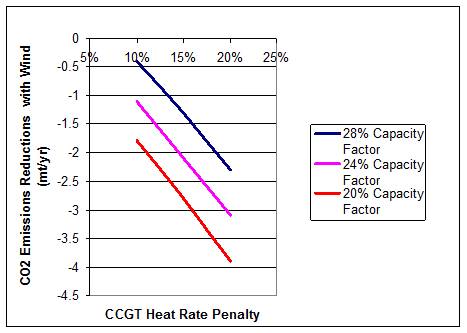
Values below 10 per cent for CCGT plants will increasingly support wind proponent estimates. Values above 20 per cent may be viewed by others as more applicable.
Varying the Skewing of Wind Production between Low and High Wind Periods
The calculator assumes that a year can be divided into high and low wind production periods, and allows for the variation of this by input parameter. A ratio of 50:50 was used. Further, the amount of the skewing of wind production between the two periods can be altered. For the calculator runs shown, the skewing is assumed to be the annual average plus and minus 50 percent. This sensitivity analysis shows the effect of varying the amount of the skewing from 20 to 50 per cent. Figure 5 is the result for gas savings by varying this percentage from 20-50 per cent.
Figure 5 – Gas Savings for a Range of Skewing Wind Percentage and Capacity Factors
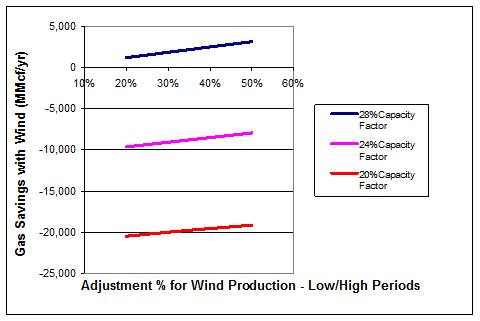
Figure 6 shows the effect on CO2 emissions savings.
Figure 6 – CO2 Emissions Savings for a Range of CCGT/OCGT Mix and Capacity Factors
In general, the effect of reducing the range of variation between the low and high wind production periods is to reduce savings. This is caused by a decrease in wind production in high wind periods, resulting in increased gas plant production, especially OCGT. So the use of 50 per cent is more beneficial to wind.
The effect of these sensitivity analyses is to support the above conclusions.
[For anyone coming across this as their first reference to my calculator, you should be aware that updates have been provided, first at http://www.masterresource.org/2010/02/wind-integration-incremental-emissions-from-back-up-generation-cycling-part-v-calculator-update/, and subsequently at http://www.masterresource.org/2010/11/the-calculator-14-results-part-i/ .]
Bibliography
Apt, J., Testimony of Dr. Jay Apt, US House of Representatives Committee on Energy and Commerce Subcommittee on Energy and Environment, April 2009, http://energycommerce.house.gov/Press_111/20090423/testimony apt.pdf
Boone, Jon, Less for More: the Rube Goldberg Nature of Industrial Wind Development, http://www.windaction.org/documents/7013
Campbell, A., Hot Air? When Government Support for Intermittent Renewable Technologies can Increase Emissions, 2008, http://wind-watch.org/documents/site/uploads/campbell-hot-air.pdf
E.ON Netz, Wind Report 2004. This no longer seems to be available online.
E.ON Netz, Wind Report 2005, http://www.transpower.de/pages/tso_de/EEG__KWK-G/Erneuerbare-_Energien-Gesetz/EEG-Anlagen/Daten_und_Fakten_zur_Windkraft/EON_NetzWindreport2005_ger.pdf
Katzenstein W. and Apt J, Incorporating Wind into a Natural-gas Turbine Baseload Power System Increases NOx and Co2 Emissions from the Gas Turbines, 2008, Carnegie Mellon University, http://www.ece.cmu.edu/~electriconf/2008/PDFs/6-2%20Katzenstein%20and%20Apt.pdf.
Katzenstein, W., and Apt, J., Air Emissions Due to Wind and Solar Power, 2009, Environmental Science and Technology, VOL. 43, NO. 2, 2009, page 253, http://pubs.acs.org/doi/abs/10.1021/es801437t.
Lang, Peter, Cost and Quantity of Greenhouse Gas Emissions Avoided by Wind Energy, http://carbon-sense.com/site/uploads/2009/02/wind-power.pdf
Liik, O. et al, Estimation of real emissions reductions caused by wind generators, International Energy Workshop, 2003, http://www.etsap.org/worksh_6_2003/2003P_liik.pdf
Oswald, James et al, Will British weather provide reliable electricity?, 2008, http://www.wind-watch.org/documents/site/uploads/oswald-energy-policy-2008.pdf
Union for the Co-ordination of Transmission of Electricity (UCTE), Integrating Wind Power in the European Power Systems – prerequisites for successful and organic growth, 2004, http://www.entsoe.eu/_library/publications/ce/otherreports/UCTE-position-on-wind-power.pdf
White, David, Reduction in Carbon Dioxide Emissions: Estimating the Potential Contribution from Wind Power, Renewable Energy Foundation, 2004. http://www.ref.org.uk/Files/david.white.wind.co2.saving.12.04.pdf
—————–
Kent Hawkins, a retired electrical engineer living in Ontario, has spent the last eight years researching the integration of industrial-scale wind plants into electricity systems. He can be reached at kenthawkins@rogers.com.
Kent Hawkins’ analysis here has potentially seismic implications for the future political success of intermittent volatile sources of energy. He builds on the work of Lang and, earlier, David White, by forcing an examination of the many interrelated variables involved in energy conversion transactions–which the First and Second Laws of Thermodynamics insist upon for any responsible analysis.
By cherry picking only those variables that support its claims (and pocketbook), and masking important variable but negative transactions behind weekly, even annual, load dispatch “averages,” the wind industry, including profiteers from the National Renewable Energy Lab, have convinced politicians that industrial wind technology can be deployed as a principal agent for reducing CO2 emissions in the generation of electricity. As a consequence, these politicians have passed laws enabling limited liability wind companies to raid the federal treasury as an “incentive” to promote this antediluvian enterprise.
Hawkins’ work demonstrates that such incentives are a waste of enterprise. For industrial wind cannot be a system that can reduce meaningful levels of CO2 emissions. Nor can it displace significant amounts of fossil-fired generation. His focus on natural gas generation, and its limitations for wind balancing, makes the best case for the wind industry. Subsequent analyses that examine how coal-fired units react with wind volatility, particularly on grids with high coal generation, such as the PJM, are likely to show even greater CO2 production than that produced by only natural gas systems. Although his calculator will no doubt be improved by testing it against reality, it should prove to be a useful tool for measuring actual results, since it factors so much relevant information and captures many of the dynamics.
What is particularly salient about Hawkins’ ideas is the notion that, even in the best case scenario, wind/natural gas combos are only marginally better at reducing CO2 emissions than would be the case with natural gas units alone, without any wind. And that, in some locales and circumstances, even the best pairings of wind and fossil-fired generators would produce more CO2 than would be the case with no wind.
Reality does bite. Three cheers for Kent Hawkins’ sharp teeth.
I have been following the wind-CO2 question for months and this is the best analysis I’ve seen.
So if wind doesn’t reduce CO2 emissions, remind me why we are investing so much money in wind turbines?
Why, Robert, it’s because of the perfect PR storm–a “gusher of lies” colliding with a torrent of wishful thinking, with wind, which provides no meaning product or service, delivering the stuff dreams are made of….
From a capital cost perspective, wouldn’t it be more efficient if the gas was piped directly to the wind turbine? In other words, the turbine is designed to run on gas and/or wind. This should allow the wind turbine to run at lower wind speeds (i.e., a greater operating envelope) if augmented with natural gas. This would be like operating a gas-based power plant using 30-50% less gas. On the other hand, these hybrid gas/wind turbines would operate like an OCGT plant in terms of energy efficiency.
Chris, the “turbines” in wind and OCGT are completely different animals. Such a “hybrid” would actually be one of each animal, and your capital costs would reflect that–i.e. you’d have to buy two machines; one heat engine (GT) and one mechanical (the wind turbine.) No potential capital savings.
The analysis is clear. The simple question that should be put to the the public in the US, or here in Britain where we are gripped by windfarm fraud is “would you but a car, even a hybrid, that only works 25% of the time and not at all for long periods?”
As to Chris’s suggestion, in addition to Tom’s comment, you have to add the cost of piping gas to a remote location, further money wasted for a non-existent problem.
Cheers
Paul
Please study the paper by Peter Lang, in the references above, and in turn the references upon which he draws.
Note that Peter is an Australian elecrtricity manager/engineer and Australia has no nuclear power generation, so his figures are country-specific. However, the general conclusions are similar to those of Kent Hawkins.
Maybe a hybrid could be made by jetting pressurised natural gas at the blades of the windmill when the wind speed drops. Now if someone could design an afterburner……
Question. How does the analysis presented here relate to the paper below? I quickly scanned the paper below and if I understand it correctly it claims that additional CO2 emissions due to the efficiency loss is outweighed by the reduction in CO2 emissions by adding wind by a factor of 1000 (!?). Which seems to contradict this analysis. But I could have easily missed something.
http://www.awea.org/pubs/factsheets/Backup_Power.pdf
Here is something else: this appears to be a full literature assessment related to wind power and intermittency:
http://www.windaction.org/?module=uploads&func=download&fileId=1742
[…] pair of posts at Master Resource (part I, part II) explore the degree to which variable wind power leads to lower efficiency and increased […]
Kent Hawkins paper, presented here in two parts, fully acknowledges the contributions of Peter Lang and reports from Britain’s Renewable Energy Foundation, led by Jim Oswalt. All were distilled from David White’s seminal work in 2004, which Hawkins cited.
What Hawkins has done beyond these works, however, is to provide a method for capturing and calculating all the salient thermal variables involved with wind integration, including ramping and heat penalty rates for those thermal generators that wind might sporadically displace as it bounces around on a grid and those that must follow and balance the relentless wind volatility. His “calculator” also includes such information as fossil fuel savings and wind conditions, at least at gross levels of consideration–which then can be fine-grained as they become informed by reality.
As things now stand, claims for wind-induced offsets of CO2 have the same level of verisimilitude as the infamous BCS college football polls. Most are merely gross statistical projections promulgated by those with a stake in the outcome, such as pundits hired by the limited liability wind companies themselves, their trade association, and the engineers at the National Renewable Energy Lab.
Hawkins is doing the important work of real science by attempting to explain the interaction of all the important variables, not just those cherry picked to obtain a desired result. By forcing an examination of the many interrelated but often hidden variables (typically masked by gross statistical projections) involved in energy conversion transactions, Hawkins shows the statistical deceptions that heretofore have allowed people to “Believe in the Wind.”
Cool argument. I’m not totally sure I understand, though, how the model is supposing that these wind turbines are being integrated. Is the idea that a plant is replacing a part of its baseload generation portfolio with wind resources and using a mix of CCGTs and OCGTs to fill in gaps in wind generation? If so, then a few questions arise:
a) How sensitive is this analysis to the possibility that wind turbines could be used for peaking or mid-merit generation rather than as baseload resources?
b) What would happen to the numbers if a utility-scale battery were used to smooth variability so that CCGT’s could have more time to ramp up and down?
c) What if the wind turbines were still used as a baseload resource, but the grid operator only relied on them for some fraction of their capacity, so that when they produced at capacity some of that energy was stranded but when they didn’t produce at capacity there might still be little need to run GTs to compensate?
d) Do you have any data available to indicate how typical this configuration is in comparison to other possible configurations?
Thanks in advance for any answers you might be able to provide to these questions!
Jenne,
Jon Boone has effectively answered your first question/comment. With respect to the second, I refer you to my blog which has my article entitled Case Study on Methods of Industrial-scale Wind Power Analysis. It can be seen at http://whitherindustrialwindpower.files.wordpress.com/2009/08/response-to-komanoff-case-study-version-v2.pdf . See Appendix A for comments on the Gross study.
Danny,
The model makes no assumptions about what wind power is replacing – baseload, intermediate or peaking. You might want to look at the MIT paper in my bibliography (Campbell, A., Hot Air? When Government Support for Intermittent Renewable Technologies can Increase Emissions, 2008, http://wind-watch.org/documents/wp-content/uploads/campbell-hot-air.pdf) for some of these considerations. This addresses your first question/point and the related ones under “a)” and “c)”. For example, the nature of the baseload generation source, and its ability to be varied with wind is an important issue.
If utility-scale storage capability existed in sufficient quantity, the analysis is changed substantially. As this not the case today, or for the foreseeable future (including pumped storage – hydro or air, flow batteries or the like), it is not an issue.
The configurations shown involving gas turbine plants would be typical of that looked to for most jurisdictions adding wind to their generation portfolios. As such, it represents a general case based on similar comparisons made in the bibliography. There will be exceptions and my posts recognize this with respect to any particular jurisdiction in the conclusions to Part II.
Presumably if wind makes minimal contribution to reduction of emissions it also fails to produce much net energy.
An analysis of UK generation data supports this.
http://www.cambrian-mountains.co.uk/documents/windpower-analysis.pdf
As a physicist and retired worker in the electricity supply industry (nuclear) in the UK, I must congratulate you Kent on an excellent piece of analysis. The information you have provided is potentially very useful and needs disseminating to a wide audience.
Here in the UK, the government has fallen for the propaganda of the BWEA and ignores advice and warnings from power engineers. The UK government has signed up to producing 15% of the UK energy from renewble sources (mainly wind) by 2020, with 35% of our electricity to come from renewables. An impossible task on which they are prepared to spend ~£100billion of consumer subsidies on thousands of onshore and offshore turbines and a massive grid expansion to connect it all together. They mistakenly think they will get massive reductions in CO2 emissions. Because of the cost to consumers, the government is also putting in place measures to alleviate “fuel poverty” which the policy is creating. You couldn’t make it up!
The question is how can your work be used to influence governments? Ideally it needs publishing in a peer-reviewed journal together with massive media coverage.
Phillip Bratby is right on target, both in his commentary about the importance of this analysis to right reason and the imperative to place it prominently in the minds of policy makers.
And thank you, Steve, for posting a link to the UK study, which is based upon an analysis of the official statistics on electricity generation in the UK for the period 2002-2008. It’s very instructive. I recommend that all review it.
Kent, I also congratulate you on an excellent piece of analysis. An excellent contribution.
to Kent
“The “Typical Claim Scenario” shows annual savings of about 3 million tons of CO2” Seems strange because the typical claim is to save 456kg/MWh(CCGT with normalized load). Hence, for a 3,2MW turbine with capacity factor of 28,5% this means 0,28x8760x3,2MWx456kg/MWh =3,6Kt instead of 3Mt.Even if the claim is related to coal (800kgCO2/MWh), this yields 6,3Kt. I am afraid that all the other results have to be read in Kt and not in Mt. Am I wrong? With thanks
Kent did you consider the impact of using smaller turbines for wind back-up like the GE LM6000 which run in the 35-65 MW range? These turbines look like they are designed to be small with very fast responses. They could be run at full load in multiple units which might reduce problems of reduced thermal efficiency of much larger plants run part-loaded.
guido,
Your calcualtion is correct except that the wind capacity is 3,200 MW not 3.2 MW. Looks like the European number representation convention has caused the confusion.
Martin,
You raise an interesting point from a theoretical point of view, but there may be practical limitations to wide-spread use. For example, if this leads to an increase in the number of gas plants, there a greater risk of local resistance and more gas pipelines required. In short, the considerations may be too extensive for this discussion.
The calculator and associated paper are not intended as a prescription or a means to configure various wind/gas-turbine combinations. Its purpose is to illustrate the dramatic impact of volatile wind production on other generation means, specifically gas turbines, which is a generally applicable approach. It provides a framework for the considerations involved and an interim assessment of their effects until sufficiently comprehensive studies can be performed in the areas indicated. Such studies could include a range of possible, realistic configurations.
The calculator results are sufficiently dramatic that other considerations that reduce these somewhat do not change the conclusion that industrial-scale wind power does not perform to the level that justifies its adoption as public policy. The reality is that the same capacity in the larger and more efficient gas turbines left alone to support the same load represents a better alternative. I expect that the type of studies called for will support this.
Now I have an even better understanding of why former Senator Tim Wirth got up in front of the Colorado Oil and Gas Association this summer and extolled them to embrace the wind and solar industries with a political “bear” hug. Since I have no reason to doubt the validity of the model presented here, it seems pretty obvious that building and operating even large wind turbines at an industrial scale will not reduce gas consumption and sales for oil and gas suppliers.
It will, on the other hand, help to convince alarmists that we are doing something about CO2 emissions and will soak up a large quantity of financial resources that could be invested in new nuclear power plant capacity. Unlike wind turbines, nuclear power has proven that a helping hand to get it started results in massive quantities of power generation, an end to a need for continued subsidies, and a large new tax base that can improve local and national economies.
When it does that, however, nuclear takes markets away from oil, coal and gas, increasing the available energy supply faster than demand increases. That drives down the price of fossil fuels and reduces the wealth and power of fossil fuel focused providers.
(If you are not convinced, take a hard look at fossil fuel market prices for the 15-20 years following the first Nuclear Age, a time in which production from nuclear fission increased from 0 to roughly 12 million barrels of oil equivalent per day over a 30 year period.)
Rod Adams
Publisher, Atomic Insights
Rod:
A number of us reached the same conclusion some years ago. The latest sloganeering by the natural gas industry boasts that natural gas will enable wind and solar–rather than replace the “need” for them entirely. Of course, by increasing the use of natural gas for electricity production and teaming it with wind and solar, the industry would also regressively increase electricity costs–and potentially reduce the amount of natural gas available for heating, which also will regressively increase heating costs.
This is the kind of thinking that led to all hell breaking loose in the financial sector, led as it was by shoddy accounting and subprime mortgage schemes.
The work of Kent Hawkins is extremely interesting and timely. Myself and a group of people in Belgium are just about to create a similar “calculator” in an attempt to check the uncontrolled implementation of on-shore wind farms here. As we know, there are two basic issues :
1. Face saving. How to present the political world with the higly politically incorrect reality exposed by the work of K.H. and others so that it will rapidly lead to the re-assessment of wind farm deployment policies which are now embedded in several layers of EU/National/regional laws.
2. Validation. However sound the work of K.H., some sort of independant review is urgently needed in order to qualify for the task under item 1.
As we are in a quasi emergency situation over here (dozens of wind farms seeking and getting construction permits), what do you suggest ?
Sincerely,
Patrice
Patrice:
Your question is the question on the lips of many. How to widely circulate Kent Hawkins’ work in ways that will stimulate knowledgeable discussion by policy makers before the world embarks on a widespread commitment to wind technology, with its false promises of replacing fossil-fired generation and offsetting substantial carbon emissions. As you imply, all the monetary subsidies for wind would be wasted.
One hopes that Kent’s ideas will published soon in a highly respected energy journal. If so, perhaps EPAW, and other concerned groups around the world, would call for a press conference and surround it with a public relations campaign that reinforces Hawkins’ conclusions.
At the same time, why not publicly clamor for access to wind performance data in Europe, using your “calculator” to measure wind’s impact on thermal behavior in your country? I believe there is a team in The Netherlands doing just this–assessing wind in Germany, where the data is more easily studied. This report may also soon be available.
It is essential that Hawkins’ method be applied as soon as possible, so that is can be tested against reality. This is made extremely difficult because of the proprietary confidentiality that cloaks so much of wind performance. One simply can’t get access to the necessary data. You might consider demonstrations in Belgium that would demand data access.
If it is impossible to account for the wind industry’s claims about actual performance, then the industry should not be given any credibility beyond that given ordinary swindlers.
Kent can the calculator answer my question below (even approximately)?
Inputs:
Wind capacity factor = 30%
Proportion CCGT to OCGT = 50:50
Question: What is the percentage increase of the cost of electricity generated by gas compared with the no-wind case?
I presume the cost difference would take into consideration the increased investment in OCGT (operating at average low capacity factor, e.g. 15%) compared with CCGT (operating at higher average capacity factor, e.g. 50%) for the case with wind.
1. For CF = 30% and CCGT:OCGT = 50:50 for high wind half of year (and 75:25 for low wind half)
Gas consumption
Without wind: 192,000 MMcf/yr
With wind: 177,000 MMcf/yr
CO2 emissions
Without wind: 11.2 mt/yr
With wind: 11.5 mt/yr
2. For OCGT:CCGT = 50:50 all year
Gas consumption
Without wind: 192,000 MMcf/yr
With wind: 187,000 MMcf/yr
CO2 emissions
Without wind: 11.2 mt/yr
With wind: 12.5 mt/yr
The calculator does not look at costs. Here is a possible answer. The increased costs would have two components:
1. Given the similar amount of gas consumed with and without wind, the total cost of the wind plants, less the small fuel (gas) savings, plus
2. The cost differential, between no wind gas turbine plants and CCGT:OCGT plant mix required with the presence of wind. You raise an interesting consideration. The calculator looks only at the gas plant electricity production and not the capacity of gas plants used and the associated capacity factors. This is worth looking at.
Contact me at kenth@kos.net and I will send you more information on the calculator.
It seems to me that these discussions have become hopelessly bogged-down in a seemingly endless landscape of (apart from wind turbo-junk) complexities.
From some 20 years of solo, unpaid, “R+D”, I can state that the actual reality of both Wind, and Solar energy is really quite simple. They are both inherently a distributed resource. Centralization is physically degrading for either. This is a happy state of affairs for everything on Earth apart from those who would like to be in charge, or part-of, of a large corporation, but as yet are not.
It is readily possible to get around 5% of cost returned annually in many sites from a very good design of wind Turbine-Alternator Device – TAD ? – and undoubtedly much more in particularly good sites. This btw, is about 40 x that returned from current “industrial-scale” investments. There are 4 or 5 clear reasons why this disparity exists. If you would like to know – but without risking the 20-year research hiding to whatever – simply email bertdotwindonatgmaildotcom.
[…] Part 1 […]
[…] Natural gas used as wind back-up in place of baseload or intermediate gas (in the absence of wind) results in approximately the same gas burn and an increase in related emissions, including CO2. Extrapolating from this example to the whole, the working hypothesis is that intermittent wind (and solar) are not effective CO2 mitigation strategies because of inefficiencies introduced by fast-ramping (inefficient) operation of gas turbines for firming otherwise intermittent and thus non-usable power. […]
[…] This implies that adding wind to an electricity grid that contains lots of old coal plant would not result in many emissions savings. Unfortunately for Bentek’s analysis, the emissions from Colorado’s electricity generating plant have been decreasing since wind came onto the system, by nearly the same amount as the added wind capacity. Wind events of the magnitude used by Bentek’s report are rare – far more common sources of cycling are daily changes in demand levels, which you can see in Figure II-7 in Bentek’s report. Indeed, Bentek did not present us with the changes in generation for the days they analysed beyond the times of the wind event, making it very difficult to claim that only that event caused the rise in emissions. It’s therefore not clear at all that cycling caused by wind leads to a net rise in emissions even from old coal plants. However, this doesn’t stop Kent Hawkins from claiming that using gas to balance wind leads to a net increase emissions. […]
My response to the comments by Anatomy of a Wind Myth have been delayed due to the press of other activities. There is little merit in the analysis and knowledge of the matters raised by the author of “Anatomy”, and this will be dealt with quickly here. Here are some highlights:
• The author depends extensively upon ad hominem arguments, which is a very questionable tactic in this type of discussion.
• I did not help write the le Pair and de Groot paper. Their method of analysis is quite different from that used in my calculator. I did point out some mathematical issues in one of the tables, which the authors acknowledged, and they do cite one of my papers. Neither of these, or both together, is hardly evidence that I “helped to write” their paper.
• The author points out the presence of a reasonable, standard warranty disclaimer in the Bentek report, which is presumably done in an attempt to cast doubt on its results.
• In the analysis of the Bentek Colorado case, he makes the all-too-frequent, and ill-informed, mistake of assuming the fossil-fuel electricity production is directly related to emissions. The two are not well correlated, say year over year, for many reasons including changes in: (1) the mix of fuels, (2) actual despatch of available generation resources, (3) net interstate trade in electricity, (4) introduction of new plants and retirement of old, and (5) installed technology that improve the efficiency of a plant or that incorporate technologies for removing emissions. A good example of this can be seen at http://www.masterresource.org/2010/09/windpower-overblown-part-ii/#more-11930 in Figure 3.
• In his criticism of the Bentek Colorado analysis (some of which is reasonable), he does not mention their analysis of the Texas case, which confirms the admittedly more limited Colorado results.
• The author does not understand the Katzenstein and Apt study. His points are addressed in Part II to this post at (http://www.masterresource.org/2009/11/wind-integration-incremental-emissions-from-back-up-generation-cycling-part-ii/ and with a more careful look at the cited report. Katzenstein and Apt properly point out the limitations of their analysis. The casual reader might miss this.
• With respect to the Milligan report, see my critique of this at http://www.masterresource.org/2009/12/wind-integration-incremental-emissions-from-back-up-generation-cycling-part-iii-response-to-comments/
• As I have pointed out elsewhere (http://www.masterresource.org/2009/12/wind-integration-incremental-emissions-from-back-up-generation-cycling-part-iii-response-to-comments/ , the correlation of production between wind plants up to distances of 1,000 km, and more, is still positive. Zero correlation would produce a random result with increased range of variation. Any smoothing effect would require significant negative correlation. As in the case of help from improved forecasting of wind well in advance and for short time intervals (significantly sub-hour) is a faint hope.
In summary, there is not much in the way of bones in this “anatomy”.
[…] In November 2009, Kent Hawkins, a Canadian electrical engineer, published a detailed analysis on the frequency with which gas-fired generators must be cycled on and off in order to back up wind power. Hawkins findings: the frequent switching on and off results in more gas consumption than if there were no wind turbines at all. His analysis suggests that it would be more efficient in terms of carbon dioxide emissions to simply run combined-cycle gas turbines on a continuous basis rather than use wind turbines backed up by gas-fired generators that are constantly being turned on and off. Hawkins concludes that wind power is not an “effective CO2 mitigation” strategy “because of inefficiencies introduced by fast-ramping (inefficient) operation of gas turbines.” […]
[…] In November 2009, Kent Hawkins, a Canadian electrical engineer, published a detailed analysis on the frequency with which gas-fired generators must be cycled on and off in order to back up wind power. Hawkins findings: the frequent switching on and off results in more gas consumption than if there were no wind turbines at all. His analysis suggests that it would be more efficient in terms of carbon dioxide emissions to simply run combined-cycle gas turbines on a continuous basis rather than use wind turbines backed up by gas-fired generators that are constantly being turned on and off. Hawkins concludes that wind power is not an “effective CO2 mitigation” strategy “because of inefficiencies introduced by fast-ramping (inefficient) operation of gas turbines.”“ […]
I have to disagree with the magnitude of the inefficiency of gas turbines relating to ramping rate. While this effect is significant, and does require study, newer technologies have reduced the need for inefficient OCGT to rapidly respond to changing demand/wind production
For example, GE’s new Flexefficiency combined cycle gas turbine is one of the most efficient on the market (>60%) and can be ramped in 30 minutes.
These advances in turbine technology will allow significantly more variable renewables to be integrated into the grid without excessive file burn/emissions to compensate for wind variability.
Andrew,
Interesting comment on magnitude, as no one knows the magnitude of the inefficiency of gas turbines in the wind mirroring role. Well that’s not true, because I have indications that some people do know, but they are not saying, publically.
That is why in the technical appendix I show a range of inefficiencies (heat rate penalties), so your comment is bordering on the non applicable.
You do raise the matter of newer gas turbine technologies and cite a 30 minute ramping capability. It’s not clear what this means. I suspect that you mean from start-up to full power. I think you will find that only a few cycles a day are assumed, versus hundreds.
Another point in this regard is that the ramping requirements to mirror wind are in much smaller time intervals – from seconds to a few minutes, and importantly, continuously 24 hours a day – except of course when the wind plants are not producing or are curtailed. You should revisit your point on the full implications of this impact on efficiency, as well as the maintenance burden of this constant load change. Compare mirroring wind to driving a car on the highway and alternately pumping the gas and brake on a continuous basis. Imagine the gas efficiency.
Regardless of the capabilities of newer gas turbine technologies, as already stated, wind requires these to mirror its volatile output on a continuous basis. This represents a duplication of capital costs to produce electricity that the gas turbines could supply on their own.
One also has to consider the transmission requirements of duplicating wind with gas turbines – no matter how efficient. We require substantial (and otherwise unnecessary) electric grid upgrades to gather the widely dispersed wind energy source and transmit it over large distances to demand centers. As well, the wind balancing will have to be done rather locally due to grid topology considerations. This likely means a dispersed network of gas plants for this purpose, which will require additional gas transmission/storage facilities. Think of these unnecessary additional costs and difficult permitting process for these.
Incidentally, the calculator has been updated so the results change somewhat but not materially. The latest is at http://www.masterresource.org/2010/11/the-calculator-14-results-part-i/
In short you have a lot of work to do to support your thoughts here.
[…] In November 2009, Kent Hawkins, a Canadian electrical engineer, published a detailed analysis on the frequency with which gas-fired generators must be cycled on and off in order to back up wind power. Hawkins findings: the frequent switching on and off results in more gas consumption than if there were no wind turbines at all. His analysis suggests that it would be more efficient in terms of carbon dioxide emissions to simply run combined-cycle gas turbines on a continuous basis rather than use wind turbines backed up by gas-fired generators that are constantly being turned on and off. Hawkins concludes that wind power is not an “effective CO2 mitigation” strategy “because of inefficiencies introduced by fast-ramping (inefficient) operation of gas turbines…. […]
Calculator Updates
Anyone coming across this as their first reference to my calculator you should be aware that updates have been provided, first at http://www.masterresource.org/2010/02/wind-integration-incremental-emissions-from-back-up-generation-cycling-part-v-calculator-update/, and subsequently at http://www.masterresource.org/2010/11/the-calculator-14-results-part-i/ .
[…] In November 2009, Kent Hawkins, a Canadian electrical engineer, published a detailed analysis on the frequency with which gas-fired generators must be cycled on and off in order to back up wind power. Hawkins findings: the frequent switching on and off results in more gas consumption than if there were no wind turbines at all. His analysis suggests that it would be more efficient in terms of carbon dioxide emissions to simply run combined-cycle gas turbines on a continuous basis rather than use wind turbines backed up by gas-fired generators that are constantly being turned on and off. Hawkins concludes that wind power is not an “effective CO2 mitigation” strategy “because of inefficiencies introduced by fast-ramping (inefficient) operation of gas turbines…. […]
So what happens to the model if:
– increase wind capacity factor to 35 per cent
– assume zero coal (it is on the way out in Ontario), 10 per cent ocgt and 90 per cent ccgt
– increase efficiency of ccgt to 70 per cent
– account for nuclear, hydro and import
– assume full build out of wind in Ontario to 7200 MW?
None of these change the nature of the results materially. The calculator runs shown are intended to illustrate the general point that fossil fuel and emissions savings are negligible to negative with the introduction of wind. It does this by taking into account a range of factors that must be considered and the likely result.
A wind capacity factor of 35% across a large wind deployment is so unlikely as to not be worthy of consideration. One factor is that as wind production increases and wind curtailment will likely increase as is happening in large wind implementations anywhere, including Germany, and Texas for example. Another is that higher wind will result in even less efficient operation of wind balancing plants, and in the case of fossil fuel plants will increase the fuel consumption and emissions rates.
The calculator addresses only the generation capacity that is balancing wind. So other generation assets are not considered. In practice others might be affected by the presence of wind, especially during low demand periods when wind production is high, for example at night.
In the event of high nuclear and hydro production and imports, wind would act to reduce these and would be replacing generation resources with little or no emissions. Any emissions in the exporting jurisdiction side of this transaction involving fossil fuel plants would continue unabated.
A greater build out of wind in Ontario would provide no benefits and an increase in significant negative impacts, including higher costs, less reliable electricity, increased grid deployment, negative impacts on flora and fauna and humans in the vicinity of wind plants, diversion of substantial resources (tens of billions of dollars in Ontario) into unproductive investments, contribute to the widening of the gap between the wealthy and other members of society, serious threat to our economies and financial systems, negative impact on local real estate and economic activity in rural areas and creating divisiveness in communities.
Kent
I would have believed that you were truly interested in understanding and modelling a power system….then you had to go and include your last paragraph. Sadly this now exposes your ideological tendencies, and have used recycled garbage misinformation. You have exposed yourself to the detriment of what could have been a good model. Based on your last statements, how are we to actually believe that you have provided an honest look at the system, absent of bias? You have made vague and unsubstantiated statements on impacts tht are perceptions held by a select few, promoted by fear mongering, and are not grounded in scientific truth. Are you now suddenly an expert in wildlife, human health and property values? wow. you must be a really well educated fellow. I thought your expertise was in power market analysis?
Of course the issues you mention are outside my primary focus. I have worked with others in all these areas and have quite a library myself on them. For example in connection with human health I know the eminent Canadian physician, Dr. Bob McMurtry, who was also Dean of Medicine at Western University and is a supporter of the claims of human health issues, a sound specialist at Queen’s University and many others who have researched these and other topics. There is ample information available to back up my general statement.
The fact that you characterize these as”… perceptions held by a select few, promoted by fear mongering, and are not grounded in scientific truth.” is in itself pretty good evidence that you are not knowledgeable enough, and likely rely on our governments, industry lobbyist organizations, green-NGOs and the media for your information.
I suggest you visit a post where I addressed this at http://www.masterresource.org/2012/09/wind-consequences-v/ for a more complete explanation of the realities of my statements.
Thank you though for suggesting that I am well educated. Or were you just being sarcastic?
No – not being sarcastic. I actually don’t follow you that closely. But. You mention McMurtry. Enough said. I know where you are coming from now. I shan’t bother wasting my time on this site anymore. Cheers
[…] of bird and bat deaths would likely be much higher than that. Wind turbines produce power on an intermittent and unpredictable basis, meaning conventional power plants must remain cycling on a constant basis to fill minute-by-minute […]
[…] emissions: http://carbon-sense.com/wp-content/uploads/2011/06/lang-wind-and-emissions.pdf and http://www.masterresource.org/2009/11/wind-integration-incremental-emissions-from-back-up-generation… Why Wind Won’t Work: http://carbon-sense.com/2011/02/08/why-wind-wont-work/ Energy Consumption […]
[…] truth is quite the opposite, and the science is simple. (See here and here and here.) The taxpayer billions spent on Big Wind during the Obama years squandered our financial, […]
[…] on wind actually increases emissions and fossil fuel use overall, due to inefficiencies introduced into the system. Big Wind eliminates […]
[…] on wind actually increases emissions and fossil fuel use overall, due to inefficiencies introduced into the system. Big Wind eliminates […]
[…] on wind actually increases emissions and fossil fuel use overall, due to inefficiencies introduced into the system. Big Wind eliminates […]
[…] on wind actually increases emissions and fossil fuel use overall, due to inefficiencies introduced into the system. Big Wind eliminates […]