Big Wind: How Many Households Served, What Emissions Reduction? (A Case Study, Part 1 of 2)
By Kent Hawkins and Donald Hertzmark -- January 27, 2010In the midst of a bitter winter in North America and Europe, General Electric has announced a large wind project to be built in Oregon. Press reports in the Financial Times and USA Today describe a project of 338 machines of 2.5 MW each, giving a total capacity of 845 MW.
With power grids strained due to heating demand, increments to generating capacity are to be welcomed. But along with the usual hoopla about homes served and CO2 emissions savings, it is time for some “devil’s advocacy” by asking: – how much energy and capacity will this project really create? How much CO2 will be saved? And when the chips are down will consumers and grid operators be pleased that their funds have gone into wind rather than into some other generating source?
We strongly suspect that neither consumers nor grid operators will benefit greatly from this plant. Our brief analysis of this announcement shows that the claims for houses served and carbon saved are not supported, though some incremental, useful energy supply may be possible under some circumstances. All such claims depend on the system operator’s ability to use the wind farms’ output to offset hydro generation, the key generation resource in the Northwest United States (NW).
Contributing to Capacity: The Sine Qua Non of Power Generation Investments
In the service area where the new wind project will be located, total generating capability is 84 GW. Hydro accounts for 60% of this total (nominally). Current peak demand in the NW power pool, into which the wind project will inject energy, stands currently at just over 60 GW, about the same size as the UK grid. In the winter season provisions for other claims on the water (irrigation, flood control, endangered species protection, etc.) reduce the available capacity of hydro by some 7 GW. The pool’s own capacity assessment notes that “A severe weather event for the entire Power Pool area will add approximately 6,000 MW of load while at the same time reduce [sic] the capability by 7,000 MW.”
In other words, when the chips are down, hydro’s contribution to meeting a larger peak demand may fall by as much as 7 GW, with another 6 GW less capacity from other generation sources. Let’s do the arithmetic: the “normal” winter peak (50% probability) is 61 GW, generating capability (not the same thing as firm capacity) is 84 GW. Comes the storm and the peak rises to 67 GW, while the “capability” falls to 71 GW, providing just a bit more than the minimum reserve requirement of 5 GW.
How likely is it that wind can add to capacity in the midst of a winter demand surge and capacity restriction?
From recent UK experience, not bloody likely. The following table was taken from the UK system operator website for the first week of January 2010; most days since the middle of December 2009, when winter weather gripped the nation, have looked similar.
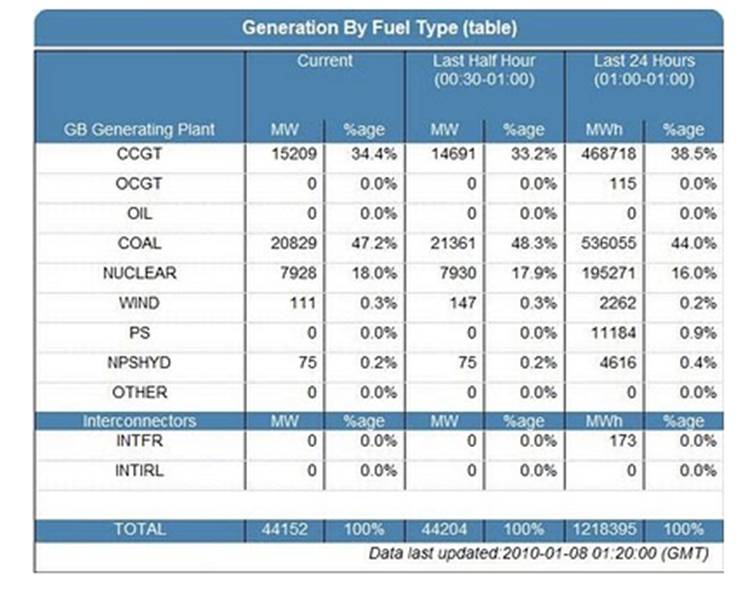
The outstanding performer is gas-fired CCGT technology, ~34% of capacity and 38-40% of output. Coal and nuclear supply almost all the rest of the capacity and energy. So where is the wind? The UK, with more than 4 GW of wind generation capacity (~6% of total), saw essentially no help from wind in meeting demand during this entire period. With wind’s contribution to capacity ranging from just over 100 MW to about 500 MW for much of the crisis period, about a 2.5 – 9% capacity factor, and with wind’s contribution to energy at less than 1% for days on end, one would be hard-pressed to attribute much of a peak contribution to a large wind project in Oregon.
235,000 Homes Served? Is This Claim Likely or Even Possible?
The claim is that the project will provide enough energy to power 235,000 households. Assuming a generous capacity factor of 30 per cent this yields a reasonable average annual household use of:
845 MW x 1,000 (convert to KWh) x 0.30 x 24 (hours per day) x365 (days per year) / 235,000 = 9,450 KWh per household
A reduction in capacity factor to 25 per cent reduces the households served to about 176,000. Is this a reasonable consideration? Recent experience world-wide shows that capacity factors are often less than that.
But these calculations rely on a measure that reflects the aggregate annual consumption. A more realistic representation would be based on meeting the peak demand per home, which is estimated to be approximately 1.5 kW. How do wind plants perform on this basis? Using the more applicable measure of capacity value (sometimes called capacity credit and explained further below), the proposed project will theoretically generate enough energy to meet the needs of about 49,000 households, at a cost of more than $2 billion for initial investment. Over a 20-year lifetime that electricity will cost the NW Power Pool about 17 cents/kWh for “average” power, and some of the costs can be made to “disappear” through the use of state and federal tax credits and other subventions. It is not easy to calculate a “firm” supply cost for wind, given the absolute reliance on backup, but this is in addition to the above 17 cents/kWh. For the kind of money that wind costs the pool could supply diesel generators to neighborhoods for an investment of less than $600 million and contribute a firm 845 MW at about 20 cents per kWh (including fuel). Those diesel units could reliably meet the peak demand needs of more than 563,000 households as follows:
Given an average peak requirement of a household, equal to about 1.5 kW, and assuming a coincident peak, then a firm 845 MW of generation, as supplied by the diesel units, can meet the needs of about 563,000 households.
i.e., 845 MW x 1,000 / 1.5 = 563,333 households
Even using the possibility that some of the diesel units would be unavailable, probably 2-3%, the number of households that could be served at peak reliably would still be more than 546,000 (97% plant availability at peak).
Wind cannot be relied upon to provide firm generation at full capacity coincident with peak demand. Wind might be capable of contributing to the peak demand requirements of the system at some times. However, this will rarely happen, and when it does it will be for brief periods. In these circumstances, the expectation of the number of households served will be just over 49,000. To calculate this it is necessary to introduce the factor representing the statistical expectation of wind production at peak demand times. This is capacity credit, or capacity value, which brings a number of considerations into play, but typical experience, and the figure used by the Texas system operator, is 8.7 per cent.
i.e., 845 MW x 1,000 x 0.087 / 1.2 = 49,010 households
In spite of all statistical expectations of output from wind generators, these households will not be served reliably in any manner that meets their needs. Taking this out of the comparatively benign case of households, can you imagine a hospital, a school or a business relying on an electricity supply dominated by wind? Calculations that are based on aggregations summed over a year and averages do not reflect the real world, which operates in real time.
For significant periods of time, no households will be served, as was demonstrated by the UK data. For almost all of the time, the electricity supply will be so unreliable as to be useless. If there were some way to store the wind-plant electricity produced, then some of this would make sense. Even granting such a widely available storage capability, there would be considerations of the relationship between the storage being filled compared to the draw on it, again in real time. Annual aggregations and averages are not a reasonable way to look at the fluctuating performance of industrial-scale wind power.
The message that emerges from both the calculations and experience is that claims regarding homes served by industrial wind power are not valid measures of wind’s value. The true measure of value is the displacement of hydrocarbon fuel and reduction in CO2 output by the power generation system. As shown in previous articles, the need for shadowing and backup generation to ensure that load can be met despite fluctuations in wind output may result in little or no net decrement to fuel use or emissions.
However, our analysis shows that under some circumstances integration of industrial scale wind may permit small reductions in shadowing and backup fuel use, provided there is sufficient excess hydro capacity. For the Oregon wind farm case, wind would seem to be specifically excluded from meeting winter peak demand. However, wind may be able to contribute somewhat to meeting energy demand in the off-peak seasons.
In Part 2 we consider under what conditions and to what extent an industrial wind facility may save fuel or reduce CO2 emissions.
One only needs to take a look at output of BPA’s (Bonneville Power Authority in Oregon) 2700 MW of turbines the last few days. The eyeball output for the past 3 days, 1/24-1-26 was less than 10%. At no time did the output reach over 20% of capacity. We can only hope the world will soon wise up regarding this scam.
oops the link. BPA turbine output
excuse me for the multiple posts, but the best place I found to evaluate the reliability of wind is the Ireland Power System output graph. The maximum output is about 1200 MW. You can look at historical data by simply clicking the previous or using the calendar. Output routinely varies by 20% in an hour.
Here is Ontario, scroll to the bottom.
Basin Electric, North Dakota
Ercot, Texas – I can’t find graphs or historical data, but I notice that the wind output is always less than spinning reserve, meaning, there is always a duplication of the wind energy output in case of a sudden, unanticipated drop in wind energy. These sudden 20% drops are routine and a grid manager would Never take the chance of a allowing a blackout to occur because of a sudden drop in the wind. My theory is that when a grid reports that wind supplies say 6% of their customers electricity needs, it is an illusion, because a significant amt of that 6% is backed up by spinning reserve, which is energy created and wasted, lying in wait for a sudden drop in wind turbine output. Look at a weeks history of Irelands wind output, the sudden 20% drops are routine.
Nice work gentlemen. I’ve long argued that wind fails on contribution to summer peak demands (in CA always less than 5% of nameplate on peak), but this is first I’ve seen that deals with winter “peaks.” As a side note, CA market and PNW markets participate in seasonal exchanges (electrons moving north in winter/south in summer.) Finally, in response to the question of “homes served” the answer is somewhere between zero and MAYBE 2% as that is the statistically significant correlation of capacity with load. Several ISO have default capacity credits, all lower than 10% and dropping. Wind does not contribute to load; you’ve been more than gratious giving them credit where the credit is actually the diesel backup.
Tom Tanton characteristically provides insightful emendations to this good piece. And, yes, Nofreewind is correct about the instructive nature of both the BPA and the Ontario IESO daily wind reports, showing the wind volatility. Perhaps one day we’ll have access to the performance data at useful time intervals of all power generators involved with wind integration, so that we can measure, transparently, the thermal costs of such machine behavior.
I don’t wish to be pedantic on operating definitions, but I do think we should try for clarity on the functional ideas behind capacity credit and capacity value. They don’t, to me, appear to be interchangeable. And, if they are, then perhaps we should use the term effective capacity to differentiate between capacity that is statistical from capacity that is actual.
Traditionally, the capacity credit of a power source, particularly like wind, is determined by calculating a history (often over three years) of how much capacity was available at key peak demand times during a year, then averaging these amounts in terms of the installed capacity of the power source. Consequently, when ERCOT claims wind has a capacity credit of 8 percent, we should infer that an “average” of 8 percent of the installed capacity of wind serving this region was found to be available at the key times when ERCOT took the sampling.
But this does not mean that, for any future key demand time, that ERCOT’s wind machines will collectively produce 8 percent of their installed capacity. Or 6 percent. Or zero. Or 80 percent. In the same way a baseball hitter’s batting average can’t predict what the player will do in his next at bat, wind’s capacity credit cannot predict how much energy any wind project will produce at any future time.
I’ve been using the term capacity value for how much capacity can be firmly relied upon at any future time, which is clearly a different idea than that for capacity credit, which is only an average. If the industry standard is to use these terms interchangeably, then perhaps I–and others–should reserve the term “effective capacity” to define, operationally, what is meant by firm, available power.
Finally, I think it’s fairer to say that wind volatility couldn’t serve a dog pound with today’s expectations for reliability and performance.
I get stuck on the math behind the claim that 235,000 households would be served….at an average annual use of 9,450 kWh per household!!! What?!?!?! Where does such an outlandish annual kWh number come from? It’s more like 1,000 kWh.
typo….12,000 (at least)
Tom, Jon,
Thank you very much for your well thought-out comments. Our purpose here and in Part 2, is to show that claims of households served, emissions reduced, fuel saved, puppies provided to toddlers, etc, need to be based on some reasonable system-wide measures, just as they are for firm-capacity plants.
As to the effective capacity issue, I think that if we go back to a definition of effective capacity as the expected value at the 92.5% level, then we get to the kind of 6-8% numbers that are used in various pools. That is to say, we are more than 92% confident that xx% of the wind capacity will be available during specific hours of concern. E.G., with 1,000 MW of wind capacity and an effective capacity of 7.5%, we think that wind can provide 75 MW of capacity during the specified period.
I am more comfortable with the concept of capacity value than capacity credit, which is usually a negotiated and sometimes political number. I hope that we have maintained a clear distinction in this article. Finally, we try to make a clear distinction between capacity value (or effective capacity or capacity contribution) and average output or annual average capacity. I agree that such a figure is misleading and we show in the post how reliance on such a concept leads to erroneous conclusions.
Finally, we wanted to show that a single wind project cannot be considered in isolation from other intermittent suppliers, especially when intermittent supplies are large relative to the overall system.
Thanks, Don. But there is still a substantial difference between acting upon a statistical projection–the capacity credit, used principally as a planning hedge to predict whether there is adequate supply to meet future demand, which could be for a year, month, week, day, or hour ahead–and acting with the knowledge of virtually certain availability. Capacity credit planning helps secure the grid and reduces cost. However, using a capacity credit for wind, given its volatile, purely statistical nature, doesn’t really mean that much, since a good number of times grid operators must tap into the spot market to compensate for wind’s shortfall anyhow.
A while back, as I began to parse the energy implications for wind integration, it was easy to become bogged down with industry argot, which often blurred concepts in the way that experts often do to make even simple ideas appear to be abstruse and “technical.” People spent whole papers arguing about the importance of capacity factors, for example, as if they were arguing the importance of Talmudic texts. In reality, the capacity factor business, I ultimately discovered, obscured the real fly in the ointment, which was wind’s utter lack of effective capacity (capacity value) within a system that insisted upon virtually certain effective capacity. For several years, I have used the two terms–capacity credit and capacity value (or effective capacity) differentially to explain what is distinctive about them.
Good methodology is too often subverted by sloppy definitions, and not just in the energy business. They often create what is known as methodological “slides,” allowing an argument to slip from one focus to another without proper adjustment–such that apples can then appear to be oranges. This is why operating definitions musts be rigorous and fairly applied.
The critical test for “capacity value” for wind is: how much electrical output can we really count on when electricity demand is at peak levels? Since we don’t know if the wind will “actually” be blowing at the time of peak demand, the real answer to the question is “zero.”
Hence, I maintain that there should be a clear standard for explaining the difference between “expected” energy for planning purposes, based upon historical averages, and “actual” availability of energy whenever demanded.
My car, for example, has a capacity factor of, perhaps, 10 percent, given the time I choose to drive it. Based upon my experience, my car also has these days a very high capacity credit beyond 99 percent. And it’s capacity value–or effective capacity-is the level of my confidence that my car will be available for use at any 15 minute time-ahead interval. You will note that this idea is not quite the same as the idea behind capacity credit.
Let’s return to my baseball analogy. Applying these ideas, I can say that a 300 hitter has a 30 percent chance of getting a hit during any future at bat, which would be his capacity credit. But if a particular batter performs in next at bat just as I predict, that is, for me, his effective capacity.
Overwhelmingly, the performance of conventional generators on the grid mirrors my experience with my car, making their capacity credits virtually indistinguishable from their effective capacity. With volatile intermittents like wind, however, the distinction is cavernous–and mathematically infinite, since there is an infinity between zero and one.
And it’s for this reason that the “cost” of wind projects can’t really be fairly compared to the “cost” of conventional generators, since doing so compares things that do work as expected on demand with those that do.
Correction: And it’s for this reason that the “cost” of wind projects can’t really be fairly compared to the “cost” of conventional generators, since doing so compares things that do work as expected on demand with those that do not.
bill,
The 2007 US average per household is 11,232 kWh per year, but there are regional variances and California is 6,955 kWh per year. This information was derived from http://www.eia.doe.gov/cneaf/electricity/esr/esr_sum.html. As California is the target customer area, but not necessarily the actual end user group, the number calculated is about in the middle of that range. The calculation was a test of the basis for the claims made. In any event, as we point out, this is not a realistic way to look at the performance of wind plants.
A special historical irony here, Kent and Don. The “homes served” concept now used to hustle wind, which technology couldn’t dent a grape in the scheme of things, was first used (to my knowledge) about 60 years ago to make people feel warm and fuzzy about the new nuclear technology–a PR must at the time with images of Hiroshima and the mushroom cloud. Of course, the idea doesn’t engage the commercial, industrial, public sectors, which dominate electricity demand. But who’s counting?
Putting resources into wind (and solar) makes them unavailable for investment in alternatives, and creates a self-fulfilling prophecy – 1000 MW of installed wind turbine capacity won’t deliver peak power when needed, and installing another 1000 MW of wind won’t either – you just end up with double the capacity not doing the work. Meanwhile, the resources used for wind negate investment in reliable current technologies – nuclear – or in technological advances in power production – the next generation of nuclear. Amazingly, nuclear solves all the shortfalls of current power production – it is scalable, reliable, no CO2 “pollution”, can be located near where needed, and for all practical purposes, is renewable. It doesn’t mess up rivers, pristine landscapes, or scenic vistas like hydro, wind, and solar. It is abundant, inexhaustible, and relatively inexpensive – with the advances in technology that can be expected for this young industry, we can expect dramatic increases in power production and waste and cost reduction.
Great point, Mike. The lost opportunity costs that result from wasted investment in wind are breathtaking–and cause for alarm on the part of those seeking a better future.
Jon writes: “..using a capacity credit for wind, given its volatile, purely statistical nature, doesn’t really mean that much, since a good number of times grid operators must tap into the spot market to compensate for wind’s shortfall anyhow.”
I believe distinguishing between these two potential definitions is of value:
1.) The 92.5% expectation of steady supply of 8% or greater of its rated capacity, measured 60 times per second, over a peak demand contract period (typically one hour). (Perhaps analogous to the probability a batter will at least make contact with EVERY PITCH thrown at a particular ‘at bat.’)
2.) The 92.5% expectation that wind will supply 8% of its nameplate capacity or greater at any single future sample increment of peak demand. (The batting average)
After three years of devoted study to this issue, I am sorry to admit that I don’t have my arms fully around the nuances of the terms.
…cause it’s ONE, TWO, THREE strikes you’re out at the old …ball …game !!! !