Evaluating Wind Impact (Part II — Ramping)
By Kent Hawkins -- August 10, 2016“Understanding the impact of wind requires very detailed analysis of ramping events on a short term basis. The analysis provided here raises even more questions, so there is still much to be learned to properly quantify any impact from the presence of wind on fossil fuel or emissions savings. Arguably the complexity involved defies analysis.”
“Wind increases the magnitude of the balancing activity by increasing the ramping over load alone with a notable number of large ‘outliers’. The dynamic impact of this can substantially increase the rate of fossil fuel consumption and emissions in fossil fuel plants in the net load balancing role over that claimed by any less rigorous analysis.”
Part I yesterday in this three-part series examined wind intermittency/integration basics. Part II today focuses on the ramping impacts of the combination of load and wind (net load). This is shown as the changes in their levels between 5-minute intervals. Also considerations about the determination of the efficiency of net load balancing plants at each time interval will be addressed.
In the short term (a few minutes or less), load is as unpredictable as wind, and requires continuous balancing activities, which is part of ancillary services. However, in the longer term (hours and days), load changes in a reasonably predictable way to rise to, and fall from, peaks in the morning and afternoon.
The response to this is to bring intermediate and peaking generation plants online and then remove them on a scheduled basis. Although somewhat predictable in a general sense in the longer term, wind is less predictable than load in this time frame.
The following topics are more important than the basics covered in Part 1.
Wind Balancing Plant Efficiency Considerations
Analyses today do not completely capture the dynamic impact imposed on wind balancing generation plants by the erratic combination of load and wind. Many simplistically use the basic information of electricity production by fuel type, coupled with simplistic determination of efficiency levels or questionable published emissions/fuel information to assess the performance of wind in reducing fossil fuel use and emissions, all of which still show notable savings with wind.
Some do go so far as to use the basic electricity generation in each time interval to determine the efficiency impact as that indicated by the loading at the end of each measurement interval (or an overage over the interval). It is assumed that the specific fuel consumption (energy content per unit of electricity produced) and specific emissions (emissions per unit of electricity produced) for the interval can be derived from this.
This implicitly assumes that the efficiency level experienced is that of a generation plant operating continuously at this level for a much longer period, and is thus static in nature as it ignores the dynamic effect of the change in loading within this short period.
Taking this into account would further decrease the efficiency level actually experienced, which would result in higher specific fuel consumption and specific emissions than determined using the simpler static approach. Establishing the dynamic effects is much more difficult and there is little, if any, adequate data available to do this.
Unfortunately, the apparent comprehensive nature of this static approach, which is sometimes applied at the individual generation plant level, is easily mistakenly seen as conclusive.
To illustrate the short term dynamic implications, imagine the effect on gasoline consumed by your car on the highway of randomly every few minutes jamming on the brakes or tramping on the accelerator to various degrees. Compared to driving at a constant speed for the same trip, or even relatively longer periods of different constant speeds, considerable more gasoline will be used and emissions produced versus normal driving.
Ramping With Wind Present versus the No Wind Installed Condition
The change in ramping between intervals due to wind presence in the electricity system, which is change in net load minus load alone between intervals and can be positive, negative and no change. [1] Table 1 provides a summary of the ramping event activity.
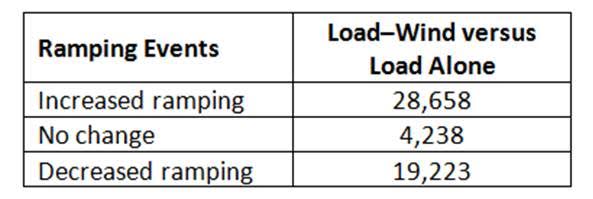
Table 1 – Ramping Increases/Decreases due to Wind Presence
Comments on Table 1:
- The presence of wind results in 49 per cent more increased ramping over decreased ramping.
- Remember that load ramping includes the predictable twice daily cycles, which is included in these measurements and so tends to overstate its impact. Inasmuch as wind can be forecast on the basis of periods of hours it has some of the same characteristics as load.
- Remember, for example, that both increased and decreased ramping includes events of changed ramping in both directions of the same size (up and down change). Down change is not decreased ramping and can be as problematic as up change.
The distribution of the number of ramping events by size is very important and this is provided in Table 2.
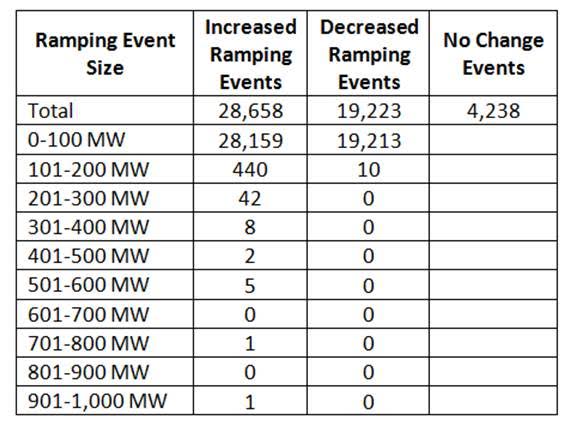
Table 2 – Ramping Events by Size in MW (January to June, 2015)
Comments on Table 2:
- The ramping events are measured at 5 minute periods, and this still likely masks some shorter term impacts.
- There are notably more of the larger sized events in the increased ramping category.
- A closer look at the increased ramping in the 1-100 MW range shows that about two-thirds fall in the 1-25 MW range and about 90 percent fall in the 1-50 MW range. This means there are about 2,800 events at 17-100 MW.
- Increased ramping events in the 100-500 MW range occur with notable frequency, almost three times daily on average. Not knowing when this is going to occur could increase the spinning reserve requirements by as much as one gas plant.
- In the 500-1,000 MW range there is more than one every month on average. Excluding periods of little or no wind this approaches two times per month on average. Again not knowing when these will occur represents the possible need for additional reserves of approximately the equivalent of one of the larger generation plants in many electricity systems.
- On average there are 1.6 increased ramping events in every 15-minute time interval over six months. As there are periods of no wind, this is understated. These are averages, and it is not known in advance when they will occur. So the apparent smoothness of the 15-minute versus the 5-minute measurement intervals in the sample shown in Figure 4 of Part I should not be taken as the best measure of the reliability of the 15-minute time interval to properly show the impact of wind on balancing requirements. Figure 1 shows considerable ramping increase activity within 15-minute intervals due to wind presence for the same sample period used in Part 1.
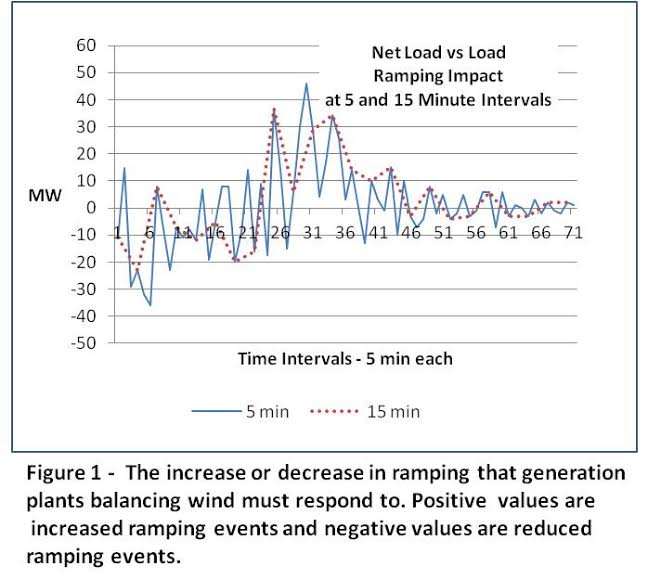
As can be seen there is considerable smoothing effect at 15-minute measuring periods versus 5-minute. Remember that positive values mean increases in ramping over load alone and negative values decreases, and what is shown is the size of ramping involved. Both include up and down changes of equal size, as discussed above.
A further complexity not addressed here is the impact of increased or decreased ramping relative to that of neighbouring intervals. For example, an increased level of ramping may not necessarily be as detrimental if previous and subsequent intervals also show about the same increased ramping. Similarly, a decreased ramping event in this case might be detrimental. Now take this complexity to the next level of up and down changes.
It is likely with wind installed that additional spinning reserve fossil fuel plants may be required to meet the larger number and frequency of increased ramping events, especially in short term time intervals. This is an example of possible increases in fuel consumption and associated emissions while providing little or no electricity at the time.
Conclusions
Wind increases the magnitude of the balancing activity by increasing the ramping over load alone with a notable number of large ‘outliers’. The dynamic impact of this can substantially increase the rate of fossil fuel consumption and emissions in fossil fuel plants in the net load balancing role over that claimed by any less rigorous analysis. Although a paper may claim that its analysis deals with this, it has not yet been adequately determined by anyone.
Understanding the impact of wind requires further very detailed analysis of ramping events on a short term basis. The analysis provided here raises even more questions, so there is still much to be accounted for to properly quantify the impact of wind on fossil fuel or emissions savings. Arguably the complexity involved defies analysis.
Part III tomorrow will complete the series with a discussion of other considerations affecting the analysis of fossil fuel consumption and emissions.
——————-
[1] These are calculated as the difference between the absolute values of load minus wind (L-W) and load (L). A simple example illustrates this. For a change between intervals in L-W of +2 MW and with an underlying change in L of -1 MW, the change in ramping relative to the previous level is not 3 MW but 1 MW.
ABS(W-L) – ABS(L) = ABS(2) – ABS(-1) = 2 – 1 = 1
This means the presence of wind has increased ramping by 1 MW over load alone.
Reversing these two values:
ABS(-1) – ABS (2) = 1 – 2 = -1
The negative result means the presence of wind has reduced ramping by 1 MW.
[…] I sets the stage with basic information as context for more detail in Part II tomorrow. Part III addresses the issues in (1) the published information available for analysis, and […]
[…] as that described for load and wind production measurement at this time scale, described here in that it misses a lot of activity even within 15 minutes, and therefore it will not be taken […]
There is a typo in the comments to Table 2 in the third point which reads:
A closer look at the increased ramping in the 1-100 MW range shows that about two-thirds fall in the 1-25 MW range and about 90 percent fall in the 1-50 MW range. This means there are about 2,800 events at 17-100 MW.
The last phrase should read, “This means there are about 2,800 events at 80-100 MW.
Darn. Did it again. Should be 50-100 MW range.
[…] increase the variability to which the rest of the electricity system must respond (see here, Tables 1 and […]