Evaluating Wind Impact (Part I — Basics)
By Kent Hawkins -- August 9, 2016“Analyses of wind impact on emissions do not take the impact of the highly variable and unreliable wind generation fully into account, especially in short term intervals, and can be discounted as not providing conclusive results.”
This three part series will illustrate the problems in properly evaluating the impact of unstable generation sources (wind and solar) in electricity systems. It will be seen that the complexity involved makes it virtually impossible to analyze all the necessary factors, and the use of sophisticated mathematics, especially statistical approaches, cannot compensate for this. Further complicating this, any analysis relying on published fuel consumption or emissions is made even more inconclusive because of the questionable nature of this information.
A basic problem is the erratic behaviour of wind in the short term (a few minutes or less) and unreliable in the longer term (hours and days). This is the same for solar. As a result they are not useful by themselves and must be coupled with reliable, dispatchable generation plants to mitigate this. So they cannot be put in the same category, or compared in any meaningful way, with reliable, dispatchable generation technologies, including costs, effect on emissions, and contribution to electricity supply and system reliability.
Part I sets the stage with basic information as context for more detail in Part II tomorrow. Part III addresses the issues in (1) the published information available for analysis, and (2) the use of sophisticated mathematics in an attempt to address some of the complexities involved.
In summary, analyses of wind impact on emissions do not take the impact of the highly variable and unreliable wind generation fully into account, especially in the short term intervals, and can be discounted as not providing conclusive results.
This series of posts is intended as a caution for those attempting to analyze wind impacts on electricity systems, especially those arriving at, or implying, conclusive results, and to assist readers in assessing them. There is no intent to suggest that existing analyses are somewhat accurate but can be made more precise. Regardless of their precision, I suggest they are not even close to being accurate.
Bonneville Power Administration Experience
The Bonneville Power Administration (BPA) provides generation and load information at 5 minute intervals for its balancing authority area in the U.S. Pacific Northwest by major fuel category and load. The information available for the first six months of 2015 is analyzed. Graphics are used for illustrative purposes and based only on January to March due to space limitations.
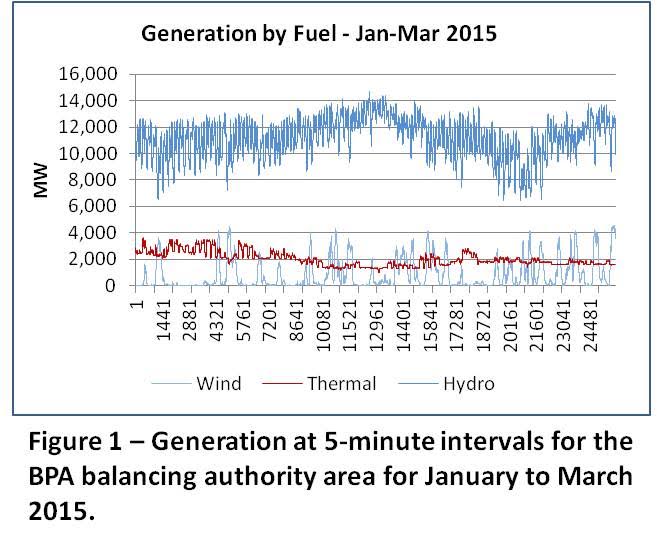
Figure 1 shows generation by the major fuels. As opposed to fuel consumption or emissions, reported electricity production information can be taken as reasonably reflecting reality.
Comments on Figure 1:
- The x-axis is the count of 5-minute intervals. Each division shown on the x-axis is approximately 5 days, and one day is 288 points.
- Firm regional resources are reported as: thermal 11 GW, nuclear 1 GW, and hydro 12 GW.[1]
- Wind’s longer term (hours and days) unreliable behaviour is illustrated by notable periods of little or no generation. On the other hand, hydro and thermal show their capability of providing a reliable base of supply and load variation following as needed.
- The average wind output for the 5-minute intervals over the six month period is 1.1 MW with a total wind capacity of 4.8 MW, yielding a capacity factor of only 23%. For this period, wind penetration in energy terms is 9% for domestic load plus net exports. For domestic load alone it is 17%, which is probably not supportable without curtailment or export, both of which occur.
- The capacity factor for thermal is also low, but this is by operator choice, for example, for use in short term load following and other reserve requirements.
- The BPA has considerable hydro resources, and wind impact on fossil fuel plants will be less than in almost all other jurisdictions, but the generation data the BPA provides is useful in illustrating the issues involved. Reference may be made to the impact on fossil fuel plants as if they were present to a greater degree, and this will be applicable to other jurisdictions. As already indicated the purpose of this series of posts is to show only the complexity of analysis required.
- The large hydro variations are discussed below.
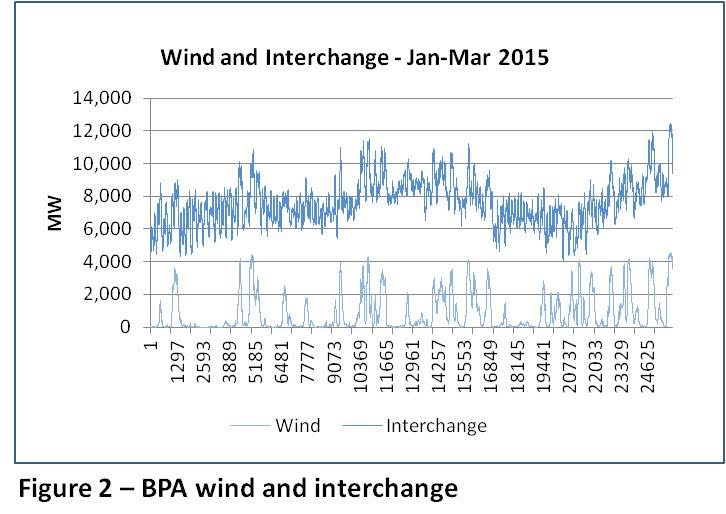
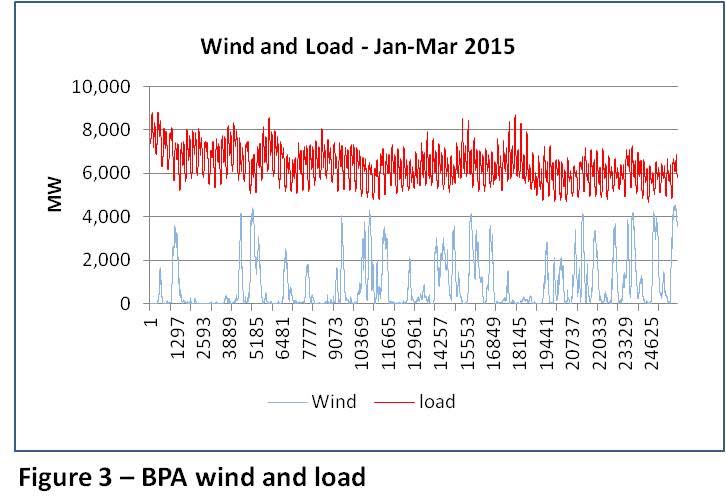
Figures 2 and 3 show wind and the two major demand elements, load and interchange for the period January to March, 2015. Interchange is net exports, and in BPA’s case is very large compared to most jurisdictions.
Comments on Figures 2 and 3:
- Load variations are largely due to the twice daily rise to morning and afternoon peaks.
- Because of the fairly regular pattern of peaks in the interchange, it appears the jurisdiction(s) receiving the exported electricity (largely California) may be using this to meet some of the secondary and peaking demand events on a twice daily basis.
- In general, hydro alone shows this steady oscillating pattern that over weeks follows the interchange levels. When wind increases, with what looks like spikes in the charts but are actually increases over a few days, the interchange departs from this pattern with similar spikes. So it appears high levels of wind are exported.
The Importance of Very Short Time Intervals
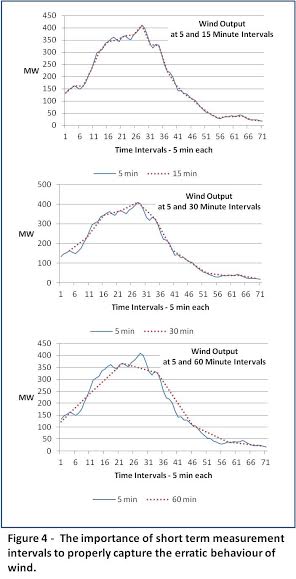
Many analyses rely on published time intervals that are too long to capture wind short-term fluctuations. The sample in Figure 4 makes a start at illustrating the shortcomings of this with wind production (points 8,715-8,786 on Figure 1) for about 6 hours at 5-minute measurement intervals versus 15, 30 and 60 minute intervals.
Comments on Figure 4:
- In this sample the 15-minute measurement interval appears to follow the 5-minute interval fairly well. It does best when wind is steadily rising or falling. When the rise or fall is interrupted (points 7, 33 and 37) there are about 15-20 MW deviations. When wind is varying at some reasonably constant level (from about points 16-20), notably frequent deviations up to about 20 MW occur. However, more detailed analysis of wind’s impact in Part II will show two deviations (mainly in the range up to 100 MW) within each 15-minute interval on average when wind is active over the full 6 months.
- The 30 and 60 measurement interval charts show more frequent periods of deviation up to about 40-60 MW.
- The erratic behaviour of wind is not fully captured even at 5 minute intervals.
Range of Variation of Net Load
This is another basic measure for wind and load variations, which have similar short term erratic behaviour. The combined effect of the short term erratic behaviour of both must be balanced by other generation plants. As wind is generation, the net load is obtained by subtracting it. This is the first step away from simply looking at wind generation.
Combining two ‘random’ series of events in real time, results in another random series with a larger variation than each alone. In most electricity systems this would chiefly be domestic load and wind. However in the case of BPA, another major ‘random’ series of events is the notably large interchange component, which roughly equals the domestic load component, and increases the complexity of any analysis for BPA specifically. However, in almost all other cases interchange will not be as large. However, useful conclusions can be made here about the effect of the combination of wind and load alone that are generally applicable.
To begin, Table 1 shows the ranges for these components and the net effect of the combination.
Table 1 – Ranges in Variability for Load, Wind, and Load minus Wind
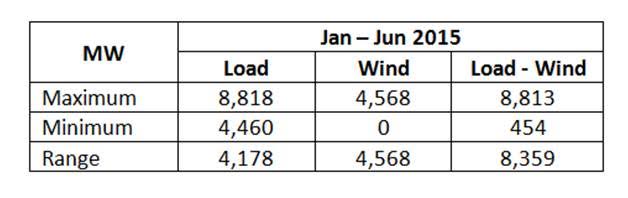
Comments on Table 1:
- The range in variation that the balancing plants have to accommodate is about double both load and wind individually. Part II will show that this is important in assessing wind impact.
- Generation levels shown are assumed to be aggregated at the total system level for balancing purposes. In many systems, balancing occurs on a more regional basis. This is especially important because of wind’s potentially greater impact at the regional level. This is an example of the further complexity of analysis required.
Conclusions
Shore term measurement intervals of a few minutes or less are necessary to properly assess wind impact. The combination of load and wind, or net load, is what must be balanced by other generation plants and is more important in assessing wind impact than wind generation alone.
Analyses, including this series, typically assume wind balancing is at the highest level in a jurisdiction, but balancing is likely done regionally depending on grid topography, which means any smoothing over distance likely understates wind impact.
So far, we have seen some of the basic issues in properly analysing wind performance, but these are only ‘the tip of the iceberg’.
——————–
[1] BPA facts (2014). http://www.bpa.gov/news/pubs/GeneralPublications/gi-BPA-Facts.pdf . This sum of the reported firm capacity is about 24 GW. A typical average annual production would be about 50% of this, which is roughly the reported average level for the total BPA load, including both domestic load and interchange. At the maximum daily peak load, 100 per cent of the capacity (including reserves) is required. The BPA also reports 2 GW of wind as firm, but with a total capacity of about 5 GW this is so questionable that it has been ignored.
[…] I yesterday in this three-part series examined wind intermittency/integration basics. Part II today focuses on […]
[…] I on Tuesday and Part II yesterday focussed on the greater range of variations and the increased ramping levels […]
Interesting series, thanks. I was recently speaking with a newly retired system operator for one of the mainstem Columbia dams and he related that since the forced incorporation of wind generation into the BPA system they have experienced severe wear on the power generators due to the variation in wind generation. The power generation turbines in these large dams are designed for long term, steady operation and the stresses upon these turbines as they have to speed up and slow down to balance the variable wind load takes a heavy toll on the system that was designed to last for decades.
I doubt that these costs are calculated into the increased costs associated with wind generation but they are real.
In the fourth point under ‘Comments on Figure 1’, I inadvertently wrote 1.1 MW and 4.8 MW for wind. As Figure 1 clearly shows these should be 1.1 GW and 4.8 GW.
From the above by Steve Walser: “The power generation turbines in these large dams are designed for long term, steady operation and the stresses upon these turbines as they have to speed up and slow down to balance the variable wind load takes a heavy toll on the system that was designed to last for decades.”
Those turbines are huge the rotors having large mass. The water moving through the turbines is massive. How do they “speed them up and slow them down” fast enough to keep up with the variability of wind? And another question…do they actually change the turbines’ rotational velocity? It seems to me that the rotational velocity must remain the same (within tight limits) to keep generating 60 Hz…or the given frequency. I think the turbine rotors must remain at a constant rotational velocity and the amount of water hitting them must be changed, requiring speeding up and slowing down that water flow…or varying the water pressure, somehow. I think the inefficiencies of this system derives from trying to make a machine designed for one thing try to do something it’s not designed to do. Water has to be burbling past those turbines, or is being shunted away from them in order to rapidly vary the output of the hydro. I’m still researching it. What I hear so far is that the one gas plant operator I spoke with hates wind b/c of what it forces his turbines to do to follow the wind. But of all this, I’m interested in just how exactly hydro is supposed to follow wind….the details. I’m thinking either nobody knows (because they’re deliberately not looking) or it’s such a mess nobody wants to admit it.
Paul
Paul, thank you for this. Your comments and follow up are very much appreciated.