Peeling Away the Onion of Denmark Wind (Part I)
By Kent Hawkins -- October 26, 2010[Editor’s note: This series is an extensive technical analysis of wind electricity in Denmark. The intent is to develop: (1) plausible conclusions without resorting to extensive mathematics (except that provided by others) , and (2) a framework within which to evaluate other claims of emissions relating to wind backup from fossil plants.]
According to wind proponents, Denmark is a model of wind energy use for electricity generation to be emulated. It is claimed or suggested that:
- Denmark gets about 20% of its electricity from wind. [Note: This number is generation, not usage, which is a crucial distinction with negative implications for the wind lobby’s argument.]
- Reduction in CO2 emissions is due in large part to increased wind electricity production.
These conclusions are superficial at best and invalid at worse. The analysis required to show this, however, is extensive and technical because the Denmark power market is very unique and wholly unlike the market in the U.S. or the UK.
A Note on Sources
Recently the American Wind Energy Association (AWEA) has made claims about Denmark, based on data from the U.S. Department of Energy (DOE). This is at least one step removed from the source for most of the information in this series, the Danish Energy Agency (DEA). Its report 2008 Energy Statistics, and associated Excel worksheet tables, is one of the best sources of comprehensive information on the Denmark electricity situation.
There is another source with very detailed information, Energinet.dk, which is the Danish national transmission system operator for electricity and gas. It has been used for some more extensive mathematical analyses that are referenced here, for example Bach. As will be seen, even these have limitations because of the unique and complex nature of the Denmark electricity system.
As a result, this analysis purposely based more on logic than precise mathematical treatments, but building on the mathematical work of others. The limitations in both cases are the complexities, which will be explained, but both approaches provide insights into the Denmark case. In the final analysis, all available evaluations of the wind-generated electricity (this will frequently be referred to as just “wind”) realities in Denmark are speculative, but some more plausible than others, and readers are left with having to draw their own conclusions.
Claims based on a quick reference to a few selected statistics should be seriously questioned, and this series provides a context within which all claims can be evaluated.
Another Danish source that is used is the Danish Energy Association’s reports, especially for detailed time series of annual electricity imports/exports. Unfortunately, it seems to have stopped publishing this online in favour of an annual report, with limited, recent information, the 2008 “Danish Electricity Supply ’08 – Statistical Survey” available here. This is an industry association and is not to be confused with the DEA. Other sources are used as indicated.
Size of Related Electricity Systems
This is an important factor. Denmark’s electricity system is tiny compared to its electricity trading partners, Norway, Sweden, and Germany. Figure 1 illustrates this. Note the large hydro-generated electricity in Norway and Sweden, which combined is about 30 times the Danish wind-generated electricity production. This combination is almost entirely hydro, and from Denmark’s point of view can be viewed as a single entity.
As an interesting aside, note the challenge that wind faces in replacing fossil fuel and nuclear in Germany, which provides insight into why that country is turning away from the previous government’s commitment to eliminate nuclear plants by 2021. Also note the nuclear component for Sweden.
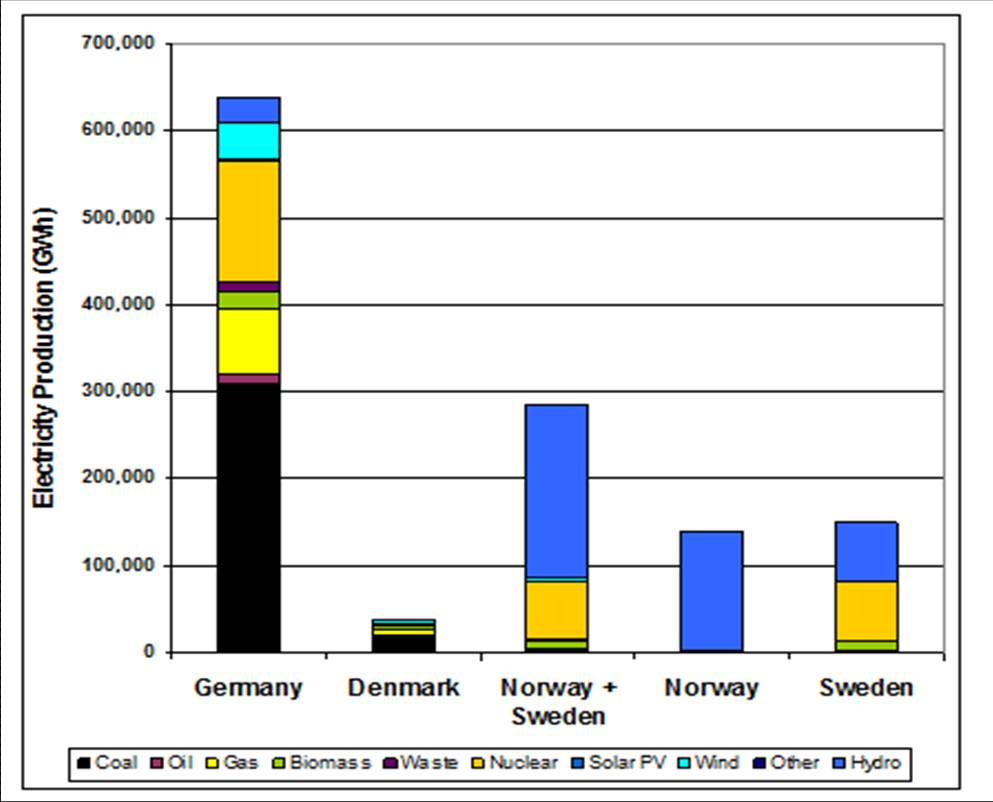
Figure 1 – Relative sizes of electricity production of Denmark and its major electricity trading partners in 2007. Source: International Energy Agency.[1]
In effect, Denmark is a conduit connecting the hydro resources in Norway/Sweden to Germany and other parts of north-central Europe. Interconnectors have been put in place to facilitate this as well as a northward flow in dry years. The presence of these connections, with capabilities that can handle the wind production in question, has allowed Denmark’s extensive wind implementation, as it piggy-backs on them to export the high wind levels, as will be shown.
By the above measures, Denmark represents a unique situation, which cannot easily be reproduced elsewhere. Otherwise it would not be able to sustain the level of wind penetration that has been implemented. For a number of years Denmark has had a significant share of world markets for wind turbines and associated technology and has built an industry dependent on this. There are consequences to this short-lived industrial strategy, which relies on significant government subsidies over time, due to the inevitable competition from very large players, for example, China.
After a hiatus in wind implementation within Denmark since 2003, including offshore, it has recently re-committed to substantial offshore implementations, which has to be viewed in the light of this competition as well as questionable European Union energy policies. For comments on these policies, see the Charlemagne article in the January19, 2008, edition of the Economist and an analysis by Helm.
The lesson for other jurisdictions contemplating the same, or greater, wind penetration as Denmark is there must be other neighbouring jurisdictions willing and able to absorb the excess. Alternatively, a jurisdiction with high wind penetration, and no export possibility especially to jurisdictions with larger electricity systems, ideally with large impounded hydro-generated electricity, must resort to wind curtailment. This can be seen, for example, in Germany and Texas.
Electricity Generation and Consumption within Denmark
Before proceeding, and to provide context, the following reviews a number of factors important to understanding the Denmark electricity situation. Figure 2 shows the domestic electricity generation by fuel type for Denmark. This series starts at 1994 because that is the earliest that the DEA provides detailed breakdowns. This figure does not illustrate domestic consumption because net imports are not included. Domestic consumption has shown a steady gain over this period as will be shown below.
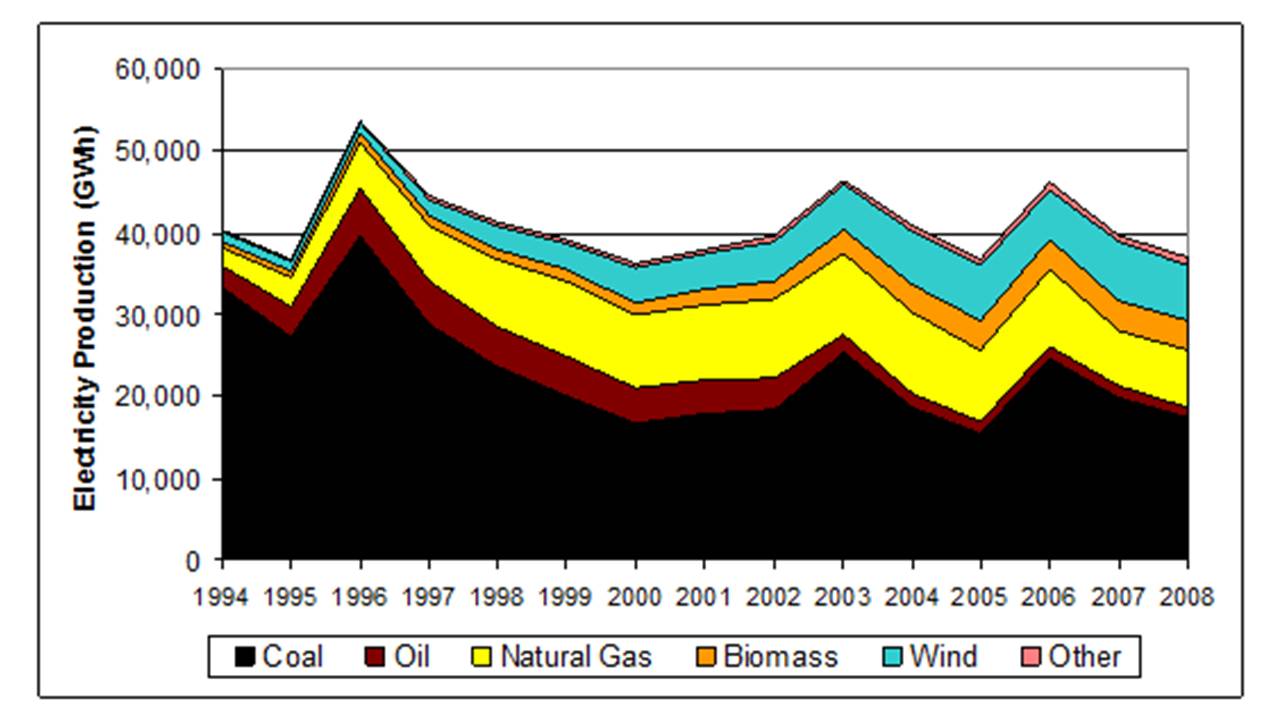
Figure 2 – Domestic electricity generation by fuel for Denmark before consideration of net imports.
It looks like Denmark has substantially reduced its reliance on coal for its electricity consumption, but this is not a valid conclusion. To see domestic consumption, net exports must be considered. This is provided in Figure 3, which is a bit confusing but can be explained.
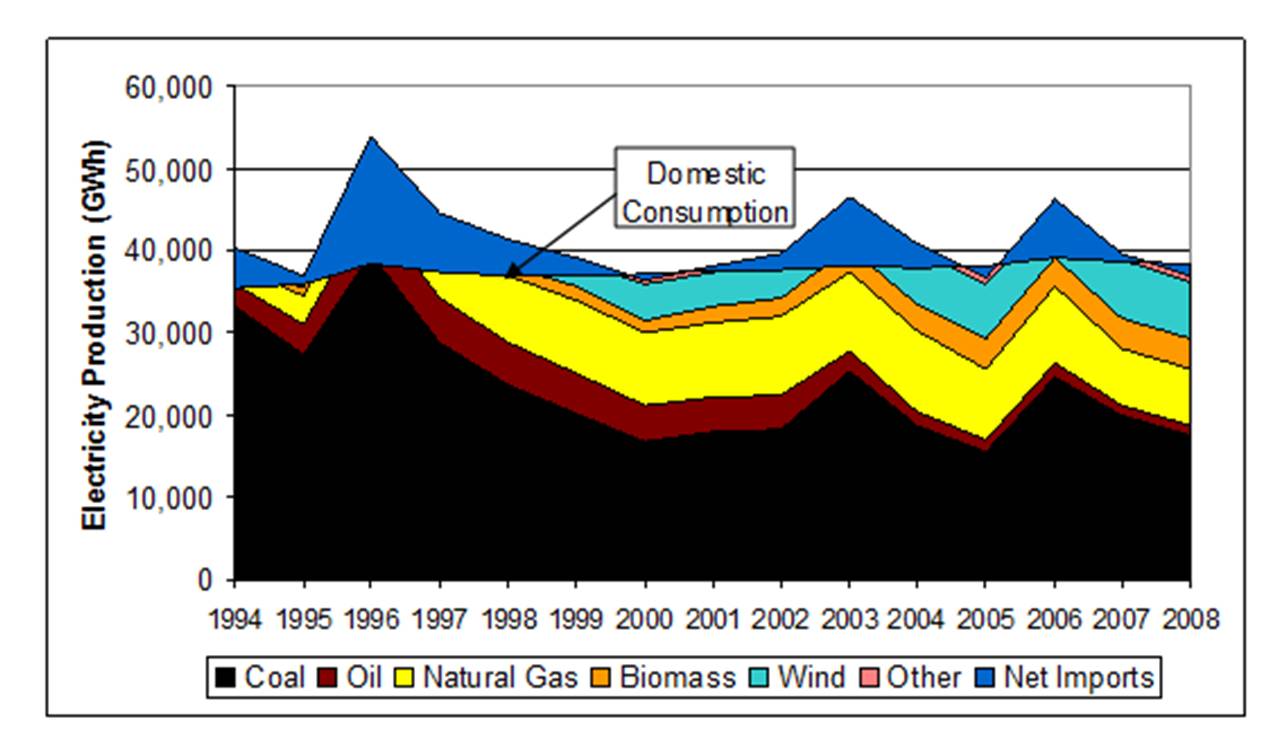
Figure 3 – Domestic electricity generation for Denmark including net imports. The upper line corresponds to the total domestic electricity generation shown in Figure 4 and domestic consumption is the more steady line, which includes net imports.
To aid in understanding Figure 5, the years 1996, 2003 and 2006 show dramatic net exports (negative net imports) and the domestic consumption line is lower. On the other hand, the years 2000, 2005 and 2008 show relatively small net imports to meet domestic consumption. Domestic consumption here is at the generation level, that is, the sum of end use, internal use within the electricity sector and losses. What is exported is not the top level of fuel type, as shown in Figure 3, but can be some combination of fuel types.
Note that the higher level of fossil-fuel generated electricity leading up to 1996 was due to significant net exports, not internal consumption. So reductions in coal for domestic electricity consumption have not been as dramatic as Figure 1 shows, because in 1996 exports were dominated by fossil-fuel electricity production.
The spikes in production and net exports in 2003 and 2006 occurred in dry years in the Nordic region and water reservoirs were less full. On the surface, just looking at net exports, it looks like fossil-fuel production increases could account for this. There are reasons to support the view that the increased wind production was substantially exported in these years, which will be discussed in detail later.
Denmark’s Use of Combined Heat and Power (CHP)
Another important characteristic is the nature of the plants supplying Danish electricity. Figure 4 shows the electricity production by type of producer for Denmark, which is predominantly CHP. As output for combined heat and power tends to be determined by demand for heat versus electricity, this indicates their unsuitability for wind balancing. However, the large-scale CHP units production is divided into two components: (1) combined electricity and heat production and (2) electricity production. The latter typically represents slightly more than 50% of the total.
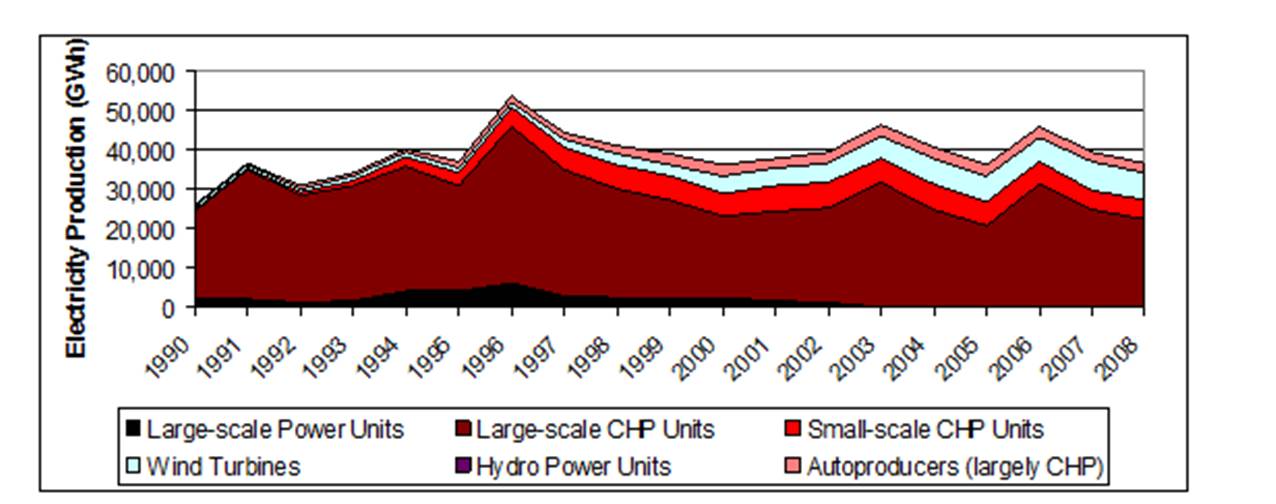
Figure 4 – Electricity production in Denmark by type of producer. Note that almost all production
is from Combined Heat and Power (CHP) units, which will be governed more by heat demand than
electricity demand.
Are Danish fossil fuel plants being used to balance wind production that is not exported? The CHP component for electricity production only, as opposed to combined electricity and heat, is about 9,000-12,000 GWh in the period 2004-2007. Wind production in this period is a total of 6,000-7,000 GWh. If the CHP component for electricity production only was used for wind balancing it would cover 3,000-4,000 GWh of wind, or about half of the total, given the need to provide about 3 times the wind production to cover wind variation from 0-100% of capacity on a continuous basis.
This suggests that some of the Danish fossil fuel plants could be used to balance wind. The alternatives are the use of imported electricity for this purpose, most likely hydro from Norway/Sweden, or a combination of the two. To provide further insight into this, Figure 5 shows the efficiencies calculated from DEA information for the predominant fossil fuel plant types – coal and natural gas.
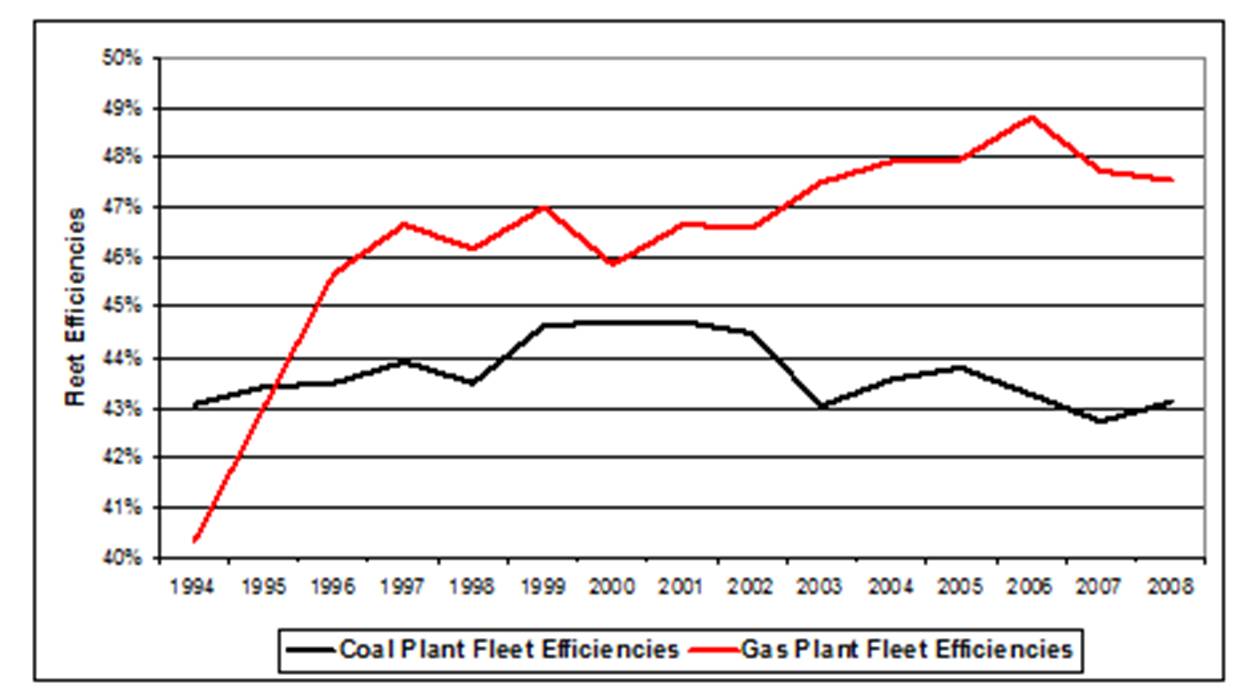
Figure 5 – Denmark fossil fuel plant fleet efficiencies calculated from DEA information.
Both plant types show relatively high levels of efficiency, with the gas plant fleet showing an improving trend, likely due to newer plant installations, and coal a decreasing trend since about 2002. There are a number of reasons for changes in plant efficiencies year-over-year and over longer periods, such as deterioration with age, offset by effective maintenance and upgrades; replacement of plants with more efficient types; and parasitic loads of pollution reduction technologies, but Figure 5 raises at least two questions:
- Are the fleet efficiencies too high to reflect use in wind balancing?
- Does the declining coal plant fleet efficiency indicate some wind balancing impact?
Part IV will look at CO2 emissions in more detail, but the calculated level of CO2 emissions from the DEA report in 2008 for coal plants is about 0.79 tonnes/MWh, and gas plants about 0.43 tonnes/MWh, without any significant change since the mid-1990’s. Both of these reflect plants under normal operating conditions, that is, without continuous cycling required in a wind balancing role. There are some subtleties to be explained in the intervening years. In particular note the coal plant efficiency reductions in 2003 and 2006/7, which will be returned to later. Fossil-fuel plant efficiency levels published by the DEA on page 37 are lower, but are based on all fossil fuel plants and adjusted fuel consumptions, which are not appropriate reference points, as will be discussed further in Part IV.
The message in this post is that Denmark is a very unique situation. It is not one that can be reproduced virtually anywhere else. Further, as will be shown, Denmark does not enjoy, and should not be credited with, the benefits often claimed for it.
The next step, which is provided in Part II, is a lower level of analysis of exports and imports with Denmark’s electricity trading partners. It will explain the impact of normal, wet and dry years in the Nordic region on electricity flows between Denmark, Norway, Sweden and Germany. All of this is necessary to any useful understanding and analysis of the export of Danish wind electricity and CO2 emissions savings that will be provided in Parts III and IV.
For ease of navigation, the other posts in this series are:
Part I – Introduction (this post)
Part II – Details of Exports and Imports
Part III – Wind Electricity Used in Denmark
Part IV – CO2 Emissions
Endnotes
[1] International Energy Agency (IEA) (2007) http://www.iea.org/stats/prodresult.asp?PRODUCT=Electricity/Heat
[…] Peeling Away the Onion of Denmark Wind (Part I) – MasterResource […]
[…] Peeling Away the Onion of Denmark Wind (Part I) http://www.masterresource.org/2010/10/denmark-part-i-intro/ […]
The State of Washington with a population about equal to Denmark’s could probably match the Danish proportion of wind generated electricity in production while wasting little given our substantial hydro and the even larger hydro in British Columbia with which we interconnect.
Levis Kochin
My point that the Denmark situation cannot be “reproduced virtually anywhere else” is not disproved by your general observations. An important consideration in Denmark’s case is its relative size (see Figure 1) and the grid connections between Norway/Sweden and Germany (though Denmark).
British Columbia electricity generation is about 43,000-54,000 GWh of electricity, of which hydro represents about 90%, that is 36,000-45,000 GWh. Washington produces about 78,000 GWh of hydro-generated electricity, so BC hydro is not greater than Washington’s as you claim.
The presence of hydro within a jurisdiction does not necessarily mean it is available for wind balancing. An example is Ontario, which has considerable hydro, but is run-of-river hydro (Niagara). Ontario is building significant new gas generation plants including OCGT (aka SCGT or CT) for wind balancing and will not enjoy emissions reductions as a result (except that provided by the greater use of gas by itself).
Run-of-river means there is no storage capability as in the case of impounded hydro, like Washington and BC. However impounded hydro has to be analyzed carefully to fully understand the capabilities that are available. For example seasonal and weather considerations enter into the equation. For a sample of the way this should be viewed see http://www.masterresource.org/2010/01/how-many-households-can-a-large-wind-project-serve-lessons-from-texas-and-the-uk-part-1-of-2/ (especially Part II at http://www.masterresource.org/2010/01/how-many-households-can-a-large-wind-project-serve-lessons-from-texas-and-the-uk-part-2-of-2/
My point is that it is important for a jurisdiction contemplating wind production on the scale of Denmark to be able to export most of it to another jurisdiction with a larger electricity system, sufficiently sized grid connections (this may exist between Washington and BC) and ideally with very large impounded hydro-electricity generation in relation. For Washington to rival Denmark it would have to produce over 20,000 GWh of wind-generated electricity, which would swamp BC and would depend upon most of Washington’s hydro to act in a wind balancing role. See http://www.masterresource.org/2009/11/wind-integration-incremental-emissions-from-back-up-generation-cycling-part-ii/ for an explanation of this.
This coupled with the interesting consideration that wind generation tends to depress electricity market prices (not the price paid by the consumer in the jurisdiction that has implemented the wind plants) can make import by another jurisdiction attractive (eg Denmark). The net of this, as I show in later posts of this series, is that the jurisdiction with the wind would be better off, financially and operationally, not implementing the wind plants, whose contribution to emissions reduction is minimal.
In summary, you have a lot of work to do to support your supposition.
[…] Peeling Away the Onion of Denmark Wind (Part I) […]
Your analysis of Denmark’s condition is quite complete and corresponds with my understanding of it.
The exporting of Danish power to Norway and Sweden is not profitable for Denmark.
Denmak’s policies led to it having one of the highest residential rates in Europe, whereas France has one of the lowest. The industrial rate is kept low for international competitive reasons.
Denmark justifies some of its actions as being of benefit to Vestas, a national champion, as Nokia, currently in trouble, is a Finland national champion.
Denmark is trying to use wind power to heat the thermal loops of its CHP plants.
There is useful information about Denmark’s wind power on the Nordel website. I used it a few years ago and came to similar conclusions. The Danish situation is unique because of the large adjacent hydro plants, and with spare capacity to dedicate to providing help to wind power. There is no economic incentive for hydro to act as support for wind power because both wind and water are “free”. In dry years, wind can save water. However, if saving water were a key issue, then nuclear is a better solution.
I am looking forward to reading the next three sections. Keep up the good work.
H. Douglas Lightfoot
website: thelightfootinstitute.ca
All of the above refers to Energy, not Power. Anticyclones giving light winds often engulf the whole of Europe and beyond. They are slow moving, and typically give the UK light winds, when our wind fleet generates less than 25% of installed Power capacity for about a week. We get around six like that every year, often longer, and lots one or two days long between adjacent depressions.
I happened to note some figures on 27th Jan 2009, during one which lasted almost 3 weeks. On that day, the UK winds (Met Office) were good for about 3%, Denmark’s 0.4%, http://www.emd.dk/el , and Germany (REISI) 0.0043% at 3pm their time.
Waves are generated by friction between wind and water ……
If we have to carry the capital charges of reliable generation to cover these gaps, plus enhanced running costs – poor load factor, why not build nuclear? The UK minimum summer overnight demand circa 25GW could fully load them for 8760hrs/annum. Further, we would charge batteries and hydro reservoirs with CO2-free electricity, instead of burning extra coal as we do now.
Bill Hyde, DFH, C Eng, FIET
Lane End House, Teston Road, Offham, Kent, ME19 5PD, 01732 843134
Monday, 07 November 2011
[…] http://www.masterresource.org/false-claims/denmark-part-i-intro/ […]
[…] For more detail see the MasterResource series “Peeling Away the Onion of Denmark Wind” at http://www.masterresource.org/false-claims/denmark-part-i-intro/ […]
I have read several good stuff here. Definitely price bookmarking for revisiting.
I surprise how so much effort you set to make such a fantastic informative site.
https://periodicos.ufersa.edu.br/revistas/index.php/caatinga/comment/view/5768/0/16
bInAryoPtinSSverGe.com