Estimating Costs of Deep Decarbonization (California and beyond)
By Mark Krebs -- May 22, 2018“The term ‘buyer beware’ might provide an appropriate warning; but that term implies the buyer has a choice. Therefore, we will just leave it ‘beware’.”
The purpose of this document is to provide a rough estimate for some of the economic costs of moving American consumers away from the direct use of fossil fuels per the objective of “deep decarbonization” and show the math involved. First, we need to define what “deep decarbonization” and “electrification” are. “Deep Decarbonization” is the term-of-art for climate stabilization through the decarbonization of the World’s energy systems. Replacing consumers direct consumption of natural gas and gasoline, along with other forms of fossil fuels, and on to renewable-dominated electricity, is the means of achieving this global objective.
The concept officially started with a June 2015 G-7 goal “to end their dependence on fossil fuels.” In December 2015, the United Nations Climate Change Conference (COP21) adopted this goal. In November 2016, “Deep Decarbonization” was put forth by President Obama as official U.S. policy. Excerpt:
With a clean electricity system comes opportunities to reduce fossil fuel usage in these sectors: for example, electric vehicles displace petroleum use and electric heat pumps avoid the use of natural gas and oil for space and water heating in buildings.
On February 14, 2018, the Natural Resources Defense Council and the Edison Electric Institute entered into a pact to promote “deep decarbonization” through “beneficial electrification.” The basis of this pact for weaning (or forcing) consumers off “dirty” fossil fuel consumption and on to “clean” renewables needs a serious reality check before “betting the farm” on it; like California seems intent on doing (among other places). Why? Deep decarbonization through electrification is astoundingly expensive.
Additionally, in many climates, there are cold weather emergencies that routinely kill people. This pact would more than likely compound such problems. At a minimum, the forced conversion from the direct use of natural gas to electricity will impose massive additional costs upon energy consumers.
Technical Details
According to EIA, January 1, 2018 set a new U.S. record for natural gas consumption of 150.7 BCF/day. (BCF = Billion Cubic Feet.) Roughly half of that (i.e., 75 BCF/day) was residential/commercial direct use. To estimate peak hourly BCF, divide 75 BCF/day by 20 (an industry rule-of-thumb). So: 75/20 = 3.75 BCF/hour (3,750,000,000 Btu/hour).
That’s in lower heating value. The first step is to convert that to higher heating value (HHV) by multiplying it by 1.037, which equals 3,888,750,000 Btu/hour. Assuming the conversion factor of 3,412 Btu/kWh (at 100% efficiency), that equals 1,139,727 kWh/hour or 1,140 GWh/hour which equals 1,140 GW of peak hourly electric generation capacity to replace these natural gas direct consumption loads.
Converting fossil Btu’s into electricity isn’t 100% efficient. It’s only about 33% to 50% efficient. And neither is getting electricity from the power plant to the consumer 100% efficient. Additionally, it is standard practice to provide some extra generation capacity in reserve to insure reliability. At a minimum, add another 15% for reserve capacity and line losses to 1,140GW. That’s 1,311 GW in total.
Economics
According to the Energy Information Administration (EIA), “At the end of 2017, the United States had about 1,084,783 MW.” Subsequently, adding 1,311 GW more than doubles the present U.S. installed electric generation capacity.
According to a study from the University of Texas at Austin titled “The old, dirty, creaky US electric grid would cost $5 trillion to replace,” the present system is in need of a major overhaul. And that cost is estimated at $5 Trillion for an up-to-date but basic system. So, lets also call it $5 trillion (conservatively) for non-exotic capacity to replace just the residential/commercial direct use of natural gas. Note: This is without overhauling the existing “old, dirty, creaky” (carbon-intensive) electrical system.
As portrayed by the following graph, according to the latest EPA “Inventory of U.S. Greenhouse Gas Emissions and Sinks,” commercial and residential greenhouse gas emissions were only 11 percent of the total in 2016:
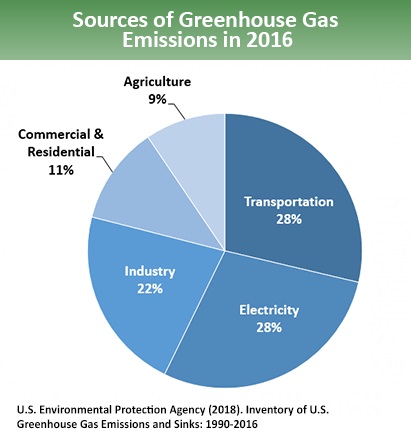
As shown above, electricity generation and transportation are the major sources of greenhouse gas emissions in this country. This observation gives rise to some interesting questions such as:
- Why start deep decarbonizing residential and commercial natural gas consumption first?
- How many Trillions more will deep decarbonization cost for the remaining 89 percent?
For question 1, arguably at least, putting in wind and solar (rather than coal and gas) is starting to decarbonize the electric grid. However, intermittent wind and solar need back-up (which is usually gas). Moreover, nearly all reduced carbon emissions for the grid is from switching from coal to gas; not from coal and/or gas to renewables.
Electric vehicles are also being promoted based on reduced carbon in the transportation sector. However, this is really a transfer of carbon emissions from transportation to electricity. How much net carbon is ultimately reduced is a function of the future electrical generation mix and the economics thereof.
For question 2, we haven’t estimated the total cost of deep decarbonization yet; but obviously, $5 Trillion is only the tip of the iceberg. Furthermore, these costs estimates are for just for capital expenditures. Fuel and O&M should also be factored-in. To remain conservative, we are not including these costs in this analysis now.
These costs are likely to be primarily recovered by electric utilities through a combination of massive increases in electricity usage and tariff (rate) increases. But advocates for deep decarbonization in the U.S. claim that overall utility bill increases will be manageable, as portrayed by the following graphic:
Figure 7. Average Household Spending for Energy Goods and Services, 2050 Mixed Case
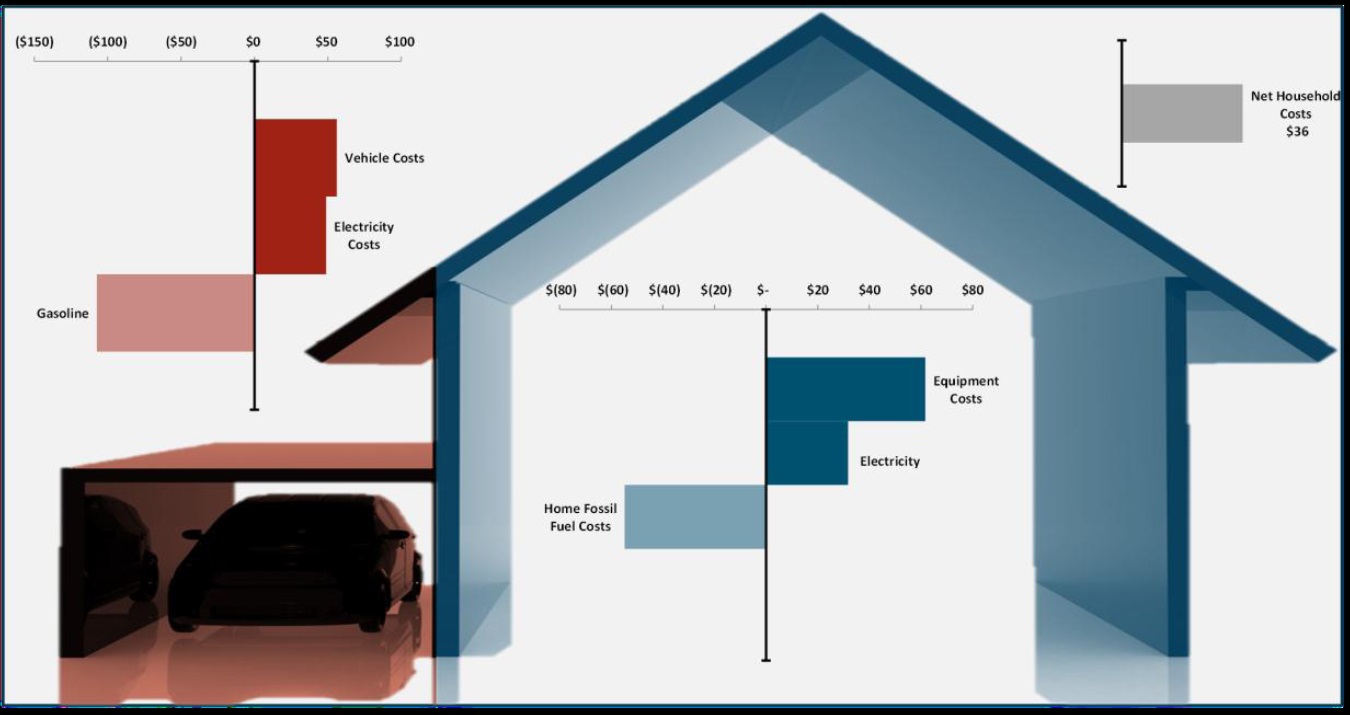
Source: Policy Implications of Deep Decarbonization in the United States
Consumer-side of the Meter: Additional Costs
So far, we’ve only addressed cost increases associated with adding electricity infrastructure (on the utility side of the meter). On the consumer sides of the meter are more costs. According to a recent study funded by the California Building Industry Association (CBIA) titled “Cost of Residential Electrification,” key findings included the following:
- Homeowners would need to pay roughly $2,600 for the purchase and installation of new electric appliances.
- Many homes are not wired to handle the electric load from having all-electric stoves, space heaters, and water heaters in addition to their usual electric appliances. Homeowners would need to pay roughly $4,600 to upgrade their wiring and electric panel.
- The cost to upgrade wiring and electrical panels plus the cost of purchasing new electric appliances is more than $7,200 per home.
In 2017, there were 126.22 million households in the United States. At $7,200 per household, this equates to $0.9 Trillion. Assuming an equal amount of expenses for converting the commercial sector, call it $1.8 Trillion for now.
Beyond these costs are stranded asset costs for gas utilities and miscellaneous consumer costs such as:
- Abandonment costs of distribution assets and other stranded asset-related costs
- Gas utility stock value and market valuation declines.
- Higher gas rates as fewer consumers are available to pay system fixed costs as volumes decline (a.k.a., the “utility death spiral”).
Preliminary Total Cost Indicators
We don’t have a comprehensive estimate of what “deep decarbonization” might cost in total yet. But we’re working on it. A planned follow-up spreadsheet tool will allow for user-defined estimating and “what-if” analyses of such details. We think this should take about 6 months. We will keep you posted.
For the interim, we have this: In 2017, the U.S. population was 325.7 million. Therefore, for every $5 Trillion, the cost would be $15,352 per person ($5,000,000,000,000 / 325,700,000 people). We believe we are conservatively looking at a total cost of deep decarbonization in the U. S. that is several multiples (3 or more) of $15,352 per person. In terms of adverse economic impacts upon American households, the total costs of deep decarbonization through electrification likely exceeds $100,000.
In an article dated May 15th, 2018, by Bret Lane (President & CEO for Southern California Gas Co.) titled Californians Deserve Balanced Climate Policies That People Can Actually Afford, it stated:
A recent Black and Veatch analysis showed 100 percent renewable electricity could cost California $3 trillion and require 900 square miles of solar panels and another 900 square miles of depletable and unrenewable battery storage.
In 2017, California had a population of 39.54 million; representing about 12% of the total U. S. population., California’s $3 Trillion estimate for all renewables equals $76,142 per person. Therefore, $76,142 per person times 325.7 million equals $24.8 Trillion.
Note: Even $24.8 Trillion might not be a worst-case scenario. This is because cold weather emergencies, such as “polar vortexes” and/or “bomb cyclones,” are limited within temperate California. Replacing such heating peak loads solely with electricity (especially renewable electricity) would drive costs considerably higher.
Summary & Conclusions
In closing, the term “buyer beware” might provide an appropriate warning; but that term implies the buyer has a choice. Therefore, we will just leave it “beware.”
Wow, $24 trillion for decarbonizing California makes $400 billion annually for single payer healthcare in the state (double the current state budget) almost seem manageable.
Sean,
The $24 trillion estimate is for the entire US, not just CA. My personal estimate is closer to $30 trillion for the US; and, approximately $100-150 trillion globally.
A $30 trillion investment would require an annual return of ratebase of ~$3 trillion, at typical electric utility allowable rates of return. Also, the typical depreciation period of 40 years for utility assets appears to be unrealistic for solar and wind assets, so depreciation costs would be significantly higher.
Don’t forget that the UNFCCC envisions the US funding ~25% of the investments required in the developing countries, which would be hardpressed to fund the required returns on investment.
I changed the title to reflect this is a national estimate.
What’s a few Trillion among friends, right Ed? BTW: great reminder about UN funding sources for all of this.
Sean: sorry for any confusion caused by the title. California data is just a source of information for reality checking what national totals might look like. That said, we envision the main deliverable of this project will allow the user to select individual states and variables therein.
I took a few shortcuts showing some of my math. Fortunately, Jim Clarkson sent me an email that shows this part with more clarity. Here it is in its entirety:
Pipeline natural gas has about 1020 to 1040 Btus per cubic foot. An MCF is not equal to a MMBTU but more like 1,030,000 Btus. The Btu content of natural gas varies due to the amount of higher hydrocarbons like propane and butane left in the gas steam during processing. Sometimes gas can have 1037 Btu per cu ft.
The difference between high heat value and low heat value for natural gas is about 10%. The combustion of high hydrogen gas creates water in the form of vapor. The heat within this vapor can only be captured by a condensing heat exchanger.
Just one old gas man trying to help another.
[…] [6] Estimating Costs of Deep Decarbonization (California and beyond) https://www.masterresource.org/deep-decarbonization/cost-estimate-deep-decarbonization-electrificati… […]