Windpower Case Study in Ontario (Part 2: Adverse impacts on nuclear plants and general health)
By William Palmer -- March 1, 2012[Editor’s note: Part 1 of this case study addressed the false claim that wind has any appreciable impact on reducing coal-fired generation. This part focuses on the little known considerations relating to the effect on nuclear plants that must be cycled to balance wind, which counters claims that wind power improves general health.]
“Excessive baseload generation largely due to a contractual requirement to buy all available wind output might make it look like wind is supplying an increasing fraction of the energy supply (in TWh), while the nuclear supply appears to be decreasing. But in reality, the reduction in Bruce B unit output to permit this fallacy cannot be justified economically, nor is it a wise and conservative operation of a nuclear station.”
The following eight charts extracted from the Sygration website, which allows plotting of the Ontario IESO electrical generating unit performance, demonstrate that not only are wind turbines ineffective to replace coal, in actual fact, they do considerable harm to the stability of the electrical supply, and increase the risk of upset and accident at a nuclear generating station.
Wind Performance Data
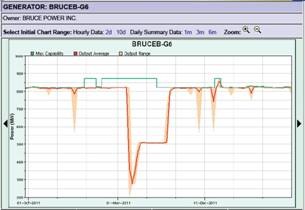
The charts below show the output of the four Bruce Power B generating units 5,6,7,8 – first for the 3 months of April through June 2011, and then for the 3 months of October through December 2011.
Each of the charts shows situations when the outputs of the Bruce B units were reduced to 550 MW. These deratings are due to surplus baseload generation, largely driven by the policy of the IESO to accept all available wind generation, even if the system does not need it, and even when it requires selling the output at high negative cost to neighbouring utilities in order to prevent an excess generation situation which would make the system frequency rise above 60 Hz, generating instability.
Contractually, Bruce Power is required to derate Bruce B units on the demand of the system operator when the system is in this surplus baseload situation. To do this, some 300 kilograms per second of live steam at about 4,000 kilopascals (250 degrees C) is dumped into the steam turbine condensers of each unit. Even to non-technical readers, this can be seen to be a large amount of energy, and not a trifling matter.
Operationally this is an undesirable situation. While the systems permit this to enable a unit to maintain electrical output during a grid upset, routine operation in this manner is undesirable as it applies higher than normal stresses to the condenser, and to the condenser discharge steam valve (CSDV) piping which is not normally in service. This increases the risk of plant upset.
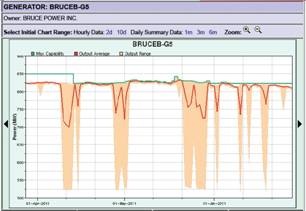
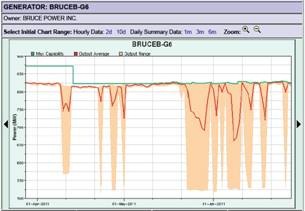
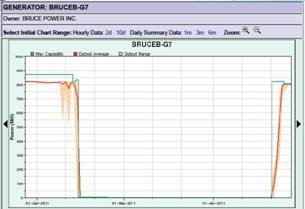
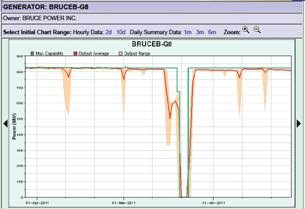
Bruce B – April to June 2011 – dips to 550 MW due to Surplus Baseload Generation

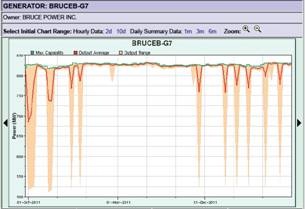

Bruce B – Oct to Dec 2011 – dips to 550 MW due to Surplus Baseload Generation
The consistent pattern of derating Bruce B units in order to avoid reducing output of wind turbine and other surplus baseload generation cannot be justified economically, nor does it constitute conservative operation of a nuclear station.
Wind Impact on General Health
The final chart blends together the annual energy generation and the Statistics Canada data for deaths from respiratory illness and percentage of people suffering asthma.
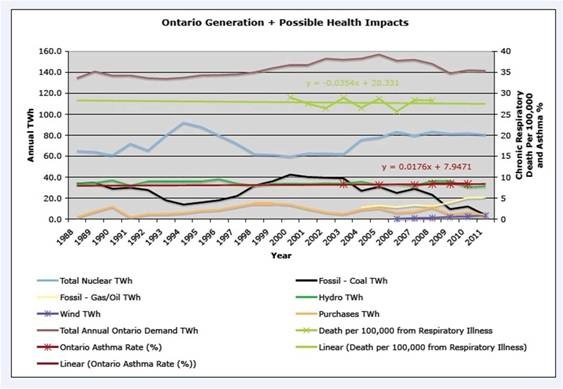
One might suspect that there would be a big drop in both adverse health effects from 2003 to 2011 due to the big reduction in coal use from 40 TWh to 4 TWh, from all we hear about the anticipated improvement in health due to shutting down coal generators.
However, looking carefully at linear regression lines for each health effect, the change in the health factors are barely discernible over the years from 2003 to 2011 that coal output was reduced from 40 TWh to 4 TWh. It hardly presents the clear linkage between coal usage and adverse health effects claimed by the Canadian Association of Physicians for the Environment (CAPE), and as repeatedly quoted by the Ministry of the Environment and Premier.
Some will argue that there is likely a lag between the reduction in coal production and impact on deaths from respiratory illness due to an integrated effect over time, while asthma rates are more impacted by the short term conditions. That argument requires additional considerations.
The first is that the Ontario Medical Association position paper on pollutants in the Southern Ontario corridor from Detroit to Quebec points out that more than 96% of the coal-fired electricity plants impacting this region are located in the United States. That suggests closing down the Ontario coal plants would have no significant effect.
Secondly, one needs to consider other factors as well, since the Statistics Canada health effects show a higher death rate from respiratory illness, and a higher asthma rate in the province of Quebec than in Ontario. Quebec has no coal fired generators, and although north of the US Northeast, the previously mentioned Ontario Medical Association paper states that the Great Lakes basin is particularly vulnerable to the impact from coal fired generating stations, which would suggest a larger influence in Ontario than Quebec.
The Statistics Canada data suggests other factors are at play, and that reduction of coal production in Ontario will not have as big as influence as suggested.
Perhaps most importantly, the health effect that the charts do not show is the effect on health caused by a drop in income that can be used to purchase good food, due to the increase in electrical utility bills. Statistics Canada lists many papers outlining the drop in general health as a family spends a higher proportion of its income on shelter and utilities. In the same years from 2003 to 2011, the cost of electrical energy in Ontario has more than doubled, and it continues to rise at an even higher rate as we bring on stream more wind turbines and other sources of green energy. But that is the subject for another study and day!
In Summary:
- The factual evidence demonstrates that:
- Wind is not responsible for replacing coal from an energy (TWh) basis
- Coal output from 2003 to 2011 was reduced due to
- increasing nuclear unit output from 60 to 80 TWh
- increasing natural gas unit output from 0 to 20 TWh
- decreasing Ontario electrical demand due to the recession that reduced demand from nearly 160 TWh to about 140 TWh
- Wind is not responsible for replacing coal from a power (MW) basis since wind output is often very low when the system demand is high, demanding coal to be run.
- Output of wind turbines can vary significantly over a few hours, as each season shows examples of rapid rise and fall in wind output.
- The time of maximum wind output often does not match the time of maximum system demand. Routinely, the maximum wind output occurs when system demand is lowest at night, and then wind output falls in the morning just as the system demand is increasing.
- Seasonally, wind output is poorest in the summer, when the system demand is at its highest, and sustained wind output is highest when the system demand is lowest in spring and fall.
- Each season has periods of days at a time when the average wind output stays low, showing that even if storage systems (very expensive) are integrated with wind, they would have to have tremendous capacity to level out the days at a time with very low wind output.
- Both from an economic point of view, and from the viewpoint of replacing coal, wind does not make sense. Having operating rules that require the system operator to buy all available wind at a fixed “feed in tariff price” can result in paying high prices for unnecessary supply. Such output requires paying conventional sources to not generate (but to remain ready to return to power quickly), and paying other utilities to excess generation to prevent instability. The system operator may have to maintain alternate generating sources at reduced output while wind output is high at night to be able to respond rapidly to the anticipated drop in wind output that occurs during the coming hours. In fact, experience shows that high wind output at night when system demand is low can be followed by several days of negligible wind output when system demand is high.
- Even with only some 1400 MW of wind available, periods of high wind output in an overnight period can require the system operator to decrease other supply sources drastically, and to sell power to utilities outside Ontario at a negative cost in order to maintain system stability.
- We pay three times. We pay for wind output; we pay for nuclear to not generate; and we pay to sell the excess power. Wind is not economically justified.
- Excessive baseload generation largely due to a contractual requirement to buy all available wind output might make it look like wind is supplying an increasing fraction of the energy supply (in TWh), while the nuclear supply appears to be decreasing. But in reality, the reduction in Bruce B unit output to permit this fallacy cannot be justified economically, nor is it a wise and conservative operation of a nuclear station.
- The change in the health factors are barely discernable over the years after 2003 when coal generation output was reduced.
Sources of Data
The electrical data came from reports issued by Ontario Hydro (the overall authority for electricity matters in Ontario), Ontario Power Generation, Bruce Power (one of Ontario’s nuclear generation plants), the IESO, and Sygration (this is a web site that uses the IESO data to do various charting and value added operations.) The health effects data is from Statistics Canada.
————————————-
A full bio of William Palmer, a professional energy engineer, is found in Part I of this series.
[…] Windpower Case Study in Ontario (Part 2: Adverse impacts on nuclear plants and general health): One might suspect that there would be a big drop in both adverse health effects from 2003 to 2011 due to the big reduction in coal use from 40 TWh to 4 TWh, from all we hear about the anticipated improvement in health due to shutting down coal generators. […]
Jack Gibbons of the OCAA and his juvenile deaths per terrawatt-hour of coal metric of 25.1. What a massive and rather unfortunate joke. Ontario will be paying for it for the enxt 20 years.
Below are links to articles by/about Ross McKitrick. The first, including a discussion of the risk posed by dirt roads, is my favourite.
http://opinion.financialpost.com/2011/05/16/ontarios-power-trip-the-failure-of-the-green-energy-act/
http://opinion.financialpost.com/2010/03/18/where-are-the-bodies/
http://opinion.financialpost.com/2010/06/15/junk-science-week-the-missing-smog-dead/
Perhaps this important article will stimulate other professionals in the energy industry to say, finally, enough is enough. That the bean counters at FERC and NERC continue to push the dim and dumb of renewables, justifying their “integration” by pandering to political correctness, both at the expense of their mission and, literally, rate and taxpayers, is disgusting. That there is a continent-wide bipartisan political swoon for wind especially is a severe indictment against the integrity of government at virtually all levels. That electrical and mechanical engineers gush over the make work that renewables represent, at great public expense, is a blight against their professional integrity. And that professional journals–not just the mainline media–seem loath to publish performance reports such as this on renewables projects because they don’t want to loose advertising and grant dollars, should put them beyond contempt.
Bill Palmer lives in a region that allowed for testing the idea that substantial reductions in coal generation would result in corresponding reductions in asthma. By putting actual performance data into play, and extending it to question one of the shibboleths of environmentalism–one of its holy of holies–that coal generation “causes” asthma, he does great public service.
Given how the US Democrat Party and The Sierra Club pushed coal production so hard a generation ago, their reversal on this issue today seems more than ironical. For me, it seems cruel. There is little actual evidence that modern coal plants even correlate with respiratory illness, let alone cause it. Moreover, as Palmer points out, there seems to be an even more sinister thesis that requires testing: in recessionary times, more expensive electricity are likely to result in higher levels of poverty, which itself clearly correlates with poorer health quality.
All this illustrates, for me, the real chronicle of environmentalism: it is the repetitive story of how adverse consequences too often flow from the uninformed actions of the well intentioned.
Those of us, like Richard Wakefield and Ken Langford, who have been following wind performance along the landscape of the Ontario IESO, have long known wind is a disaster for the Province. As it is for the Pacific Northwest, Ireland, Texas, Iowa, Denmark, and Germany–anywhere that wind has substantial presence. Even in terms of the goals set forth by those who support it.
By any functional accounting, it is dysfunctional.
If anybody ever asks what about the asthma and PM numbers in the US, tell them the data show the same inconvenient trends.
According to the CDC (http://www.cdc.gov/mmwr/preview/mmwrhtml/mm6017a4.htm), “Among persons of all ages, the prevalence of asthma increased from 7.3% (20.3 million persons) in 2001 to 8.2% (24.6 million persons) in 2009, a 12.3% increase.”
According to the EPA ambient air quality data (http://www.epa.gov/airtrends/2011/) “Nationally, annual PM2.5 concentrations were 24 percent lower in 2010 compared to 2001. 24-hour PM2.5 concentrations were 28 percent lower in 2010 compared to 2001.”
Nonetheless, according to the EPA Cross State Air Pollution Rule (http://www.gpo.gov/fdsys/pkg/FR-2011-08-08/pdf/2011-17600.pdf) reductions in emissions will lower asthma rates: “The estimated benefits of this rule are substantial, particularly when viewed within the context of the total public health burden of PM2.5 and ozone air pollution. A recent EPA analysis estimated that 2005 levels of PM2.5 and ozone were responsible for between 130,000 and 320,000 PM2.5-related and 4,700 ozone-related premature deaths, or about 6.1 percent of total deaths from all causes in the continental U.S. (using the lower end of the range for premature deaths).96 In other words, 1 in 20 deaths in the U.S. is attributable to PM2.5 and ozone exposure. This same analysis attributed almost 200,000 non-fatal heart attacks, 90,000 hospital admissions due to respiratory or cardiovascular illness, 2.5 million cases of aggravated asthma among children, and many other human health impacts to exposure to these two air pollutants. We estimate that PM2.5 improvements under the Transport Rule will, starting in 2014, annually reduce between 13,000 and 34,000 PM2.5-related premature deaths, 15,000 non-fatal heart attacks, 8,700 incidences of chronic bronchitis, 8,500 hospital admissions, and 400,000 cases of aggravated asthma while also reducing 10 million days of restricted activity due to respiratory illness and approximately 1.7 million work-loss days. We also estimate substantial health improvements for children from fewer cases of upper and lower respiratory illness and acute bronchitis.”
Compared to 2005, EPA estimates that by 2014 this rule and other federal rules “will lower power plant annual emissions in the Cross-State Air Pollution Rule region by: 6.4 million tons per year of SO2 (2005 emissions were 8.8 million tons) and 1.4 million tons per year of NOX (2005 emissions were 2.6 million tons).” Unfortunately EPA does not provide 2001 data for just the Cross State rule plants to compare with the asthma and air quality data years. If we look at acid rain program units and remember that the Cross State rule plants are a subset of those units we see that emissions also dropped significantly. Between 2001 and 2009 SO2 emissions dropped 4.9 million tons and NOX emissions dropped 2.7 million tons.
Excellent articles Bill. I especially like your approach to the question of air pollution and human health impacts. Your approach is more empirical and easily understood by the average person than McKitricks.
What is more, your work and McKitricks re-enforces each other, confirming as it does the other’s findings by a different means.
Thanks for the great articles!
[…] Windpower Case Study in Ontario (Part 2: Adverse impacts on nuclear plants and general health) […]
[…] http://www.masterresource.org/2012/03/ontario-windpower-case-study-ii/ Share this:TwitterFacebookEmailPrintLinkedInDiggRedditStumbleUponLike this:LikeBe the first to like this post. […]