Windpower Case Study in Ontario (Part 1: Coal-fired generation not displaced)
By William Palmer -- February 29, 2012[Editor Note: This case study of Ontario, Canada (one of the least emissions-producing electricity systems in the world) by a veteran energy engineer uses available data to shed light on unfounded claims about industrial wind turbines. Some aspects of the Ontario situation are unique, but many considerations are applicable to all countries/states/provinces. Part II concludes this case study tomorrow.]
“Even while wind was at peak operation, the coal generators served as backup (at low load) to be able to respond rapidly to the anticipated, and actual, drop in wind output that occurred just hours later.”
It has been claimed that industrial wind turbines allow Ontario to shut down coal-fired electrical generating stations. But the facts reveal this to be a myth.
The following graph shows how Ontario has generated its electricity from 1988 to 2011. It presents a pretty clear picture of what happened from an energy point of view, showing the generation sources for each year. Energy is measured in Terra (1012) Watt hours.
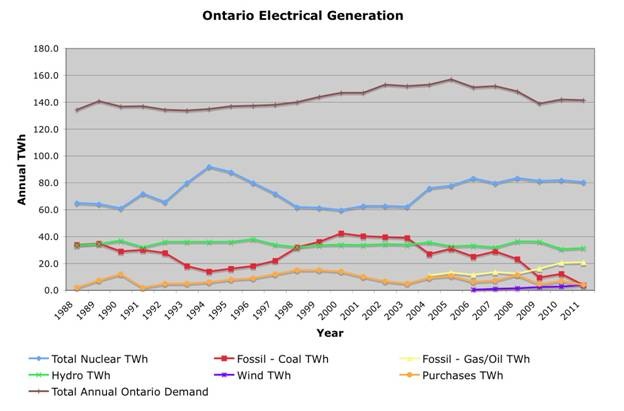
In 1988, Ontario was using coal (about 35 TWh per year), hydro (also about 35 TWh per year), and nuclear (about 65 TWh per year). Those sources met the load of about 135 TWh.
In the early 1990s (1992 and 1994, and 1995), Darlington Nuclear generating station came into service. As nuclear output increased to about 92 TWh, the coal generation dropped to about 15 TWh in 1994. Also, a slight recession was causing the Ontario electrical load to drop a bit.
In the latter 1990s, as the economy recovered some, a decision was made to lay up Bruce A and Pickering A nuclear stations, and focus limited resources on bringing the newer “B” stations at Bruce B, Pickering B, and Darlington up to a higher operational level. Nuclear generation dropped to about 60 TWh. Coal picked up the slack, rising back over 40 TWh.
By 2003, nuclear performance was improving, and in 2003 and 2004, 2 nuclear units at Pickering A and 2 more at Bruce A were brought back into service. Nuclear output started to rise, and coal usage fell correspondingly.
Also, in 2004, natural gas–fired generators started coming into service. You can see coal use dropping, as nuclear and gas generators pick up load, even though the system demand was rising, in the growing economy up to 2006. But, then, in 2007, an unexpected recession began, and the electrical load started to drop, as manufacturing- and natural resource–based jobs were lost from Ontario. You can see that load dropped in 4 years from over 155 TWh to under 140 TWh, erasing nearly 15 years of growth.
Meanwhile more natural gas generators were coming on line, and the nuclear performance was holding at about 80 TWh. Not surprisingly, the coal load fell—replaced by gas and nuclear, and with the Ontario electrical load diminished due to the falling load.
Oh, and wind; yes, you can see wind output starting to appear at the bottom of the curve in recent years, but the 4 TWh of wind output by 2011 can hardly be claimed to have replaced the 40 TWh of coal that was running up to 2003. Wind is not replacing coal from an energy (MWh) point of view.
So coal output dropped between 2003 and 2011 due to:
1. Four nuclear units coming back on line, and overall nuclear production increasing by 20 TWh.
2. Natural gas units coming on line and producing up to 20 TWh.
3. The System load dropping due to the economic crunch, dropping 15 TWh.
Of course, we still have the problem that the 4 TWh that wind does produce is often not when needed, but is generated when the system does not need it. To understand this, we need to look at the actual power delivered in MW by wind turbines compared to the total system demand at any given time, not just the total energy produced in TWh over a year. The next 4 charts show 2-week periods in each season—winter, spring, summer, and fall—in the year 2011.
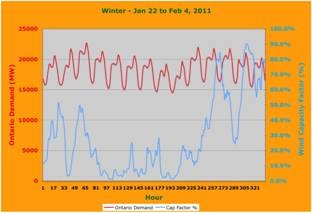

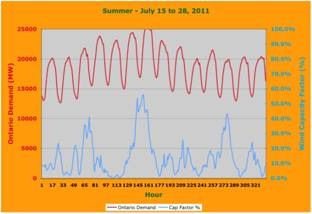

The four charts show how the Ontario demand rises and falls on a daily basis over a 2-week period on a 0 to 25,000 MW scale represented by a red line, and how the output of all Ontario wind turbines varies over the same period on a 0% to 100% capacity factor scale by a blue line.
The charts make several points about the output of wind turbines clear:
1. Output of wind turbines can vary significantly over a few hours, as each season shows examples of rapid rise and fall in wind output.
2. The time of maximum wind output often does not match the time of maximum system demand. Routinely, the maximum wind output occurs when system demand is lowest, namely at night, and then wind output falls in the morning just as the system demand is increasing.
3. Seasonally, wind output is poorest in the summer, when the system demand is at its highest, and sustained wind output is highest when the system demand is lowest, in spring and fall.
4. Each season has periods of days at a time when the average wind output stays low, showing that even if storage systems (very expensive) are integrated with wind, they would have to have tremendous capacity to level out the days at a time with very low wind output.
The four charts show clearly that from a power (MW) point of view, wind cannot replace coal, as wind output is often very low when the system demand is high, demanding coal to be run.
Impact of Wind on the Electrical System
This chart shows a typical example of how wind output impacts the electrical system.
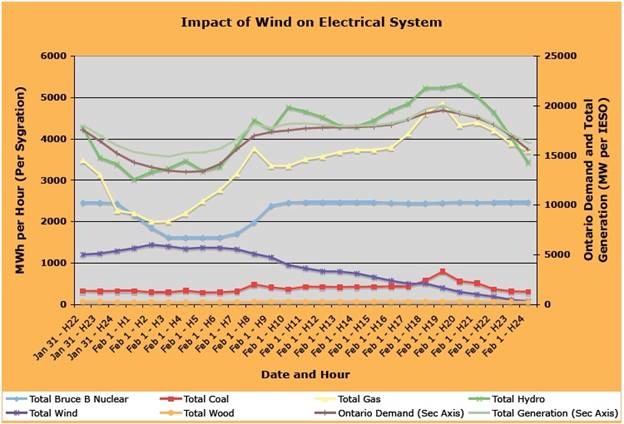
On night Jan. 31/morning Feb. 1, as the Ontario electrical system load (brown line) fell overnight, the wind turbine output (purple line) rose in the hours to an output of over 1300 MW between 0000 hours and 0700 hours the next day (peaking at 1441 MW at 0200 hours). The system operator responded by reducing Hydro output (green line), the Gas output (yellow line), the coal output (red line), and the output of the Bruce B nuclear units (blue line) by over 900 MW.
Meantime, as the system load increased from 0500 hours to 2000 hours, the wind output fell continually from 1369 MW to 296 MW (and continued to fall.) In fact, over the next 3 days, from Feb 2 through 4, the wind output ranged daily from 40-153 MW, 65-335 MW, 42-213 MW, until finally recovering 4 days later on Feb. 5 to range from 21 to 805 MW.
Again, looking at the overnight from Jan 31 to Feb 1, as wind output rose, even though the system operator was reducing generation sources other than wind, it is clear that the difference between the available generation and the Ontario demand exceeded 1400 MW, and the Sygration website data, which allows plotting of the Ontario IESO, shows the system operator was paying up to $71.50 a MWh to utilities outside Ontario to take the excess generation. At the extreme, consumers in Ontario were paying wind generators some $135 a MWh for 1441 MW, were paying Bruce Power $45 a MWh to not generate 900 MW, and were paying utilities outside Ontario $71.50 a MWh to absorb the excess generation.
One can only observe that it is remarkable that the Report of the Ontario Commission on the Reform of Ontario’s Public Services (the Drummond Report), issued in mid February 2012, identified as a cost-saving objective for the electricity consumer for the Integrated Power Supply Plan to be issued matching the Ontario Long Term Electrical Supply Plan. That would result in increasing the wind output from 1600 MW to over 8500 MW. This is the strangest way of saving money that I can imagine as it will only compound the problem of excess generation.
Even while wind was at peak operation, the coal generators served as backup (at low load) to be able to respond rapidly to the anticipated, and actual, drop in wind output that occurred just hours later.
Clearly, the chart shows that both from an economic point of view, and from the point of view of replacing coal, wind does not make sense.
Part 2, tomorrow, will address wind’s impact on nuclear plants when they are required to balance wind’s volatile output, as well as some general health considerations.
—————————-
William Palmer, an Ontario Licensed Professional Engineer, has been responsible for Operations Performance Assurance at the Ontario Bruce B Nuclear Station and was authorized by the federal regulator as a Nuclear Shift Supervisor.
He is a member of the Canadian Acoustical Association, and the Acoustical Society of America. He has applied his professional experience in the energy industry, as well as education in engineering and risk assessment to a study of the safety of wind turbines.
Palmer has written a number of papers dealing with the subject of wind turbine noise and setbacks; has presented to international conferences, and has been a witness before tribunals, regulators, and legislators regarding wind turbines in Ontario. He has also written on the adverse economic impacts of integrating renewable energy supply into the bulk electrical system.
[…] Full article including corresponding graphs […]
I just stumbled on your site and am delighted at the treasure trove of information here. This will give me many hours of reading and investigation. I hope you don’t mind, but I’ve put up a link to your site on my blog.
[…] Windpower Case Study in Ontario (Part 1: Wind doesn’t replace coal-fired generation) — MasterRes…: …it is remarkable that the Report of the Ontario Commission on the Reform of Ontario’s Public Services (the Drummond Report), issued in mid February 2012, identified as a cost-saving objective for the electricity consumer for the Integrated Power Supply Plan to be issued matching the Ontario Long Term Electrical Supply Plan. That would result in increasing the wind output from 1600 MW to over 8500 MW. This is the strangest way of saving money that I can imagine as it will only compound the problem of excess generation. […]
Thank you Bill, for your continued service (now unpaid in anything but enormous gratitude) to the people of Ontario. The more hard data and facts we have to refute the puffery of wind developers the better we can continue to fight the wanton destruction our precious natural heritage and our rural communities.
Wind cuts clean, not dirty generation. ISO-NE study for installing 24% wind with CO2 at $40/ton does not reduce generation from coal plants either….it only reduces by 50% the generation from the low emission gas plants…environmental lawyers at a recent renewables conference were amazed that their expensive renewables solutions didn’t have the intended effect. All the studies I’ve seen don’t quantify the additional capacity payments that will be required to keep plants on line after their energy revenues are cut in half. Stayed tuned for the lawsuits such as the recent one filed in New England. There should be adequate precedent from the restructuring stranded costs issue which basically said that government can do whatever wants…as long as it pays the costs. Government can screw up markets by subsidizing wind and solar as long as it also pays for the lost revenue to others.
This is a profoundly important article.
It’s the kind of analysis that should permeate the literature about wind technology, lucidly accounting for a number of factors and discussing wind output as functions of both energy and power. Significantly, Bill Palmer’s methodology establishes the historical context of his region’s generation mix, showing in what proportion supply met with demand for nearly a quarter of a century, with wind output at increasing levels over the last six years. He even gives good examples of seasonal performance.
Given all the interaction over this time period among the ups and downs of demand, the impact of additional nuclear capacity and increased efficiency of existing nuclear plants, the impact of additional natural gas generation, and the substantial reduction of coal generation, Palmer’s data shows wind performance had little, if any, effect on the use of conventional fuels. The reduction in coal use was “caused” by a number of other factors, in tandem. Ontario wind was, and remains, an utter supernumerary: “Wind is not replacing coal from an energy (MWh) point of view.” In the larger scheme of things, it’s also not replacing anything else.
But this is only the beginning of the tale. Discerning readers will recognize, despite Palmer’s dead pan, the utterly corrupt nature of the bureaucrats serving up Ontario’s public services “reforms.” By documenting the costs, in actual dollars, of dumping excess wind while paying its producers big bucks, Bill Palmer exposes the economics of wind for the fraud it is: rate payers are paying much more and getting only energy dysfunction in return.
I’ll look forward to Part II. Meanwhile, readers might also want to consider the impact of minute by minute wind flux on coal generators dispatched to follow and balance that flux. The public–and its servants–should demand dispatch analyses that would measure the extent to which thermal inefficiencies from wind following conventional generation result in increased fuel use and emissions, as well as increased maintenance costs and reduced operation life expectancy for the conventional generation equipment.
Great article and Power Engineer’s comment “All the studies I’ve seen don’t quantify the additional capacity payments that will be required to keep plants on line after their energy revenues are cut in half” was right on the money too. Add to keeping plants on line keep in mind that due to environmental issues there is pressure to retire old fossil-fired units and replace them with new ones. I cannot imagine a new construction business plan that will go forward without guarantees to cover the energy revenues lost to subsidized renewable projects.
I’ve been monitoring the Ontario IESO for some time now and knew that there had to be a cost in conventional generation’s following of excess wind output. This is a grave injustice to the people of Ontario! This report needs to be front and center on the desk of every politician contemplating wind power for their community/state. These snake oil salesman must be stopped!
Nice to see my analysis reproduced independantly.
http://OntarioWindPerformance.wordpress.com
[…] Read More Here. […]
[…] Green News Source- Click to read full articleh204(); […]
[…] PM Cameron still seems to support industrial wind stating that industrial wind will “ shutter old coal stations” and replace them with “greener” energy like wind” thus reducing greenhouse emissions. What the Prime Minister seems to ignore is the growing evidence that, in fact, industrial wind fails to replace fossil fuels. […]
Terrific analysis and great source of hard numbers that show many signs of poor decision making.
For example – just imagine what the power supply balance could have been if there had not been so much antinuclear activity and pressure to stop building. Both coal AND gas would have been unnecessary. Wind would have been a complete non starter because there would have been no ability to tell a tale of emissions savings.
Of course, making coal and gas unnecessary would have been detrimental to the interests of a number of rich, politically well connected people who love selling those fuels to electric power plants. Bulk sales to customers that have to buy are a terrific way to bring in reliable revenues.
Why weren’t the nuclear suppliers more aggressive about capturing and keeping market share? Why haven’t nuclear supporters ever learned the value of advertising?
Rod Adams
Publisher, Atomic Insights
[…] And what about the claim that industrial wind will replace coal? […]
[…] note: Part 1 of this case study addressed the false claim that wind has any appreciable impact on reducing […]
[…] note: Part 1 of this case study addressed the false claim that wind has any appreciable impact on reducing […]
[…] http://www.masterresource.org/2012/02/ontario-windpower-case-study-i/ […]
Thank you Mr. Palmer for such a comprehensive effort and presentation. These fact-based articles, and their fact-based observations and conclusions, are of immense importance and value. These fully-defendable findings should be made widely available as an educational aid for the general public.