Primary Energy Consumption (Part III—Emissions)
By Kent Hawkins -- October 14, 2015“The current strategies major implementations of ‘clean’ energy sources, largely depending on wind and solar, to address concerns about climate change are seriously misguided, and should be abandoned.”
Part I (total usage) and Part II (electricity) showed that fossil fuels dominate primary-energy consumption–and will continue to do so. This expectation comes from a range of official forecasts–but really from the imbedded inertia of the system where oil-powered transportation dominates and power generation is wed to fossil fuels with nuclear in the mix.
The electricity sector is projected to grow to about 50 per cent of the total by 2035; Part III today will attempt to quantify the emissions impact within a range of primary-fuel scenarios along with the associated capital costs.
Wind, Solar Mirage
Regarding the power market, wind and solar will actually play a minor, even inconsequential, role in reducing emissions by 2035. Worst still for those that believe human-caused CO2 emission are responsible for disastrous climate change, other reasonable options now available will not have a timely effect. Adaptation, and using wealth diverted from inappropriate energy policy, is a key public-policy takeaway from this series.
Removing wind and solar from the mix planned for 2014–2035 will reduce investment costs by almost $3 trillion globally, with very little, if any, increase in CO2 emissions. What does become clear is that there is only one approach, apart from aggressive conservation, that would have had any chance of greater impact on human-caused emissions. So what should we do?
Statistical Background
Table 1 shows global emissions levels for 2014 and projected to 2035 from three sources – BP plc, the U.S. Department of Energy/Energy Information Administration (EIA) and the Organisation for Economic Co-operation and Development (OECD). Not surprisingly, because of the complexities involved, there are differences among sources. As well, Table 1 shows a baseline for further analysis, calculated to allow the impact of changing the use of some primary energy sources in the electricity sector.
Table 1 – Samples of Different Determinations of Global CO2 Emissions
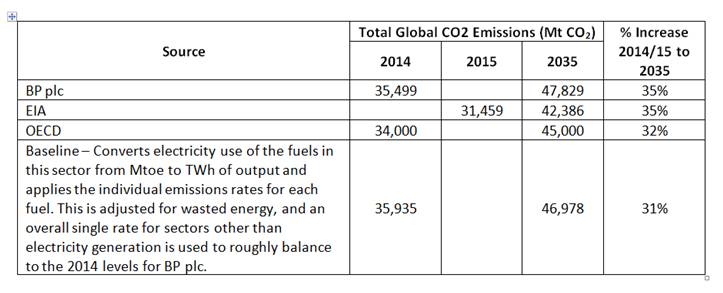
Further explanation of Table 1:
- The first three rows are relatively self-explanatory. The EIA appears to consistently show notably lower levels than BP plc, and the OECD, which is roughly between the two. This underlines the unreliability of reported emissions data, which are estimates based on calculations using simplifying assumptions, not measurements, and the inevitable “looseness” in any analysis based on them. However, it is still possible to draw reasonably robust conclusions.
- Row four sets a baseline to start evaluating the emissions effect of varying fuel inputs to electricity generation, a focus of much of the policies today that (as already mentioned) also encompasses almost the total use of wind, solar, hydro and nuclear. Roughly balancing to the 2014 emissions levels for BP plc is consistent with the assumption made in Part II that overall primary-energy consumption is not increased by including the wasted energy component in the electricity sector. The use of primary energy is reallocated between the electricity and other sectors.
Scenario Analysis
The adjustments then made to the above are as follows (see Table 2):
- Scenario A – Fuel consumption deemed the input energy to wind and solar is added in varying degrees to natural gas to illustrate a range of the effect of the wasted energy, or friction, attributed to the presence of these erratic new renewables. It remains possible that the wasted energy exceeds this.
- Scenario B – Wind and solar are removed from the mix to show the impact.
- Scenario C – Coal is eliminated in electricity generation by increasing natural gas and nuclear by about twice the 2014 levels. The resulting nuclear level is about the same as the upper forecast of the World Nuclear Association, so it would appear to be feasible from an implementation point of view. The doubling of natural gas generation is more arbitrary but provides the additional production to complete the elimination of coal. This expansion in use of natural gas plants is likely feasible because of shorter implementation times and lower capital costs per megawatt. It is assumed that an adequate supply and delivery of natural gas is feasible.
Table 2 shows the effect of these changes, which falls far short of the level of omissions savings that are claimed to be necessary.
Table 2 – Emissions for a Range of Electricity System Primary Fuel Scenarios (A, B and C)
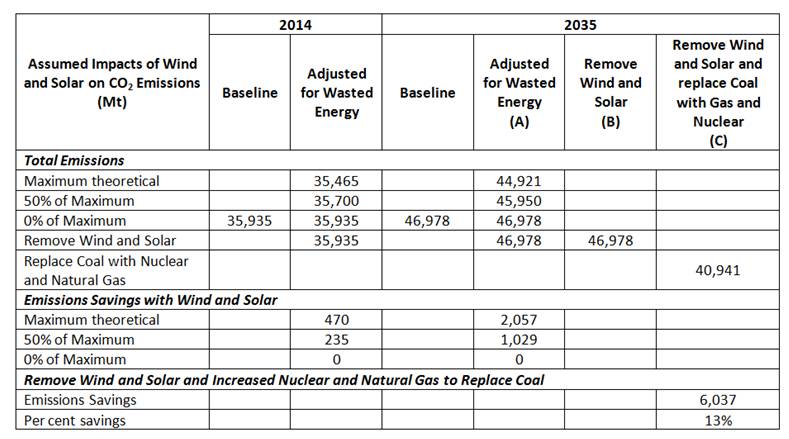
Table 3 shows the costs of the various options for the period 2014–2035, including the emissions savings in 2035.
Table 3 – 2035 Emissions Savings and Associated Capital Costs in 2014 Dollars for 2014-2035
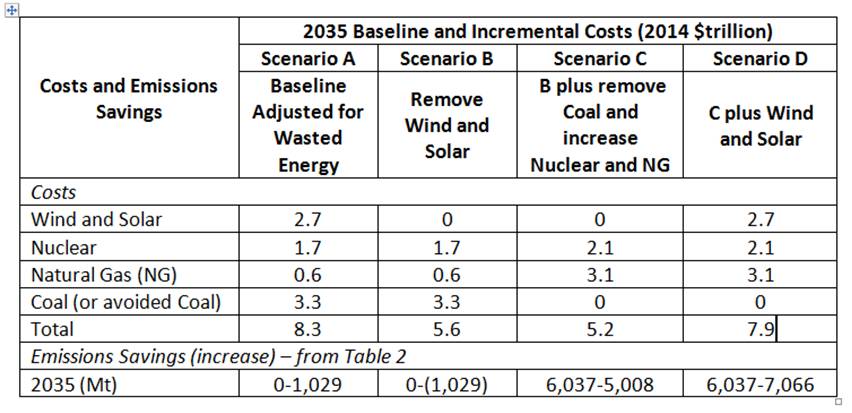
This illustrates that wind and solar are not an effective means of reducing emissions. The second values in the last line of Table 3 are the emissions savings based on wind and solar delivering 50 per cent of the theoretical maximum. Even at the unlikely level of 50 per cent of maximum theoretical savings, the no-coal, wind or solar scenario saves about five times the emissions (5,008 Mt versus 1,029 Mt) .More likely, wind and solar savings are closer to zero, and both may also increase emissions if wasted energy is higher than that shown here.
Scenario C produces the most emissions savings at the least capital cost.
Leaving wind and solar in the mix in Scenario D will produce very little if any additional emissions savings at about a 60 per cent greater capital investment as in Scenario C.
None of these scenarios will provide the necessary emissions savings claimed as needed to prevent catastrophic global warming, assuming that this is human-caused. We have likely “missed the boat” in most developed countries by turning away from nuclear as we have done.
The range of climate outcomes is:
- Traumatic climate change resulting in high global warming.
- Human emissions caused – The best policy approach is to abandon wind and solar and use the funding to best prepare us to adapt.
- Not human emissions caused – Again the best policy is as above.
- Traumatic climate change resulting in high global cooling – The best policy is as above, although adaption approaches will likely be different, so it would appear wise, initially at least, to plan for both.
- Climate change is not traumatic – The best policy is as above. Possibly the adaption strategies will provide otherwise not realized benefits for future generations.
The conclusions are:
- The current strategies major implementations of “clean” energy sources, largely depending on wind and solar, to address concerns about climate change are seriously misguided, and should be abandoned.
- It is important to keep the big picture in mind.
Bibliography
The bibliography in Part I still applies and some of it is repeated here for ease of reference.
BP plc (2015). Statistical Review of World Energy 2015 http://www.bp.com/en/global/corporate/about-bp/energy-economics/statistical-review-of-world-energy.html
OECD (2011). OECD Environmental Outlook to 2050. Prepared by the OECD Environment Directorate and the Netherlands Environmental Assessment Agency. http://www.oecd.org/env/cc/49082173.pdf Approximate values estimated from graph on page 15.
[…] blog Master Resource analyses the future of world energy generation. Several scenarios are considered, but the bottom line is […]
Someday in Britain, when the lights don’t come on and there is no heat in the middle of winter, politicians will finally wake up, and wonder who to blame. Is it possible that we in the US can learn from other people’s mistakes?
“Britain’s power generation capacity is dangerously low and the country risks blackouts for the first time in a generation, with experts warning the problem is a consequence of the drive to a low carbon economy.”
http://www.thisismoney.co.uk/money/news/article-3267711/Winter-blackout-fear-reserves-run-Osborne-s-green-taxes-blamed-power-supplies-falling-danger-level.html
Nice work, Kent. Can we prove any fleet-wide heat rate impacts yet (CC, CT and steam based on the required ratios/modes between these as well as ramping dynamics impacts)?
This just in from the Union of Concerned Scientists (not an endorsement):
Rating the States on Their Risk of Natural Gas Overreliance
http://www.ucsusa.org/clean-energy/rating-the-states-on-their-risk-of-natural-gas-overreliance#.Vh5no25BksQ
Convincing case, Kent, building on the work of Smil, Bryce, and others over the years–but from another perspective. Whatever the perspective, however, the Cinderella Slipper fit of the power density proffered by fossil fuels onto the foot of humanity’s desire for modern power performance will maintain their 80%+ use well into the next half century. Our carbon footprints will continue apace: 2035 is only as far away from us in future as 1995 was in the past. Whoosh!
I like your concept of “waste” that renewables like wind and solar introduce onto a grid. It is foremost, as you point out, a supernumerary phenomenon–not only unnecessary but also Rube Goldbergesque. Vaudeville had nothing on this kind of splendiferous nonsense. I also think your idea that whatever fossil fuel is saved by wind production is largely offset because the fuel is rerouted to regulate wind’s (and to a lesser extent, solar’s) continuous flux. Therefore, accounting for this by adding, as you recommend, an amount equivalent to the total wind and solar consumption energy onto the production of fossil fired regulating plants seems reasonable. Even in 2015, the utter lack of correlation between amounts of wind and solar production and reductions in fossil fired production that can’t better be explained by other means (import/exports, demand, fuel mix changes, efficiency, etc) is highly suggestive you’re on the right track.
Some helpful information on Renewable Energy performances and capacity factors derived from Renewable Energy industry sources.
EurObservER-Wind-Energy-Barometer-2015-EN-2.pdf
http://www.eurobserv-er.org/wind-energy-barometer-2015/
EurObservER-Photovoltaic-Barometer-2015-EN.pdf
http://www.eurobserv-er.org/photovoltaic-barometer-2015/
Cost comparisons are have been clearly made by the US EIA
US EIA electricity_generation.pdf 2015 Table 1
http://www.eia.gov/forecasts/aeo/electricity_generation.cfm
For fuller quantified illustrations from European renewable performance see:
https://edmhdotme.wordpress.com/european-renewable-energy-costs-and-performance-2014/
Accounting for the capacity factors, (the actual electrical output as compared to the Nameplate capacity of the Renewable installation) that are reported by the Renewable industry, the overall capital cost of all European Renewable Energy installations averages out at about €29billion / Gigawatt, whereas the cost of a conventional gas-fired generation is about €1billion / Gigawatt.
This comparison of course strips out all the positive profitability effects of government regulation and subsidies that are being applied to Renewable Energy: that regulatory support is the only means that make Renewables a viable business proposition.
The overall value accounting for capacity of Renewables at €29billion / Gigawatt is derived from the combination of:
Onshore Windpower €14.2 billion/GW
Offshore Windpower €41.4 billion/GW
On Grid Solar Power €48.5 billion/GW
Overall wind and solar power capacity in Europe is 17.9%
The burden of these additional Renewable costs is imposed on consumers via the increase in their utility bills.
According to these Renewable Energy supporting sources by 2014 European Union countries had invested approximately €1 trillion in large scale Renewable Energy installations. This may well be an underestimate.
This has provided a nameplate electrical generating capacity of about 216 Gigawatts, nominally about ~22% of the total European generation needs of some 1000 Gigawatts.
The actual measured output by 2014 from Renewable Industry sources has been 38 Gigawatts or 3.8% of Europe’s electricity requirement, at a capacity factor of ~18% overall.
The whole 1000 Gigawatt fleet of European electricity generation installations could have been replaced with reliable, dispatchable, lower capital cost Gas-fired installations for the €1trillion of capital costs already expended on Renewable Energy in Europe.
However Renewable Energy production is dependent on the seasons, local weather conditions and the rotation of the earth, day and night.
So the Renewable Energy contribution to the electricity supply grid is inevitably erratic, intermittent and non-dispatchable. It is therefore much less useful than dispatchable sources of electricity, which can be engaged whenever necessary to match demand and maintain grid stability.
But that 3.8% Renewable Energy contribution to the grid is often not available when needed and obversely its mandatory use and feed-in obligations can cause major grid disruption if the Renewable Energy contribution is suddenly over abundant.
The Renewable Energy industry could not exist without the Government mandated subsidies and preferential tariffs on which it depends. It is not a truly viable business proposition
Viewed from the point of view of the engineering viability of a nation’s electrical grid, Renewable Energy would never be part of the generating mix without its Government mandate and Government market interference.
So the Green thinking in its enthusiasm to save the world from an undefinable but probably minimal threat, will destroy civilisation long before the world fails from excessive overheating from CO2 emissions.
[…] I suggest that Table 2 represents the best case that could be made for mitigation on the assumption that global warming is caused by humans and is assigned a relatively high chance of being fixed (in this case 50%) as current policy trends claim. I have shown the difficulty, if not impossibility, of current renewable energy policies accomplishing this here. […]