High Temperatures: Temper Alarmism (El Nino … La Nina)
By James Rust -- April 5, 2016“By the end of February, the 2015/16 El Nino subsurface temperature had not turned negative; however, the lowered March temperature suggests this has taken place. The direction of this Super El Nino is similar to the one of 1997/98 and there is great chance of considerable global cooling by the end of the year.”
The media is spreading catastrophic global warming news from satellite temperature data ending February 2016. On March 3, 2016, the University of Alabama-Huntsville (UAH) posted the February 2016 global temperature of 0.83 degrees C. surpassed the previous record of 0.74 degrees C. for April 1998. These temperatures are the difference from the 30-year average from 1981 to 2010. This is a data set from 1979 until present when satellite temperature measurements were first made.
Associated Press writer Seth Borenstein wrote March 17, 2016 ”Freakishly hot February obliterates global weather records”. New York Times reporter Justin Gillis wrote on March 22, 2016: “Scientists Warn of Perilous Climate Shift Within Decades, Not Centuries”. Expect more scary stories from other writers who live off reports from the scientific community that generates climate change (global warming) information.
The University of Alabama at Huntsville (UAH) posted its latest satellite global temperature data that spans until the end of March 2016 shown by Figure 1.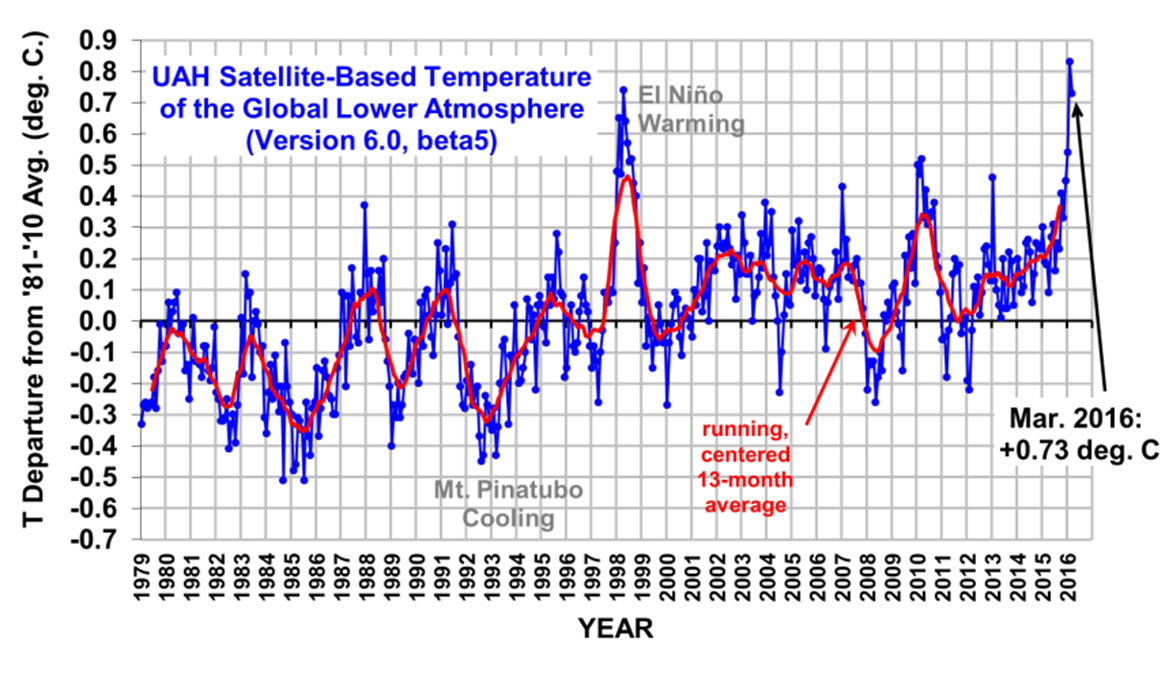 Fig.1 Latest Global Average Tropospheric Temperatures
The March 2016 temperature has fallen to 0.73 degrees C which is even lower than the previous record of 0.74 degrees from April 1998. The satellite temperature data shows a temperature rise since 1979 of 0.12 degree C. per decade; or 1.2 degrees per century which places the earth’s warming below the recommended limit on global warming from the 2015 Paris Climate Accord.
Data over thousands of years show approximate 500-year cycles of planet warming and cooling. We are currently in the Current Warming Period which commenced approximately 1850. This was preceded by the Little Ice Age from approximately 1350 to 1850. Thus continued global warming should be anticipated until after the start of the 22nd. century.
Super El Nino
Along the Equator stretching from New Guinea to Western South America is a region in which prevailing winds and sea surface temperatures create weather systems that impact the planet. When temperatures are warmer this creates a system called El Nino and countering cooling system is called La Nina. La Nina normally follows an El Nino. El Nino means the boy or Christ Child and this name was given because peak El Nino usually occurs around Christmas. These systems have been observed for centuries and are not caused by carbon dioxide from burning fossil fuels.
An El Nino system formed in early 2015 and became a Super El Nino that caused the February 2016 global temperature that was the highest observed by satellites over their period of measurements from 1979 to present. A La Nina is expected to follow this event and the question is when this happens and how much cooling takes place.
An excellent explanation of the importance of El Nino on global temperatures is given by the March 18, 2016 Reuters article “How much clarity do we have on transition to La Nina?” by Karen Braun. The article shows graphs of monthly surface and subsurface temperatures measured along the Equator.
Figure 2 illustrates monthly El Nino 3.4 sea surface temperatures for eight El Nino events occurring since 1982/83. El Nino 3.4 designates an area 165 degrees W to 90 degrees W and 5 degrees S to 5 degrees N. Since the length of 1 degree is 69 miles at the Equator, the El Nino 3.4 area is 5200 miles by 690 miles or 3.5 million square miles.
For the temperature scale, temperatures above 0.5 degrees C. are for periods with El Nino and temperatures below -0.5 degrees C. are for periods with La Nina. If three-month average temperatures are above 0.5 degree C. (or below), then an El Nino (or La Nina) is considered in progress. Temperatures between -0.5 and 0.5 degrees are neutral.
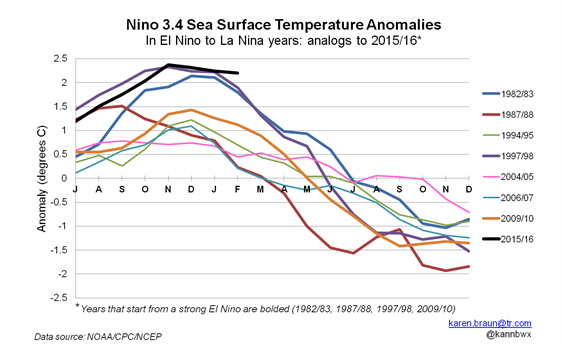
Fig.2 El Nino Sea Surface Temperatures
The lines are bolder for the strong El Nino over these years. As noted, the strongest El Nino prior to 2015 was the event 1997/98. In November 2015, the current El Nino sea surface temperature exceeded the maximum temperature from the 1997/98 El Nino. The current sea surface temperature has started a slight decline similar to that shown by the 1997/98 El Nino.
As seen for the 1997/98 El Nino, rapid cooling took place after the peak temperature early 1998. This resulted in a super La Nina later that year. The 2015/16 data does not show rapid cooling by the end of February 2016. However, due to the 0.11 degree C. drop in global temperature in March 2016 shown in Fig. 1, one can infer substantial decreases in sea surface temperature are taking place.
Perhaps a little more insight about the future of the current El Nino may be found by examining subsurface Pacific Ocean temperatures along the Equator. Figure 3 gives monthly measured ocean subsurface temperatures along the Equator to a depth of 300 meters for the eight El Nino events. These measurements are along a greater length along the Equator shown in Fig. 2. The distance is from 130 degrees E to 80 degrees W or 10,300 miles.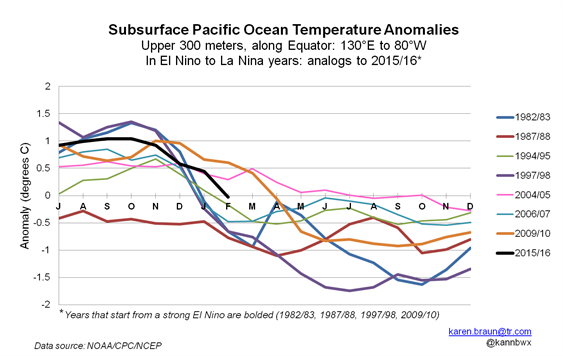
Fig. 3 El Nino Subsurface Temperatures
By the end of February, the 2015/16 El Nino subsurface temperature had not turned negative; however, the lowered March temperature in Fig. 1 suggests this has taken place. The direction of this Super El Nino is similar to the one of 1997/98 and there is great chance of considerable global cooling by the end of the year.
No Global Warming for 58 Years
Another perspective about the 2016 global temperature is the March 7, 2016 article “NOAA Radiosonde Data Shows No Warming For 58 Years” by Tony Heller. In NOAA’s press briefing 2015 was the “hottest year ever” was a statement NOAA had a 58-year radiosonde (balloon) temperature record but only showed the last 37 years in a graph. Figure 4 shows the graph released by NOAA.
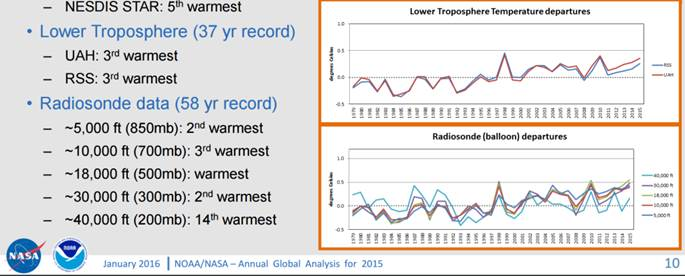
NESDIS Strategic Communications
Fig. 4 NOAA’s 37-YEAR SATELLITE AND RADIOSONDE TEMPERATURES
Tony Heller found the missing years of radiosonde data from 1958-1976 in the scientific journal article “Global Temperature Variation, Surface-100mb: An Update into 1977” in the June 1978 Monthly Weather Review. This data is shown in Figure 5 which indicates global temperatures declined from 1958 until 1977.
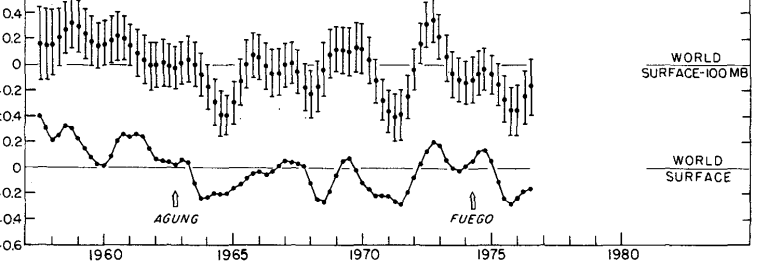
Fig. 5 Temperature variation for World Surface-100MB and World Surface. Eruptions of Mt. Agung and volcano Fuego (Guatemala) are indicated
Mr. Heller combined Figs. 4 and 5 into Fig. 6 and added a horizontal red line which shows in the troposphere there has been no global warming from 1958 to 2016. Purists might complain the 1958 to 1977 data is for a region that goes from the earth’s surface to an elevation of 100 mb (54,000 ft.) while the 1979 to 2016 data is for five discrete elevations from 5000 ft. to 40,000 ft. However, the five discrete elevation data are quite similar which makes the earlier comparison valid.
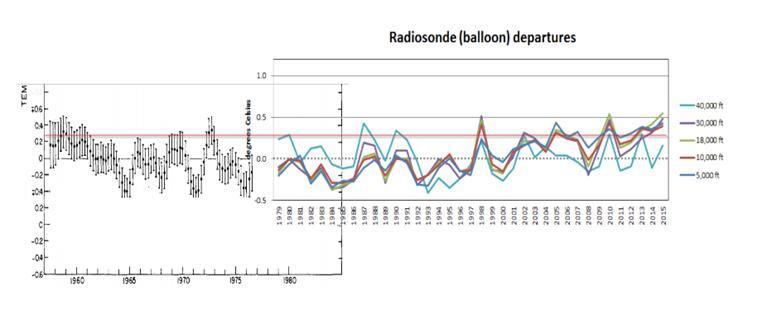
Fig. 6 Radiosonde data from 1958 to 2016
The NOAA, and NASA, press release claimed 2015 was the year with the hottest global surface temperatures since measurements were made from 1880. The physics behind the behavior of the greenhouse gas carbon dioxide causing warming has the warming occurring in the atmosphere from the earth’s surface to the stratosphere.
Thus the true measure of the influence of increasing atmospheric carbon dioxide from burning fossil fuels is shown by satellite or radiosonde data. From the period 1958 to 2016, atmospheric carbon dioxide has increased from 315 to 402 ppm. Since no appreciable global warming is shown by atmospheric temperatures over the period 1958 to 2016, one may infer increasing atmospheric carbon dioxide from burning fossil fuels has no significant influence on global warming.
looking Ahead
With a considerable amount of fanfare, NOAA and NASA announced 2015 and possibly 2016 are the warmest years since recording keeping started in 1880. Their media supporters like Seth Borenstein and Justin Gillis produced scary articles circulated through the media announcing this threat to the world from carbon dioxide from burning fossil fuels causing catastrophic global warming. The United States should lead the way for all nations to immediately find alternative energy sources to replace fossil fuels regardless the economic cost.
The importance of the NOAA and NASA assertions is questioned by the experimental data cited in this article. It is quite likely the present Super El Nino will change to a La Nina that will bring global temperatures back to levels seen a few years ago.
Will reporters like Seth Borenstein and Justin Gillis report to the public the errors of their recent assertions? I think not.
_____________________________________________________
James H. Rust, professor of nuclear engineering and policy advisor The Heartland Institute
Here are the complete radiosonde (weather balloon) temperature anomalies for the lowest 1/2 of the atmosphere.
850 mb level: http://www.durangobill.com/GwdLiars/GwdRATPAC850.jpg
700 mb level: http://www.durangobill.com/GwdLiars/GwdRATPAC700.jpg
500 mb level: http://www.durangobill.com/GwdLiars/GwdRATPAC500.jpg
.
(Radiosonde Atmospheric Temperature Products for Accessing Climate (RATPAC))
Data source: Globe section at:
http://www1.ncdc.noaa.gov/pub/data/ratpac/ratpac-a/RATPAC-A-annual-levels.txt
.
The stratosphere is cooling as per climate models.
http://www.durangobill.com/GwdLiars/GwdRATPAC100.jpg
Data source: 100 mb column in the Globe section at: http://www1.ncdc.noaa.gov/pub/data/ratpac/ratpac-a/RATPAC-A-annual-levels.txt
Thanks Bill Butler for providing the links to NOAA’s latest radiosonde data up to the end of 2015.
Tony Heller examined data from NOAA published in 2011 and then the data cited by Bill Butler. He noticed NOAA had changed the more recent data to cause greater warming in the period 1979 to 2015. His article included a graph showing the difference in NOAA data from 2016 and the NOAA data from 2011. Tony Heller’s comment about the graph follows:
“The next graph shows how NOAA has altered their 850-300 mb temperature data since 2011. Another hockey stick of data tampering.”
Go to the link for the March 7, 2016 article “NOAA Radiosonde Data Shows No Warming For 58 Years” by Tony Heller
An investigation needs to be done to justify the changing in data. This sort of mirrors NOAA coming out with a paper June 2015 showing the pause in global warming from 1998-2014 didn’t exist. If your data doesn’t serve your political purpose (abandon fossil fuels due to catastrophic global warming), change the data to make it fit.
James H. Rust, professor of nuclear engineering
The U. S. Climate Change Science Program (CCSP) published an April 2006 180-page report “Temperature Trends in the Lower Atmosphere Steps for Understanding and
Reconciling Differences “. ( http://www.fws.gov/southeast/climate/policy/Climate%20USCCSP%20Temp%20Trends%20sap1-1-final-all.pdf )
The report showed comparisons of vertical global temperature distributions in the atmosphere computed by Parallel Climate Models (PCM) with actual radiosonde (balloon) temperature measurements. The data is displayed with a vertical axis of altitude given on the left side as pressure in millibars and the right side in kilometers (km). The horizontal axis is latitude from 75 degrees S to 75 degrees N.
Figure 1.3 F (all forcings) shows calculated global atmospheric temperatures from January 1958 to December 1999. Temperatures are given by the change over this time period. The figure shows a very distinct “hot spot” from altitudes of 4 km to 16 km and latitudes from 30 degrees S to 30 degrees N. This hot spot is caused by increased greenhouse gases (mostly carbon dioxide) over that time period.
Figure 5.7 E (HadAT2 radiosonde data) shows measured atmospheric temperatures from 1979 to 1999. Temperatures are given in linear trend of degrees C per decade. The measured temperatures show very small changes over this time period for latitudes 30 degrees S to 30 degrees N and altitudes from 4 km to 12 km. These temperature changes provide some agreement with Tony Heller’s paper “NOAA Radiosonde Data Shows No Warming For 58 Years”.
I was unable to copy and paste these graphs, so the reader must go to the original CCSP report to see what is described.
The Executive Summary of the CCSP report claims agreement between observed and calculated temperature patterns. It dismisses disagreement with calculated and measured data by suggesting something is wrong with satellite and radiosonde data. This in spite of data in the report showing calculated patterns have no agreement with observed patterns. Since most people only read Executive Summaries of reports, this misinformation may lead the public to believe the CCSP report supports global warming is caused by increasing atmospheric carbon dioxide. This is not true.
Investigations by Congress is in order to clear up discrepancies of NOAA temperature data from year-to-year and reported accuracies of climate models by groups like the CCRP.
James H. Rust, professor of nuclear engineering
James Rust, On the page cited* below, Tony Heller spliced two different graphs from two different climate normals and although the baseline value of “0” was aligned between the two sets, it was deceptive to claim this was evidence of retroactive tampering. Had he normalized between data sets there would have a steady upward trend.
This is depicted in this graphic. https://imgur.com/tgxqDCQ
This graphic shows radiosonde data utilizing the same climate normal.
https://imgur.com/jIoveKl
I recommend the discipline of scientific skepticism so that these sorts of deceptions are more easily filtered out.
Steve Ridge
sr75080@gmail.com
* “NOAA Radiosonde Data Shows No Warming For 58 Years”