Section 1603 Extension: The Renewable Energy Bailout of 2011
By Lisa Linowes and Bill Short -- January 31, 2011In the waning hours of the tax bill debate last December, the Obama Administration and GOP leaders released the terms for continuing the Bush-era tax cuts. The framework negotiated between the parties initially omitted any reference to extending the renewable energy programs introduced in 2009 under the American Recovery and Reinvestment Act of 2009 (ARRA), which were scheduled to sunset at the end of 2010.
The renewable industry responded ferociously. A media blitz hit overnight, and wind and solar lobbyists huddled with lawmakers on Capitol Hill. Repeated warnings about job loss and the immediate harm to green energy businesses worked. Lawmakers relented and sanctioned a 1-year extension. The windfall? A check from the U.S. Treasury for 30 percent of a project’s qualifying cost.
With the fuss now behind us, we decided to examine one of the more popular renewable subsidy programs to be extended, the Section 1603 cash grants. Our analysis revealed a pattern of rewarding inflated project costs and decreased energy production, while shifting a substantial portion of the development risks to American taxpayers.
Supersubsidy upon Subsidy
Following the collapse of Lehman Brothers in September 2008, tax-based policy incentives lost much of their effectiveness as the number of tax equity investors declined. Provisions under ARRA were designed to fill the void by reducing, and essentially eliminating, the need for tax advantaged investors. The Section 1603 cash grant program enabled developers to secure direct monetary outlays from the Federal government to cover 30 percent of a project’s qualifying cost. (Greenwire October 14). The criteria for receiving the grant were not onerous, and the Treasury Department was prohibited by law from ranking the projects before distributing the funds.
Spanish energy giant Iberdrola Renewables, Inc., which received nearly a billion in cash grants alone, argued the money was crucial to promote jobs and economic opportunity (as if the money spent elsewhere would not have done the same….).
But a preliminary evaluation of the grant outlays published last year found that 61% of the grant money distributed through to March 2010 “likely would have deployed under the PTC [production tax credit] if the grant did not exist.” In many cases, money went to projects that were already under construction, and in some cases already producing electricity.
In an interview with Greenwire, an executive for a foreign subsidiary whose projects received Section 1603 money complained that it was unfair to criticize them for taking the funds because those projects otherwise would have received the production tax credit. He insisted, “The cost to the U.S. government is not materially different.”
The executive is not alone in his thinking. Others in the renewables industry have made the same claim which helps explain why support existed for extending the grant program for 1-year.
Cash in hand is worth more than discounted subsidies paid out over the course of ten years[1]. And the obvious intrinsic value of cash versus a tax credit in today’s financial circumstances cannot be ignored. But we were prompted to look further into the numbers themselves to test the claim of equivalence. Our analysis revealed that the cash grant program offers significant monetary assistance over the production tax credit while reducing benefit back to the public.
Analysis of 12 Projects
To evaluate the claim of equivalence, we looked at two operating geothermal facilities, five operating onshore wind energy facilities and five approved, but not built wind projects including two offshore applications proposed for New England coastal waters.
Table A below shows our findings.
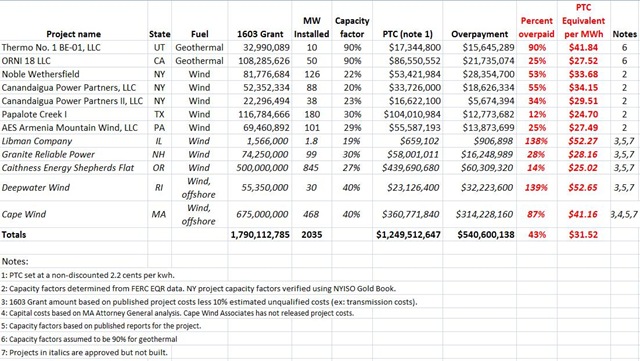
Of the twelve projects, the total cash grants that were (or will be) distributed exceeded anticipated production tax credit amounts by over one-half billion. In particular, those projects with greater development costs and/or lower net capacity factors received substantially higher benefits from the cash grant than the current PTC.
To keep the table simple, we did not apply a 7.5% discount rate to the production tax credit. If we had, the monetary differences of the two programs would have been more stark since the cash grant is received at the start of the operational life of a renewable energy project.
Comparing the Subsidies
Comparing the Subsidies
Around the time ARRA was passed, researchers at Lawrence Berkeley National Laboratory provided an academic comparison between the production tax credit and the ITC/cash grant from the perspective of a project developer/owner. The authors claim that the programs are — at least in theory — equivalent but offer a quantitative financial analysis to determine which program might provide the better financial option based on project characteristics. The study looked at total installed project costs ($/kilowatt) and net capacity factor and calculated the difference between the two subsidies.
Tables 2 and 5 from the report show the net value of the ITC/cash grant for wind and geothermal respectively. For wind, the report concluded that “under most capacity factor assumptions, projects that cost $1,500/kW or less are likely to receive more value from the PTC, while projects that cost more than $2,500/kW are likely to be better off with the ITC [cash grants].” For geothermal the report found “the PTC provides more value in nearly all cost and capacity factor combinations examined.”
While we do not doubt the arithmetic used, the range of project costs considered do not reflect the market and leave the reader with a sense that the PTC is an equal or better benefit than the cash grant. For example, wind project costs were assumed to range between $1500/kW and $2500/kW, yet most onshore wind projects built since 2009 are at least $2200/kW and many cost more than $2500/kW. Offshore projects are double at $5000/kW. The authors placed geothermal project costs at under $6000/kW, but typical project costs now start at $6000/kW. Net capacity factors for wind ranged from 25% to 45%, representing generation levels much higher than actual and forecasted for the projects we reviewed, including offshore wind.
There are other qualitative benefits under the cash program which shift the rewards to wind and geothermal developers while laying project debt and risks at the feet of American taxpayers. For example, the production tax credit is dependent on project performance; the cash grant is not. This has the effect of eliminating performance risks for the developer. If a project’s net capacity factor is marginal the public still grants the cash and projects that would normally not meet financial thresholds requirements are apt to get built anyway. The Section 1603 program substitutes government payments for private investments after which the government just walks away.
An Addicted, Bubble Industry
Upfront cash grants have only served to grow the industry’s dependency on federal subsidies and in return, developers have minimal incentive to negotiate lower prices with suppliers and no financial obligation to meet claimed capacity factors. The speed at which the industry became reliant on this new stimulus should not surprise anyone.
However, there are cheaper, much more effective opportunities for achieving clean energy goals. Instead, we have succeeded in adopting a policy that drives up construction and energy costs while at the same time eliminating any incentive to build projects that can meet the highest performance standards. In fact, the more expensive a project is to construct the better for vendors, contractors and developers.
It doesn’t stop there. For intermittent resources, higher construction and operational costs also push up energy prices since there are fewer hours of operation to spread the inflated costs over. Power purchase agreements for onshore wind are at least two times higher than traditional sources of generation. Offshore wind agreements are prices at four times that of fossil fuels.
Budget Cuts, Anyone?
If Congressional leaders are serious about cutting government waste in the discretionary budget, green energy subsidies deserve another look, beginning with the Section 1603 program. The incentives in place today go in the wrong direction by rewarding higher construction costs, higher energy pricing, and marginal to poor performance.
——————————————
About the authors: Mr. Short is an independent consultant with a practice that specializes in renewable energy in the New England states. Among his clients are wind, solar, hydroelectric and biomass generators. Ms. Linowes is Executive Director of the Industrial Wind Action Group, an organization focused on the policies and costs of deploying large-scale renewable generation. The viewpoints of Mr. Short and Ms. Linowes are solely theirs and are not necessarily the viewpoints of their clients.
————————————–
[1] The federal production tax credit (PTC) was authorized by the Energy Policy Act of 1992 and amended over time. The subsidy provides a 10-year, inflation-adjusted production tax credit for power generated by certain types of renewable energy projects, including wind, biomass, geothermal, and other renewable fuels excluding solar. The inflation-adjusted credit is currently at $21/MWh. To qualify for the PTC, the power must be sold to an unrelated party.
The cash grant program under ARRA creates a new subsidy, administered by the Treasury. The program provides grants covering up to 30% of the cost basis of qualified renewable energy projects that are placed in service in 2009-11, or that commence construction during 2009-11 and are placed in service prior to 2013 for wind, 2017 for solar, and 2014 for other qualified technologies. The Treasury is required to make payments within 60 days after an application is received or the project is placed in service, whichever is later. http://eetd.lbl.gov/ea/emp/reports/lbnl-1642e.pdf
On the whole I agree that performance based incentives are preferred over capital based incentives. I have a couple of picayune nits with your post. First, you seem to imply that the charts from LBNL are not valid because they don’t cover the entire range of $/W and capacity factors. At least for wind, the general trend is very clear and in both your scenarios, lower capacity factor and higher costs, the ITC is going to dominate.
Second, there were approximately $2.6 billion in ITC payments in 2009 or about 0.4% of the $704 billion included in that bill or 0.17% of discretionary spending. If Congressional leaders are serious about cutting discretionary spending, they will spend about 3 and half hours thinking about green energy subsidies since that it the proportion of a work year equivalent to the proportion of the federal budget.
Jam, Thank you for your comments.
We do not distrust the accuracy of the LBNL charts. But the charts might mislead readers into believing that non-discounted governmental outlays under the PTC were typically more or roughly equivalent to the ITC cash grants. We did not have to look hard to find projects whose costs exceeded $2000/kw for wind, for example, and/or net capacity factors were at or under 30%. The one-size-fits-all standard applied under the cash grant program is clearly inappropriate.
According to the Treasury department, Section 1603 cash outlays since the program began in 2009 total $5.8 billion with the bulk of that money awarded in 2010. If congressional leaders are looking at eliminate $100 billion from discretionary spending as reported, the Section 1603 program and ethanol subsidies taken together should be an easy 10%.
–Lisa Linowes
Lisa, thank you for your response.
I don’t think that the charts are misleading. They are, in fact, exactly what you are, I believe, against: displaying which program (ITC or PTC) will make the project more money. To interpret them as “roughly equivalent” would be to misunderstand their intent indeed.
Another minor point – the LBNL study was published in March 2009. The price of wind had dipped and begun to rise again around that time. The average price two or three years ago was actually below what it is now, so they had the unfortunate timing of gathering data near the nadir. (Those are my memories of the price curve. I would have to look up the data to be more exact. In any event, I think the general concept is useful – it used to be cheaper than it is now.)
My understanding of 1603 is that it simply allows the project proponent to take the 30% ITC as a cash grant as opposed to tax credits. Thus, eliminating 1603 wouldn’t save all of the money but simply redirect it into tax shelters. You would have to do away with the ITC entirely to save that money. (my basic understanding – I would like to be corrected if I am wrong.) The perversity of 1603 is that it actually makes the subsidy more efficient in that most developers can’t take advantage of tax credits directly so they have to spend a lot of money on lawyers to set up these complex entities that can take advantage of the tax credits.
If they want to save $100 billion, they could just implement SecDef Gates’ proposal to shed $100 billion from the DoD budget and be done.
Regarding project costs, Wiser and Bolinger (LBNL report cited) were well aware of the upward trend which began prior to 2008. Their 2008 Wind Technologies Market Report acknowledged continuing increases with this statement: “The average reported cost from a sample of more than 3,600 MW of projects likely to be built in 2009 is $2,120/kW, or $205/kW higher than for projects completed in 2008”.
The tables are fine as an academic exercise. However, given the facts as known in 2009 the ranges were misleading at best. The Section 1603 grants are theoretically equivalent to PTC outlays only under very narrow circumstances. Unfortunately, there’s no explanation for why the 30% was adopted for all projects nor is it clear why people believe the two programs deliver ‘roughly’ the same benefit.
I am not sure I understand your statement that the 1603 “allows the project proponent to take the 30% ITC as a cash grant as opposed to tax credits.” Do you mean they can take the PTC? If the Section 1603 were eliminated for wind, geothermal etc. the projects would be eligible for the PTC. And to the extent that the PTC is performance based it forces more efficiencies into the system.
Actually, the perversion of 1603 is that it is driving up project costs and energy prices. Add in the DOE loan guarantee program and you introduce reckless lending based on the assumption that the taxpayers will cover the risk. This is a repeat of what happened in the 1980’s. The PTC was introduced in 1992 to correct for the distortions created by the policies then.
The federal business energy investment tax credit available under 26 USC § 48 allows corporations to obtain tax credits worth 10%/30% (depending on the technology) of expenditures for developing eligible energy technologies. This program is authorized for systems placed in service before December 31, 2016.
Section 1603 simply allows for developers to take a cash grant in lieu of tax credits. If section 1603 were eliminated (allowed to expire), then all projects eligible for 1603 grants would have to take the 30% as tax credits instead of simply getting a check from Treasury. Thus, eliminating 1603 doesn’t “save” $5 billion. It would save something but nothing approaching the full amount of the program.
In any event, I get what you are trying to say, I’m just not sure you are saying it 100% accurately.
Jam, my apologies for the error in my post regarding the 30% ITC. Wind is certainly eligible. The important difference is that under the cash grant, the treasury is financing projects with debt. Under the 30% tax credit, it’s deferring revenue but the private sector is financing the project.
–Lisa
Jam,
In reply to your first comment, Section 1603 payments are substituting government payments for private investments. I doubt sriously if you could get industry to agree to the terms offered under Section 1603. Rather than make renewable energy stand on its own two feet, we here are providing another crutch to hold it up. Worst, we are supporting certain projects that the private sector would not touch with a “ten foot pole.”
The county’s budget has many govrnment programs that should be scaled back to a “realistic” level or even eliminated. If you only look at “big” programs for cuts, I am afraid that you will miss the forest for the trees. I surely hope that our elected officals are willing to “stop, bend over and pick up” several hundred million dollars in poorly spent government expenditures every time that the opportunity presents itself.
On the LBL graphs, I found them “out-of-date.” The range of capital costs starts at a low number and does not show the current price trends. For example, for offshroe wind, the charts are not even close on the capital costs. The use of a 45% outlying capacity factor for wind is another major distoration. Nonetheless, the charts do show one trend that high capital cost, low capacity factor renewable projects benefit more under Section 1603. I am reasonably sure that, if Congress knew that ths law would encourage the construction of such below average renewable energy projects, it would have not been enacted as written. Instead, reasonable capital costs and capacity factors requiremetns would have been written into the statute to prevent the waste of our tax dollars.
Thanks, Bill, for introducing more reality here. The capital cost of a 100MW onshore wind project today is about $350 million–and climbing. But the problem is not just the capacity factor for wind; it is also that all this subsidy coddles a technology that cannot produce effective capacity or controllable power.
The lost opportunity costs of this boondoggle are enormous, since it has no real future, likely produces negative jobs on the whole, provides almost no value added revenues, and must raise the price of electricity while straining the infrastructure and compromising reliability and system security.
I find this thread troublesome because I essentially agree with the thrust of the article but find that it, along with the comments, are rife with inaccuracies and misleading statements.
I always find it funny and a bit strange when people talk about an energy technology “standing on its own two feet.” It would be a unique technology indeed that did that.
On offshore wind – while you are correct that the LBNL charts don’t cover the cost of an offshore wind project it would be absurd if they did. There are no offshore wind projects currently being funded under either of these programs, none scheduled to be started before these programs expire, and only one, Cape Wind, that is even close. So in all honesty, what would the point of including those price points in this chart?
As far as capacity factors, why is 45% a distortion? This chart is for individual projects, not for the entire U.S. fleet of turbines. It is certainly within the range of possibilities for a single project to have a capacity factor above 45%. In fact, it is within the realm of _technical_ capabilities for many wind projects, it just wouldn’t be economical.
Jon – do you have a reference for your $350 million? Unless there are extenuating circumstances (e.g. on an island in the Aleutians), I can tell you that is simply not the case. $3.50/W? I’m working on a 3 MW project right now that has a $10 million firm-fixed price contract. That’s $3.34/W with no economy of scale.
JAM:
Speaking of errata, and given all the wind installations now hiccuping around the world, please identify a wind project that has maintained a 45% capacity factor over, say, a three year period. Although anything is possible (at the quantum level), such an individual enterprise, statistically, would be vanishingly remote. Indeed, as Germany shows, more wind projects would generally push the average aggregate wind capacity factors downward. And the mode would cluster around 25%. As it does in the USA. Still, for all that, higher aggregate capacity factors would cause greater problems for integration, given the increased volatility–at the cube of the wind speed along the narrow speed range allowable.
Any capacity “credit” for wind is a statistical charade, since the random nature of its fuel source makes any future production unknown. Wind can ONLY BE SPORADIC SUPPLEMENT THAT ITSELF REQUIRES A GREAT DEAL OF SUPPLEMENTATION. And, hey, let’s not forget the added costs of all that new transmission and voltage regulation essential to bring wind to–ah–market. To equate wind with any conventional power source, that is, to give it real capacity, let’s factor everything necessary–entangled conventional generation, transmission, voltage regulation, etc–and add these “costs” to the table.
This kind of discussion belongs to what I call the Emperor’s New Clothes Group. What is really happening is that, with wind, the grid is taking on more instability, which can only be handled by increasing conventional stability controls, either at the generation/regulation level or at the demand level–or both, with rippling consequences.
Scientists would ask, why do such a thing? Engineers, on the other hand, form a committee that rationalizes it, in the process creating a Rube Goldberg patchwork quilt of “solutions,” a la the old Johnny Cash song, One Piece at a Time….
As for the source for the $350 million capital cost for 100MW of wind, it was a wind ad in Ohio last year. I’ll send the link along when I find it.
As promised, here’s a link from Everpower Wind:http://www.power-technology.com/projects/buckeyewindproject for the proposed 380MW wind project in Ohio. At the same time, curious minds might want to look at William Tucker’s figures comparing the capital costs of wind with nuclear:http://tinyurl.com/ykm5yp3.
1. The Lemvig, Denmark plant had capacity factors of 48%, 45%, 45%, 50%, 45%, 46% over the past six years. So, what exists must be possible. My point was simple: Showing 45% on the top end of a generic capacity factor chart is not “a major distortion”. I didn’t comment on the likelihood – very rare indeed. But, again, the chart was for individual projects, not aggregate numbers. If it were for aggregate numbers, I would not hesitate to call it a major distortion and would be proclaiming it much more loudly and vehemently than either yourself or Mr. Short.
2. The link you provided for the Buckeye project indicates that the installed cost is $2,170/kW, 61% less than your $3,500/kW and squarely in the middle of the LBNL chart.
3. I’m an advocate of nuclear power. I’ve never understood the point of arguing whether nuclear is cheaper than wind.
Let me start over. I think that this is a great argument:
—The ITC is given out willy-nilly regardless of the viability of the project
—Capital based incentives like the ITC give the market wrong signals because they incentive “cheap” over “good”.
—At least the PTC is performance-based and rewards good projects
I think that Ms. Linowes and Mr. Short’s wild accusations and bizarre conclusions only detract from the core of their argument that the Section 1603 renewal was a bad idea for everyone.
PS: you are working with the wrong engineers.
I’m not going to engage in further badinage about this, JAM. The Lemvig circumstance is such an extreme outlier that it virtually proves the rule laid out by Linowes and Short.
As for the Everpower link, $380 million for 135MW of zero capacity may be in the middle of surreality; but it’s not my idea of worthwhile.
So, yes, let’s join the effort to get behind nuclear. But let’s not let wind into that conversation, since wind promotion has greatly subverted the effort to give nuclear the political legs it needs to move forward. Virtually every politician and their corresponding wonks believe that wind can displace nuclear, while most “journalists” feel the same way. Until nuclear proponents themselves begin to diss wind, the latter will serve to distract from, if not eviscerate, the case for wind.
As for economists, I believe they can provide context but rarely predictive power. Consequently, I have chided a number of economists to make proper comparisons by accounting for all salient variables.
Cheers! And good luck.
Agreed, sir, as to the badinage. As for wind, we will have to agree to disagree. I think that it has a place and that the capacity and variable issues can be overcome with a 21st century grid as opposed to the 19th century grid we currently have. While I agree that nuclear has much more potential to provide the levels of power (energy!) the world needs over the next 50 years, it is still a hell of a lot harder to get a job in that sector in the U.S. So until then, we muddle forward and do what we can.
As I said, Mr. Miller, wind is such a dysfunctional technology without storage. Yes, engineers can Rube Goldberg a place for wind at great cost in–uh–a 21st century grid, both in carbon emissions and dollars, putting the entwined goals of affordability, security, reliable at risk, as is the case in Germany, Texas, California.
Dystopean muddle is surely what we’ll get if capacity-less wind becomes a staple in a modern “diversified” energy (archaic power) portfolio. And if you think wind jobs justify this scam, consider the jobs lost that could have accrued supporting capacity producing generation, as Jonathan Lesser suggests in the next post. As China becomes the leading wind manufacturing base for companies like Siemens and Vestas, desperately trying to find foreign markets in the US now that the European wind mess is crapping out, let’s find wind work in Beijing.
Indeed, the lost opportunity costs are one of wind’s most prominent victims.
Wind as a bridge to nuclear is a ludicrous concept, at almost every level of consideration, beginning with the contrast between premodern and ultramodern power. What bizarre bookends! Harry Potter partners up with Neils Bohr as they float magically upstream on the USS Smartgrid. Perhaps James Cameron will feature them in widescreen
3-D.
Thank you for continuing the debate. I appreicate JAM’s reiteration of our core complaints with the cash grant program while amused that we’ve made “wild accusations and bizarre conclusions”. Regarding offshore taking advantage of the program, we encourage readers to review the dockets for Cape Wind and Deepwater Wind.