U.S. Renewables – Current and Potential Output
By Stanislav Jakuba -- May 4, 2021Ed note: This article overviews the growth of renewables over the last 20 years from the U.S. Department of Energy’s Annual Energy Review. For convenience, the DOE tables are converted to watts (W), in its billion multiple the gigawatt (GW). The same unit for both generation and consumption enables straightforward comparisons among various efficiencies, capacity factors, site factors, etc. Conversion factors such as Cal, cal, joule, Btu, Wh, each per second, hour, or year, is defined at the end. [1]
“The wind and solar industry claims employment … at about 250 000 jobs. The relative productivity per employee is thus 7.5 kW with solar, and 32 kW with wind. Compare that to 1,300 kW with fossil fuels, and 2,000 kW with nuclear.”
The U.S. Department of Energy (DOE) lists six significant sources of renewable energy: Wind, Solar, Hydro, Wood, Waste, and Geothermal. Here, solar is the sum of photovoltaic (PV) and concentrated-solar (C-S) plants.
The two graphs below show U.S. electricity generation from those six sources during the last two decades: Wind and Solar (W&S) on the top, and all the others, Hydro, Wood, Waste, and Geothermal (H&W&W&G) on the bottom. All but geothermal provide only one form of energy, electricity; geo yields heat in insignificant amounts.
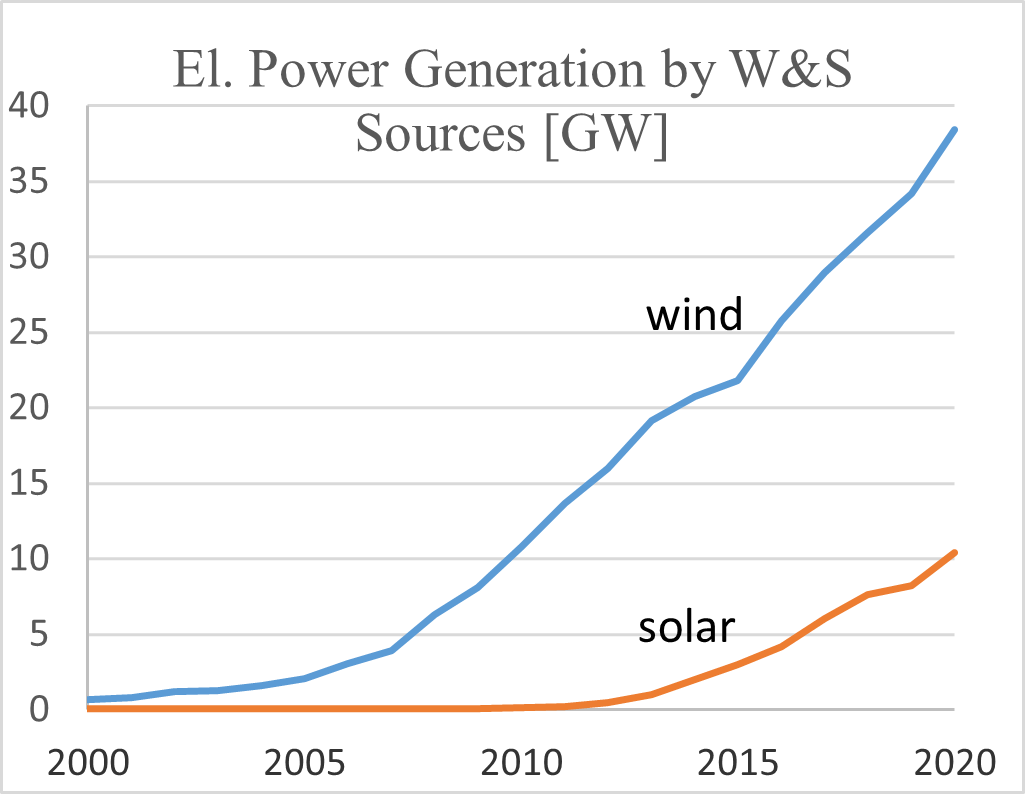
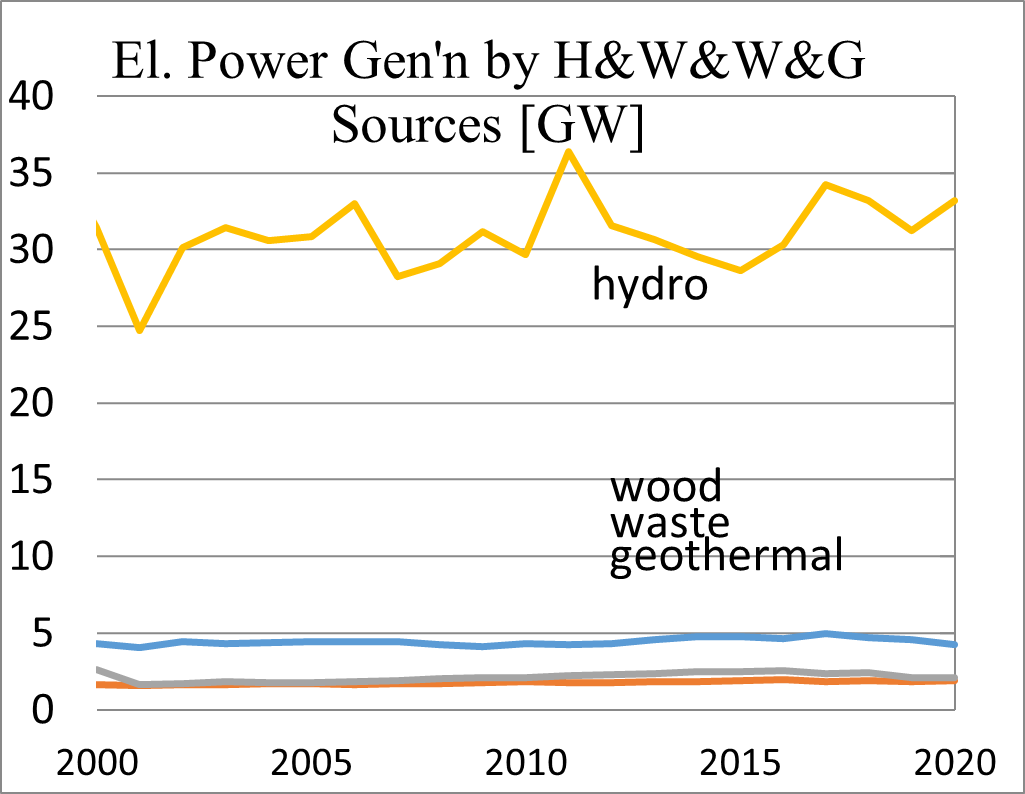
A quick glance at the charts reveals the upward trends in the top graph and near horizontal, no-growth trends on the bottom. The scales are identical in both charts.
Will W&S continue the recent trend in the future? Probably not, because they are productive for only 20 years. A portion are nearing that time limit already, meaning that a percentage of new plants will only be replacing the aged ones, and not adding capacity. The growth/no-growth will be a political decision, not technical.
Wind and Solar (W&S) Electricity Generation
During 2020, wind-generated electricity production rose by 4.2 GW, reaching 38.4 GW total; solar plants added 2.2 GW reaching 10.4 GW. That combined wattage of 48.8 GW represents 10.6% of the U.S. electricity generation of 456 GW from all electricity sources thru that year.
These numbers and the preceding graphs dispute the popular press’s claim that “the US will be fully renewable in ten years.” That prediction ignores not just the growth trend but also the future consumption increases inevitable with population growth, the spread of electric vehicles, industry robotization, and the desired increases in society’s living standard. The latter will not grow unless electricity remains cheap. But “renewable” electricity does and will cost more than that obtained from traditional sources; thus, the opposite would be happening if renewables predominate.
Next are the numbers to compare sources.
A 1970s nuclear plant[1] in Connecticut operated at 2.4 $/W, (adjusted for inflation) during the last five decades. In comparison, an offshore wind farm[2] averaged 21.0 $/W, a cost that is nine times higher.
The nuclear plant is still running after fifty years, at full power day and night, essentially year-round. Wind turbines are dismantled after the usual two decades, their performance diminishing towards the life-end. Throughout their useful life they provided intermittent power only, rendering it unusable in the network without a full capacity back-up. There are several more losses to mention later on.
At present, the almost ten times higher cost of wind electricity has not impacted customers yet thanks to the plethora of subsidies and incentives paid for by taxpayers. Later on, there will be the cost of dismantling, scrapping, and disposing responsibly of all that metal, plastic and glass that is to be accrued every two decades. The end-of-life cost, the dismantling and disposal, is about equal to the cost of fabricating and erecting new mills.
As to the operating cost of those plants, the W&S industry claims employment already higher than either the gas or coal extraction industry at about 250 000 jobs. The relative productivity per employee is thus 7.5 kW with solar, and 32 kW with wind. Compare that to 1300 kW with fossil fuels, and 2000 kW with nuclear.[3]
In recent years, the U.S. primary energy consumption reached 3230 GW of which about 60% was the waste heat from thermal plants. Subtracting that percentage yields the “useful” consumption of about 1500 GW. Judging from the annual output of all W&S plants, it would take a century and half before those renewable sources could generate that much.
But this analysis is somewhat secondary to the more fundamental obstacle: The needed employment in the W&S industry to manufacture, erect, operate, maintain, tear down, and dispose of all those millions of W&S plants five times a century would exceed the presently available US workforce.
Non-W&S Renewable Sources:
The second graph above shows the output of the three “other” sources: waste, wood and geothermal. The near-horizontal-trend lines there indicate no worthwhile growth in those two decades; the output is basically stagnant at 9.1 GW.
Hydro registered its usual ups and downs, ending at 33 GW. The combined yield of all those four sources at 42 GW is not any higher today than it was two decades ago; actually, if anything, it is slightly lower.
What then is the chance to “up” these non-growing trends? Let’s consider the hydro first:
Hydro Prospects
Increasing hydro’s output would require either more rain or less irrigation. (Dams sometimes provide both power generation and irrigation.) The rain is beyond our control. Regarding irrigation, are we willing to cut down on domestic-grown veggies?
Then there are proposals for building more dams and equip current irrigation and flood control dams with turbine-generators. For that, there is limited number of sites suitable and some of those could not be exploited for environmental concerns.
As for the retrofitting, it offers too low a return on investment, if any, which is why engineers in the past did not equip the dams with generators at that time when it would have been much cheaper, electricity more expensive, and environmental restrictions fewer. The builders undoubtedly considered also silting, the ultimate death of all dams, and a rather quick one with the small ones.
Wood, Waste, Geothermal
“Other” sources – wood, waste and geothermal (W&W&G) – provide steady supply from year to year, unlike the wiggling hydro, but each is minuscule by comparison as shown.
Besides, although wood and waste are renewable sources they cannot be classified as clean: their burning emits CO2 as well as “real” pollutants such as those that one can smell.
Thus, the legitimately clean sources in the “Other” category are just two: hydro and geothermal; they yielded 33+2=35 GW in 2020. That output has been averaging at that level for decades; there is no prospect for it to grow in the foreseeable future.
Prospects for 100% Clean Energy
To achieve that, W&S would need to generate hundred times the present generation, an impossible goal. Then, should electric cars become ubiquitous, they alone would be consuming another 110 GW[4] thus increasing the goal for the country to 573 GW.
This implies building enough W&S plants to double, actually triple their current output if we realize that the DOE/EIA numbers are lacking; yes, they do represent the numbers utilities report. But those numbers had not been corrected for the input-energy that all those sites receive from the grid and from fossil fuels.
External Fuel
This external feed is needed nightly with solar plants, and, with wind plants when it blows too little or too much. Then there are also maintenance and repair interruptions that consume external energy not accounted for.
During all those times the sites consume energy such as from diesel fuel, natural gas, and also from electricity drawn from elsewhere. That combined energy is not subtracted from the site’s output before reporting to the DOE statistics.
To include those, we need a correction. Let’s call it the Site Factor or SF. (EIA uses the term Plant Utilization Factor, or PUF). I selected SF as it includes all the energy consumed in selecting, building, accessing, and operating the site.
As an example of the SF, a wind farm powered by the optimal wind endlessly will have SF = 1. Similarly with the solar plants. With the usual interruptions, such as for maintenance, repair, and the lack of wind or sun, the sites consume energy obtained from outside sources such as from the grid, from burning diesel fuel, natural gas, propane, gasoline, aviation fuel, etc. Then its SF drops to, say 0.85.
Measured over a year, a site may be producing X GW and consuming Y GW from external sources. Thus, its net contribution to the grid is X-Y; let’s call it Z. The DOE, however, lists the X values, and not the Z ones, in its tables.
As an example, the CSP[5] in Mojave desert consumed about 9% of its reported output internally. Thus, its SF = 0.09. Thermal plants consume tiny amounts by comparison exibitng SFs in the 90-percentile range.
Adjusted for the SF values, the DOE numbers, shown in the preceding graphs, would be several percent lower. How much lower? I have been unable to obtain reliable numbers and suspect that they are known only to the DOE insiders if at all.
Unfortunately, essentially all energy statistics worldwide list the output as if each plant consumed zero outside energy in its existence. That custom was established when thermal plants ruled; their SF was, and still is, negligible. Thus, the unpopularity of this criterion with renewable sources.
But, for a fair comparison among different types of plants and different sites, the SF (PUF) and its value should be acknowledged and included in the DOE/EIA reports. And yes, it is difficult to find the data for the energy input to the plants. If you know of a good way to search for this info, please let this author know.
Conclusion: Too Much Renewables
More than $3 trillion has been spent on the renewable energy effort since 2004, and the figure has now stabilized at about $300 billion for each one of the last six years.[6] For a cost comparison, the earlier mentioned nuclear power plant – another source of clean and green electricity and also heat – cost $4 million, inflation adjusted. Not billions, just millions. Hundreds of them could have been producing power for the money spent on renewables today, making our country and the world cleaner and richer as a result.
As to the likelihood of the W&S output influencing climate change, those 9.5% of electricity, which is 1% of total U.S. energy consumption, is unlikely to influence anything except our pockets. And we have no means of measuring those causes and effects reliably as yet.
Despite this discouraging renewable energy history, documented numerically in voluminous literature, it is politics, not economy, that forces our country and individual states continue year after year to commit us, the tax- and rate- payers, to the goals of producing “20, 50, …. 100 percent of energy from clean, renewable sources in 5, 10 …. 20 years.”
Those goals a being set despite seeing them not met, and budgets going red repeatedly, for a half a century by now. On top of that some proponents claim this energy to mean the US energy overall, not just the electrical portion of it. That would raise the target sevenfold.
—————-
[1] A note on the units in the DoE annual statistics: Those pages list different units for different kind of energy and power thus making comparisons cumbersome and prone to errors. Unified in this report on just one unit, the watt (W) makes comparison instant and less prone to mistakes. For information, 1 GW = 8770 million kilowatt-hours/year and 30 quadrillion Btu/year. The “per year” is implied in the DOE tables, but not stated. This omission in the headings is one reason why there is confusion in converting power and energy numbers. Where just one unit, the watt, should suffice, there is also joule, calorie, Btu, …., and any of them per second, minute, hour, day, or year.
—————————
References:
[1] www.Millstone Nuclear Power Plant complex in CT
[2] www.Vindeby Offshore Wind Farm, Denmark
[3] www.Bloomberg: There Are More Jobs in Solar than Oil and Gas, Coal Extraction in the U.S.
[4] www.masterresource.org/electric-vehicles/energy-usage-cost-gasoline-vs-electric
[5] www.masterresources.org/concentratedsolarplant
[6] www.bnef.com/dataview/clean-energy-investement/index.html