Renewable Energy Sources: Does Their Output Matter?
By Stanislav Jakuba -- April 27, 2017“About $3 trillion has been spent globally on renewable energy since 2004, and the figure has now stabilized at about $300 billion for each one of the last six years.”
This post describes renewable-energy performance in the United States through 2016 as reported in annual reports of the Department of Energy (DOE).[1] The DOE lists six renewable sources: Wind, Solar, Hydro, Wood, Waste, and Geothermal. The term “solar” means the combined output of both photovoltaic (PV) and concentrated solar plants (CSP).
Renewable sources are usually divided into two groups: “Wind and Solar” (W&S), and “Other” (H&W&W&G). Accordingly, the following two graphs show the history of the two groups’ outputs in separate charts: W&S first and H&W&W&G second. A quick glance at both graphs reveals the upward trending lines in the first chart and the near horizontal lines in the second, with wiggles in the line for hydro output caused by differences in rainfall and irrigation demand from one year to the next.
Wind and Solar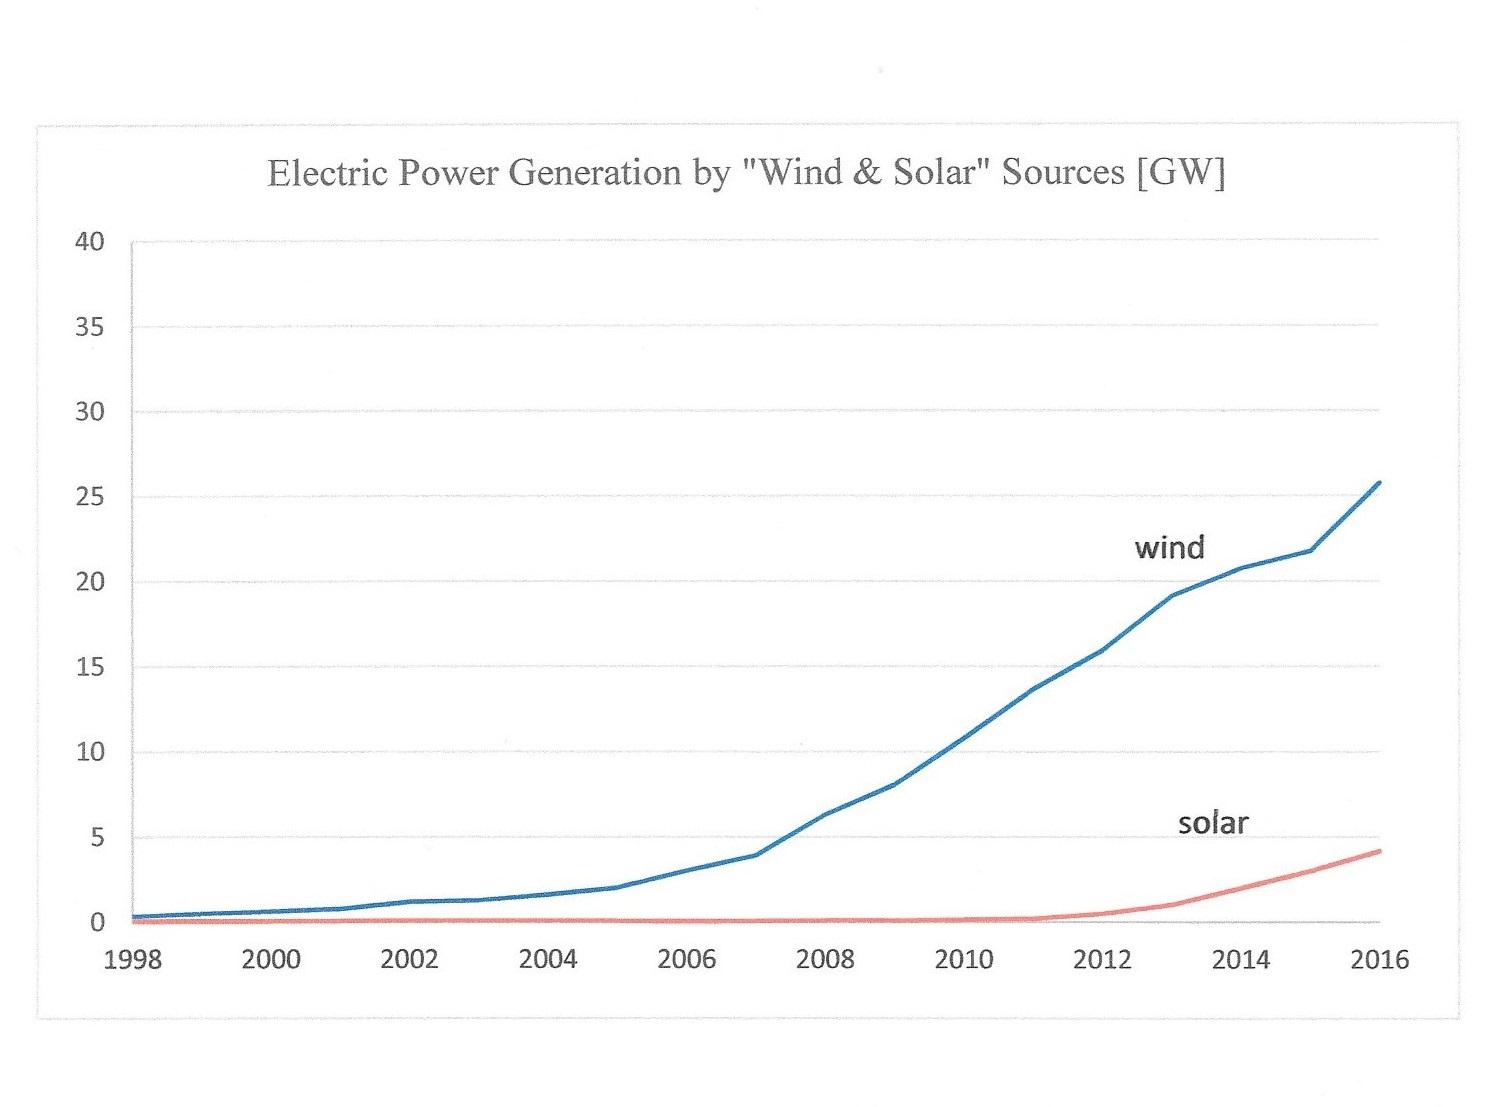
Figure 1. Electric Power Generation by Wind and Solar Generation (in gigawatts)
As shown, the combined wind and solar output in 2016 reached 25.8 GW+4.2 GW*, for a total of 30 GW, a 12 percent growth in one year. But that unusually high growth compensates for the slow growth of the previous year. The decade-long growth in wind power indicates a linear trend of about 2.4 GW/year.
At that rate, it would take some 200 years to reach the 465 GW of the present electricity consumption in the United States. The solar contribution, shown growing 1 GW/year in the last two years, would shorten the period accordingly. As for the US energy consumption of 3300 GW, it would take a thousand years for Wind and Solar to reach that level.
But of course these centuries-long projections would be realistic only if some large-scale storage technology existed, one that was also relatively inexpensive, inasmuch as Wind and Solar electricity alone is already many times dearer than that originating from traditional plants.[2] The cost of operating and maintaining traditional plants—measured per unit of energy produced—is an order of magnitude lower than wind. For example, the difference between an older nuclear plant and an off-shore wind farm is 2.4 $/W versus 21 $/W.
Then there is the limit on how many W&S plants the available US manpower could operate, maintain, tear down, and dispose of. Millions of them, four or five times a century? While also manufacturing and erecting millions of new ones?
The Other Renewables
But why consider just Wind and Solar energy when talking about renewables? The following graph explains.
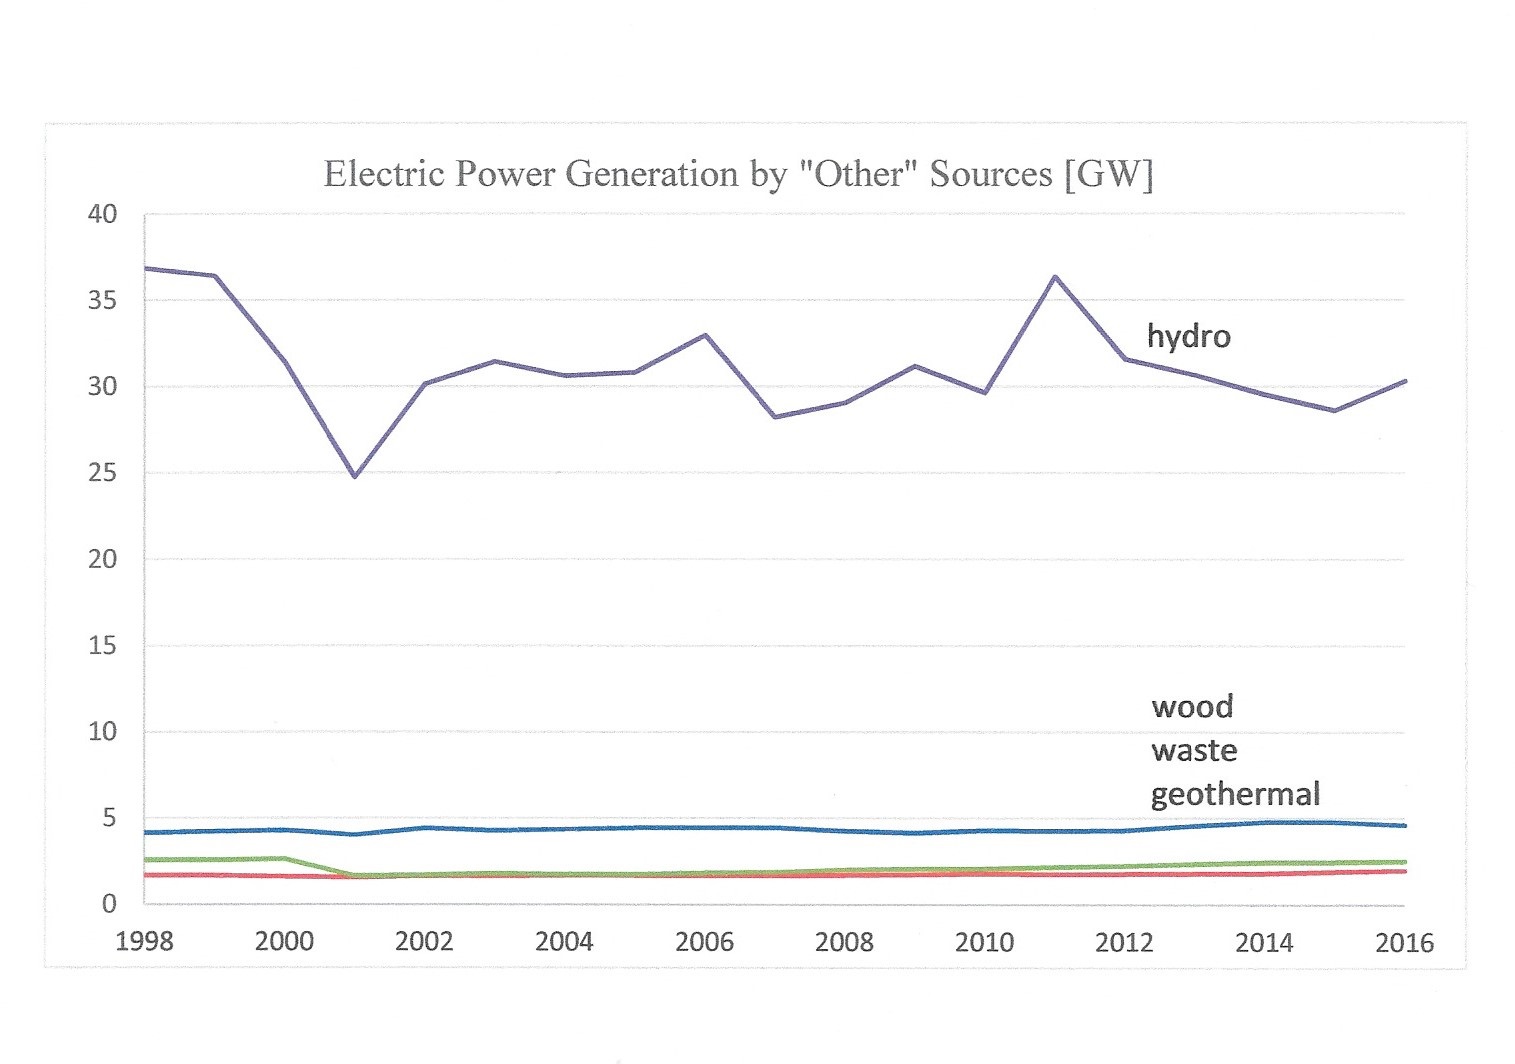
Figure 2. Electric Power Generation by “Other” Renewables (in gigawatts)
Figure 2 illustrates the performance of the “other” four renewable sources: Hydro, Wood, Waste, and Geothermal. There has been no worthwhile upward trend in any of them in two decades. Hydro-electricity did register its usual ups and downs, ending at 31 GW, which is about 7 GW lower than 20 years ago.
Increasing hydro’s yield in the future would require either more rain or reduced irrigation. (Dams often serve both power and irrigation purposes.) The rain is beyond our control. Regarding irrigation, are we willing to cut down on fresh veggies? Or should we build more dams?
And should we equip current irrigation and flood control dams with turbine-generators? The trouble is that the overall return on such investments, if any, would be so low as to be unacceptable. Which is the same reason that engineers in that past did not equip many dams with generators. And that was at a time when electricity was more expensive and environmental restrictions far fewer than today.
Wood, waste, and geothermal (WWG), unlike hydro-electric power, provide steady supply, but it is minuscule in comparison to hydro. Besides, although wood and waste are “renewable,” they cannot be classified as clean sources: their burning emits CO2 as well as true pollutants.
So, the legitimate “clean” ‘Other’ output, Hydro and Geothermal, is 31 GW plus 2 GW, or 33 GW, with hydro contributing 94 percent of the total.
The sum of H&W&W&G output will continue averaging at the same level for the foreseeable future, with hydro’s annual deviations alone causing ripples of a few gigawatts.
It should be stressed that the “renewables” of H&W&W&G cannot be claimed as a result of recent clean energy financing; they existed long before those budgets did. Nevertheless, the DOE considers them to be not only a relatively recent addition to renewables but also growing rapidly. The DOE/EIA annual report contains the following true-but-misleading statements:
Between 2005 and 2015, electricity generation from solar increased 48 fold, from 550 GWh to 26,473 GWh. Biomass increased 18.3% from 54,277 to 64,191 GWh, and geothermal increased 14.1% from 14,692 to 16,767 GWh. (Biomass is “wood” and “waste” in the graphs.)
Media then broadcast those percentages without revealing that the 48-fold increase was from a near-zero value, meaning the result is still small, as it is for the 18.3 percent and 14.1 percent increases. Both lines in the graph are essentially horizontal. The DOE statements are also misleading for because they fail to report the decrease in hydro during the same period—a decrease that outweighs the sum of the increases many fold. The overall decline in the sum of the four is not mentioned in the DOE/EIA report at all.
Looking at the second graph again, notice that selecting the starting point later (say at 2001) would have given a much different growth percentage; this is just another illustration of how misleading statistics can be.
Now look at the third graph. It shows that the combined output of all six renewable sources ends at 68 GW. The “illegitimate” (not clean) W&W lines are included here to make comparisons with the commonly drawn representations easier. Nevertheless, the true, “legitimate” (clean) yield is lower: 68-(4.5+2.5)=61 GW. That is the number to remember.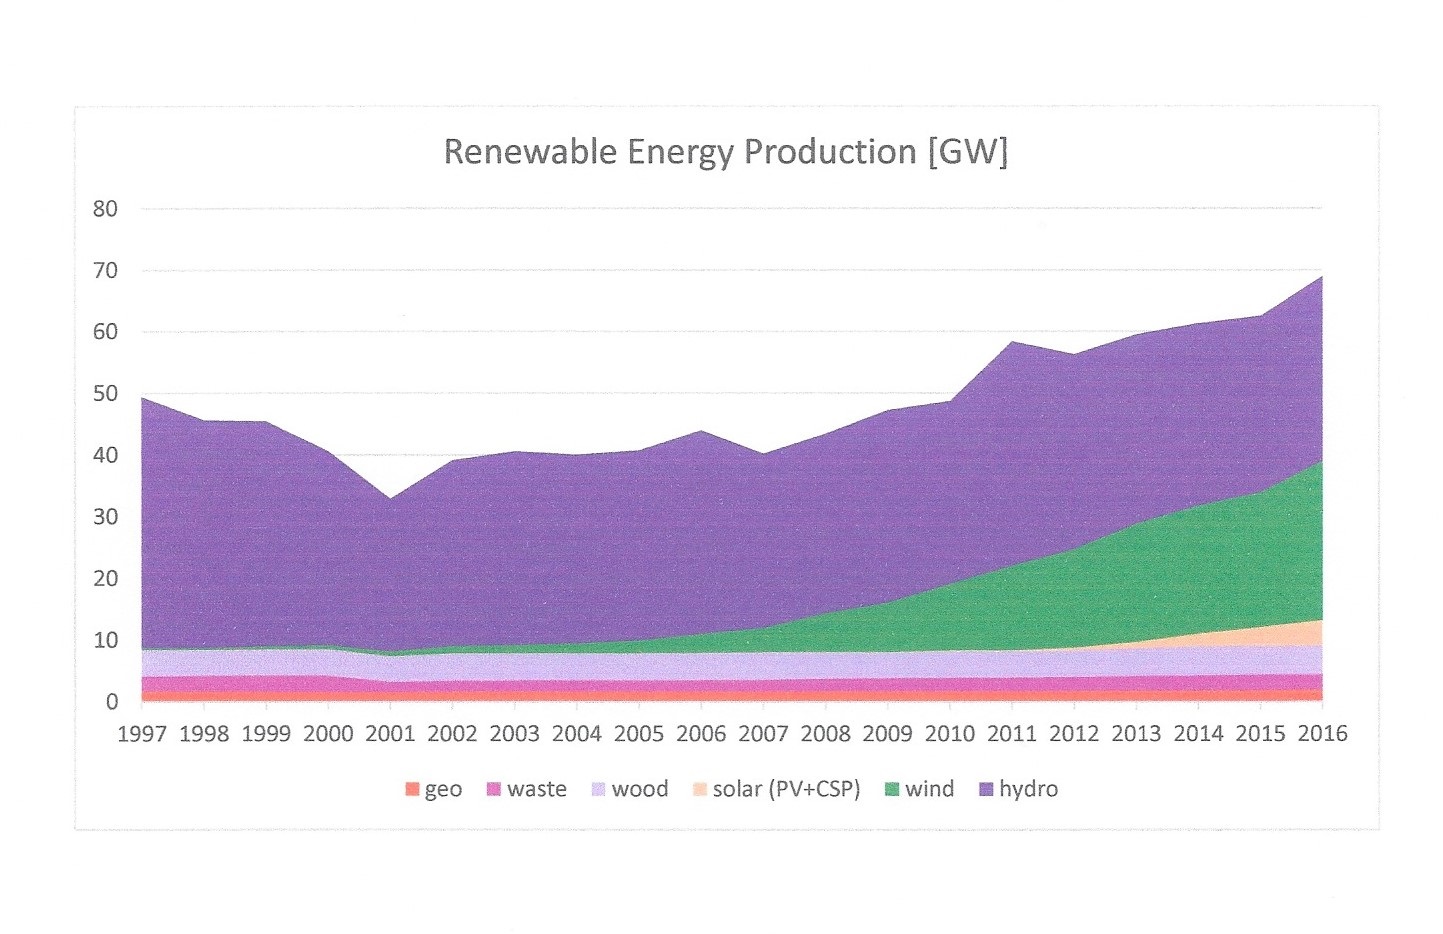
Figure 3. Total Renewable Energy Production (in gigawatts)
To estimate future output, considering that only W&S output is growing, these two sources together would have to be producing an additional 404 GW in order to achieve the 100 percent renewable-electricity generation that is being proposed in some states. Should electric cars become ubiquitous (they will not – see “Gasoline versus Electric Cars”[3]), those vehicles alone would be consuming another 110 GW, lifting the total to 514 GW.
That 21-times greater than present output may be theoretically possible, but the high cost of having W&S electricity replace relatively cheap current forms of electricity would ruin the economy and cause a decline in the standard of living for all but the richest.
Conclusion
About $3 trillion has been spent globally on renewable energies since 2004, and the figure has now stabilized at about $300 billion for each one of the last six years.[4] The return on that investment is the above output of W&S. For comparison, a 1970s nuclear power plant—another source of clean and green electricity, and also heat—cost about $4 million, inflation adjusted.[5] Not trillions, not even billions, just millions. Thousands of them could have been producing power for the money spent on renewable, making our country and the world cleaner and richer today.
As to the likelihood of the W&S output slowing down climate change – not only is it unlikely to do so given the scale of other phenomena impacting climate, but its impact is so tiny that it cannot even be reliably measured. Worse yet, spending those trillions has resulted in the release of far more CO2, pollution, and (waste) heat, than the W&S output prevented.
Despite this discouraging renewable energy history, documented numerically in voluminous literature, our country and individual states continue year after year to commit us, the tax- and rate-payers, to the goals of “20, 50, …. percent of energy to be derived from clean, renewable sources in 5, 10 or 20 years.” That, despite seeing those goals not met and budgets going red repeatedly.
Those over-optimistic percentages and deadlines in the renewable-energy commitments made me write a letter to editor some years ago. It won the “best-letter-to-editor award” from the Hartford Courant for commenting on the then-planned goal of 20 percent of Connecticut energy originating from clean sources before 2010 by simply saying: “It will not be done.”
And it was not done, nor was it done following subsequent such proclamations. We can safely assume the same fate for the currently proposed commitments in cities, counties, states, and even countries, for the upcoming conveniently numbered years of 2020, 2025, … 2050.
—————-
*A conversion to the DoE/EIA power unit: 1 GW = 8,770 million kilowatt-hours per year.
References:
[1] doe.eia annual energy review
[2] http://www.masterresource.org/ivanpah-solar-plant/ivanpah-solar-fail/
[3] http://www.masterresource.org/electric-vehicles/energy-usage-cost-gasoline-vs-electric/
[4] https://www.bnef.com/dataview/clean-energy-investment/index.html
[5] Millstone Nuclear Power Plant complex – history
Amen….
A timely article. Thanks.
I’m confused however by “A conversion to the DoE/EIA power unit: 1 GW = 8,770 million kilowatt-hours per year.” Please point me to a source for this conversion. Google is coming up empty.
Assumes continuous operation at rated capacity. In what alternative reality do solar and wind accomplish that feat?
Ed: I do not follow your comment. Nowhere that I remember do I assume/mention capacity, let alone the nameplate one. What is it that you question? Quote something. Stan
Watt, Kilowatt, Megawatt and Gigawatt are units of capacity to produce; typically, rating plate capacity. A one Gigawatt power plant has the capacity to produce 1 Gigawatt hour of electricity each hour it operates. However, if it only operates 30-40% of the hour, it would only produce 300-400 Megawatt hours of electricity.
A 1 Megawatt wind turbine is capable of producing 1 Megawatt hour of electricity each hour it operates at design conditions. However, it produces 0 Megawatt hours of electricity each hour when it is not turning. When operating at off-design conditions, the 1 MW wind turbine produces greater than 0 but less than 1 MWh of electricity each hour.
I am surprised. Conversion tables abound on the Internet. You have to look for the category “energy/time”, or “power.” EIA tables do not exhibit SI units. My explaining power issues with those units simplify the issues as all the numbers are immediately comparable.
I hope our new EPA administrator reads this article… Although, I assume Pruitt has probably argued this case before he became the new EPA chief. It is the stupid congress that doesn’t get it. In fact they need to amend the Clean Air Act to stop expensive law-suits from industry and environmentalist groups. After 25 years Congress can amend the CAA and catch up with the modern times.
Power is energy per unit time. One kilowatt (kW) is one kilowatt-hour (kWh) of energy per hour. One GW is a million kW.
One GW times one year is one million kW * the number of hours in a year (2424* 365.25 =8766 for an “average” year, which Stan rounded off to 8,770), yielding 8,766 million kWh.
So the power is 8,766 million kWh/year.
This is a great synopsis of the current way the Clean Energy advocates are twisting the data and results, ignoring the fact that neither wind or solar can feed our grid with any stability. Base load power needs to be up and running any time these sources are in use, and the more of them we put online the more base load is needed. Those are facts. We actually need more hydro, nuclear or gas plants to support the “Clean Power”, and then we would not need the wind and solar.
The sad part is that the $3 trillion spent so far has not made us one step closer to the goals being set by non-scientific politicians following the CPP. That $3 trillion should be being spent on new natural gas pipe lines, new high tech nuclear and transmission lines to bring in cheap hydro from Canada. Those projects would employ a lot of people and leave our wilderness environment without industrial wind and solar.
And do we really need to build more dams? Do we really need millions of square miles of wind turbines and solar panels filling up the environment? This reveals the truth, which is that in order to keep the grid at its constant and ever increasing capacity we must have ever more gas and nuke and even coal. The Greens are going to carry the country into bankruptcy if they continually are allowed to have their way.
What, by the way, is the ultimate cause of every bit of this?
It is the false Anthropogenic Global Warming (AGW) hypothesis.
[…] Renewable Energy Sources: Does Their Output Matter? […]
[…] Renewable Energy Sources: Does Their Output Matter? […]
http://www.ocatequista.com.br/blog/item/11630-roupa-de-missa-dicas-pra-nao-irritar-a-doroteia