Wind Integration Realities: The Bentek Study for Texas (Part IV)
By Kent Hawkins -- May 26, 2010[Editor’s note: This is the final post in the series reviewing studies for the Netherlands, Colorado and Texas on (elevated) fossil-fuel emissions associated with firming otherwise intermittent wind power. Part I introduced the issues. Part II showed negated emission savings for the Netherlands at current wind penetration (about 3 percent). Part III extended the Netherland’s experience to the higher wind penetration in Colorado (6%) which demonstrates higher emissions. Part IV concludes with the Bentek results for Texas,which confirms those for Colorado.]
There are a number of relevant, notable characteristics of the 2008 Texas electricity production profile, 85% of which is managed by ERCOT:
- The utility portion of the total electricity production is only about 24% of the total, with independent suppliers providing 57% and CHP installations, 19%. This distribution suggests that ERCOT’s ability to balance wind production is more limited than what might first appear.
- Wind production is 5% of the total (less CHP), but a very large 17% of the utilities portion.
- A large proportion of gas production is provided by independent suppliers and CHP, 45% and 39% respectively, again likely limiting ERCOT’s ability to balance wind with gas.
- The ratio of utility gas to wind production is 192%, which suggests that this is tight if dedicated to wind balancing. This, plus high production from wind at night, explains the high degree of cycling of coal plants required.
Because of recycling events, arguably attributable to the presence of wind plants, the results are the same as for PSCO, that is, there is an increase in CO2 emissions with the presence of wind. In ERCOT, the coal plants produced an additional CO2 emissions in 2008 of about 0-566,000 tons over running stably without these events, and in 2009, an additional 772,000-1,102,000 tons.
Wind Capacity Factor
Based on the information in the Bentek report, the wind capacity factor within ERCOT in 2009 is 22.7%, which is low and likely due to curtailment of wind, as is the case in Germany, which has a similar wind penetration of about 6% and wind capacity factors below 20%. There is notable curtailment in ERCOT as reported by NREL. The DOE/EIA published information for 2008 indicates a wind capacity factor of 25%. The difference could well be year to year variations in the wind regime. A capacity factor of 23% will be used in calculator runs.
Heat Rate Penalty and CO2 Emissions Increase Factor
From DOE/EIA published information, for Texas in 2008, for utility fossil fuel plants only, at ?F=0, this is: [as noted in previous parts of this series ? is intended to be the Greek letter delta, representing a “change in”]
?R = (16,200/93,400) x 41% = 7.1%
For all fossil fuel plants in the system (less CHP) this becomes:
?R = (16,200/265,100) x 41% = 2.5%
Based on the totals used in Figure VI-4 (2009 data) for ERCOT, there might be some suggestion of using independent suppliers to balance wind. The 2.5% value assumes all the independent suppliers are used, which is unlikely. In the absence of more information, the PSCO calculated ?R of 3.3% will be used for the deriving the calculator input for heat rate penalty, which is the same as for PSCO at starting at 35% but adjusted down to 20-25% for the lower capacity factor as used in Figure 4 of the calculator Part V post.
Calculator Results for ERCOT
The resulting calculator CO2 emissions increases are: coal cycling only – 0.7 million tonnes (0.77 million tons) per year.
As for PSCO, a reasonable view is that both coal and gas plants will be involved in cycling at different times. Although coal and gas production are about the same in ERCOT, because wind is strongest at night, coal is more heavily weighted in the wind balancing mix at 67% coal and 33% gas. The total ERCOT gas mix is heavily weighted to CCGT production, but for wind balancing about an equal split with OCGT is assumed. This means more production from existing OCGT or possibly some CCGT plants being run as OCGT. Frequent cycling of CCGT plants damages the HRSGs so single stage operation is needed. In summary, more OCGT production is used than would be required if wind was not present in the system. The emissions increase over normal coal/CCGT operations becomes 2.3 million tons per year. This is an aspect not addressed in the Bentek paper. Table 1 shows the comparison of the Bentek results with the calculator.
Table 1 – Comparison of Bentek Study and Calculator results for ERCOT
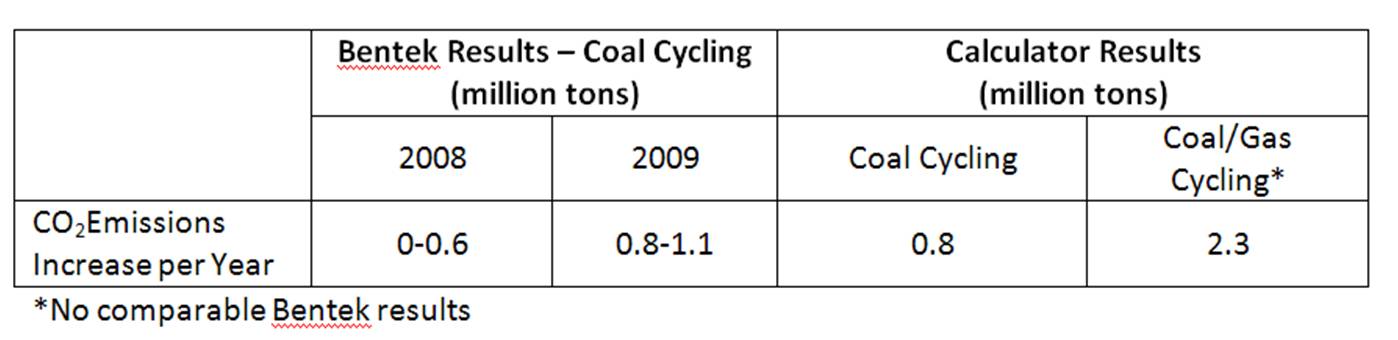
The calculator results directly comparable to the Bentek findings are very close to Bentek’s. It should be emphasized that this is not likely the whole story as the gas cycling impacts should also be taken into account.
Summary of Dutch and Bentek Studies
Table 2 provides an overview of the findings of this series on wind integration. In summary, the Netherlands experience is that at wind penetration of about 3% the fossil fuel and CO2 emissions saving is reduced to zero. As wind penetration is increased, the Colorado and Texas experience shows that the savings become negative, that is, fossil fuel and CO2 emissions are increased. The integration of all the considerations for the three approaches is complex and necessarily simplified. Any additional insights are welcome.
Table 2 – Summary of the Three Approaches Analyzed in this Series
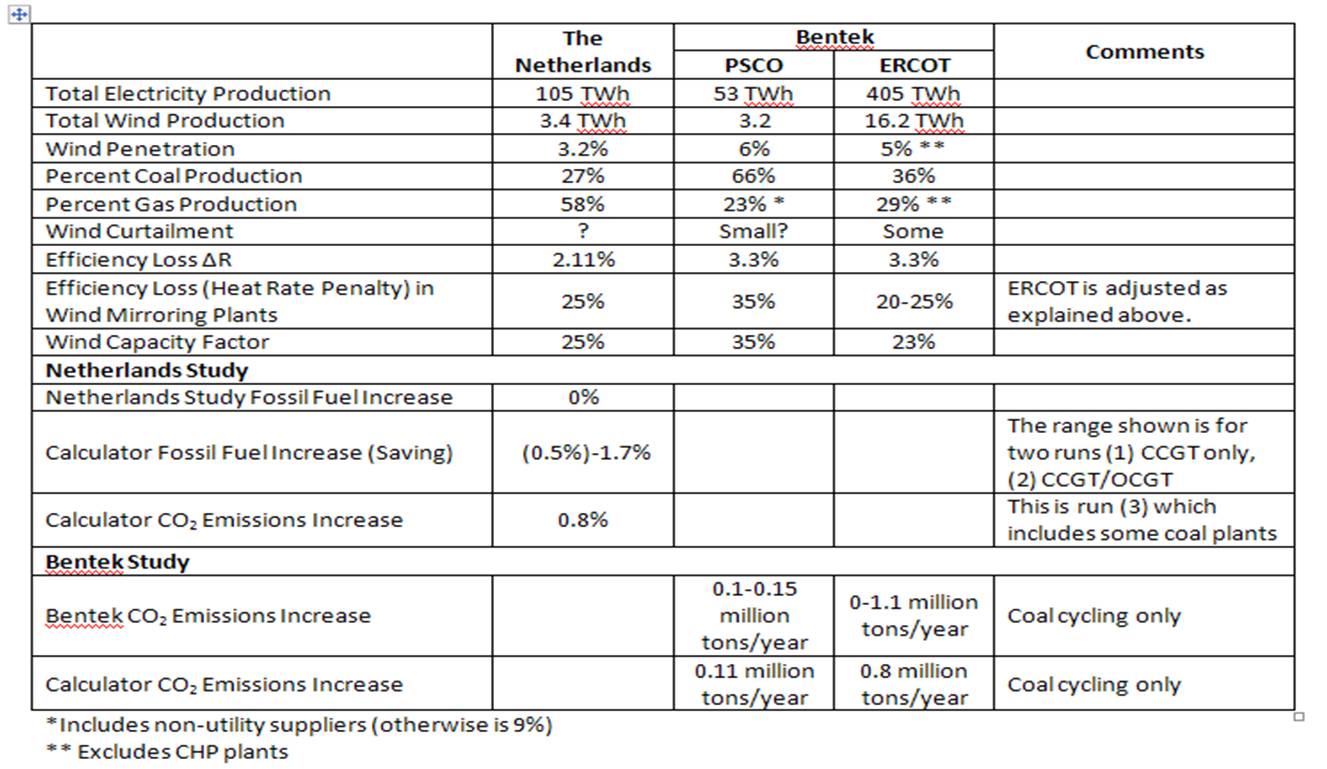
There is a notable consistency among these three approaches. Look for more studies, based on actual experience, to emerge from countries not now dependent on foreign markets for export of wind turbine products and services, confirming the inability of new renewables, especially wind, to contribute to the reduction in fossil fuel use and CO2 emissions reduction in electricity generation. In the absence of comprehensive, objective and transparent studies that finally settle the matter, policies in support of new renewables should be severely curtailed.
In addition to Kent’s concluding recommendation, which echos the sentiment of Le Pair/De Groot in The Netherlands, I urge that all subsidies, particularly at the federal level, be indexed to independently, transparently measured net reductions in CO2 specifically caused by wind technology in the production of electricity.
As I stated in a previous comment, Kent Hawkins’ work here is extremely important and should be broadcast widely, if only to challenge the soporific stance of FERC and other regulatory agencies, which have turned a blind eye not only to the limitations of wind but to the way wind technology corrupts modern standards of reliability, affordability, and grid security.
This series of posts on the new studies raise a question: where have the DOE labs been in investigating the intermittency problem of wind (and on-grid solar) in terms of fossil-fuel backup?
Why wasn’t this problem recognized and debated a decade or two ago?
[…] […]
Robert the National Renewable Energy Lab treats itself as a Lobbying arm of the wind industry. The NREL does not acknowledge any problem with wind that might lead the public to questions of the capacity of wind to resolve our energy problems.
A correction to the text has been made. The formula from the Netherlands study for ΔR is valid at the point that the fossil fuel savings become zero (ΔF=0). The calculation of ΔR is reasonable because the Bentek reported CO2 savings (and consequently the fossil fuel savings) for ERCOT is very close to zero (-0.24%).
[…] http://www.masterresource.org/2010/05/wind-integration-realities-texas-iv/#more-10008 […]
[…] those of my fossil fuel and CO2 emissions calculator for the same conditions. The brief summary in Part IV of the series is expanded upon here for clarity of this game-changing […]
[…] of Colorado and Texas by BENTEK Energy, LLC, in addition to a study of the Netherlands, found the coercion of utilities […]
A new study conclusively answers this question, and it turns out that wind energy’s emissions savings are not undermined by additional cycling at fossil-fired power plants:
http://www.nrel.gov/electricity/transmission/western_wind.html
Michael, Nice try.
Because of their highly variable and random production over short time periods (minutes), wind and solar PV cannot be realistically or properly analysed using statistical methods to evaluate real time events. This statistical approach hides the real time impacts, and electricity systems must balance load and generation in real time (again minutes).
To illustrate, I have done some analysis of the BPA wind performance, at 5 minute intervals (which still masks some greater volatility) and 14% wind penetration in energy terms, which shows that, statistically speaking, the standard deviation of the increase in ramping of load minus wind versus load alone is 26 MW. However, the real time effects show over 8 instances per day (one every three hours on average) of over more than three times this level (three standard deviations), with one event per day (on average again) in excessive of 200 MW which is over 8 standard deviations. Note that the ‘averaging’ over time of these events does not mean that their occurrence cannot be more concentrated in real time. There are more ‘black swans’ in wind production than statistical approaches are designed to handle, if you want to avoid severe consequences. For real world experience, talk to the financial industry about this.
Statistical analysis is based on the assumption that the distribution of 99.7% of all events is contained within three standard deviations. Therefore the BPA analysis shows that three standard deviations should exclude only 7 ‘black swans’ or extraordinary events. Over the period measured there were 52 or over 7 times this number. This shows that it is questionable and risky to apply statistical analysis here in connection with our electricity systems on which so much of our well-being depends.
For the purposes of planning reserve requirements based on the use of reliable, dispatchable generation plants in the electricity system (and wind and solar PV are neither), statistical methods have some value.
Having said all this, statistical analysis of wind and solar PV performance may have some value if limited to providing some indication of the relative effect of their use (1) between jurisdictions, and (2) within a jurisdiction between time periods and wind and solar PV penetrations, for example. But, and this is important, it is not valid for the determination of absolute values, especially actual reserves required, stress on wind balancing plants and, importantly, emissions.
I should introduce you to the ‘Statistics Professor’ who some time ago in a comment tried to convince me that statistical methods are applicable in the analysis of real time wind performance, claiming that the ‘square root of the sum of the squares’ formula properly captures the real time effect of combining two random series – in this case the net of wind and load and load alone. Perhaps you already know him, being of like mind on this issue.
In short, you have neither proved your case, nor disproved mine.
It looks like this issue is not going to go away, so for a more complete response I will have to look at completing my BPA analysis when time permits.