Climate: The Real ‘Worrisome Trend’ (Part I: Faulty Science)
By Joe D'Aleo -- May 11, 2016“Government reports, writers of opinion pieces, and bloggers posting graphs purporting to show rising or record air temperatures or ocean heat, are misleading you. This is not actual raw data. It is plots of data that have been “adjusted” or “homogenized” (i.e., manipulated) by scientists – or it is output from models that are based on assumptions, many of them incorrect.”
My philosophy when I taught college was to show my students how to think – not what to think. As Socrates said, “Education is the kindling of a flame, not the filling of a vessel.”
Data is king, I told my students, and models are only useful tools. Any model’s output or any theory needed to be examined and validated using data–and even then used with caution.
The great Nobel Laureate Physicist Richard Feynman taught students that if a theory or educated guess or hypothesis disagrees with experiment or data or experience,
it’s wrong. In that simple statement is the key to science. It doesn’t make any difference how beautiful your guess is, it doesn’t matter how smart you are, or what your name is.… If [your hypothesis] disagrees with experiment, it’s wrong.
Einstein schooled his fellow scientists:
A model or a hypothesis cannot ‘prove’ anything. But data can invalidate a hypothesis or model. It takes only one experiment to prove me wrong.
Applying Feynman/Einstein to Climate Science
The “greenhouse theory” being used by activists to change the world economy fails the test in many ways. First of all, many scientists question CO2 as being both ‘the climate driver’ and a danger to humanity.
Dr. Patrick Moore, PhD Ecologist and co-founder of Greenpeace, testified before a US Senate committee in February 2014:
When modern life evolved over 500 million years ago,” he pointed out, “CO2 was more than 10 times higher than today, yet life flourished…. It also flourished when an Ice Age occurred 450 million years ago when CO2 was 10 times higher than today.
What then makes it an absolute law of nature that carbon dioxide levels above 350 parts per million (0.035 percent of Earth’s atmosphere) will be catastrophic, as so many alarmists now say?
The “more than 350 ppm CO2 will cause planetary disaster” hypothesis was put to the test with observations. A large team of unbiased climate scientists and I examined the three main tenets of the model-based “science” that EPA uses to justify its energy and climate regulations. We reported to the US Supreme Court in a brief that each one has failed the test.
* There has been no warming for close to 19 years, according to satellite and weather balloons measurements, despite an increase of over 10% in atmospheric CO2.
* The strong warming that all the climate models forecast in the tropical high atmosphere and the tropical oceans simply does not exist.
* Even NOAA and the IPCC have now admitted that there has been no upward or downward trend in droughts, floods, hurricanes and tornadoes. Only snow has increased – and the models had projected that snowfalls would be the only extreme weather event that would decline.
Political Pressure
However, pressured by the White House, the EPA, NOAA and NASA continue to use faulty climate models to predict a dire future and move us away from fossil fuels. And thanks to unprecedented funding of billions of dollars, university scientists are gladly supporting this effort and the dire forecasts. This is something that President Eisenhower warned about in his farewell address:
The prospect of domination of the nation’s scholars by Federal employment, project allocations, and the power of money is ever present – and is gravely to be regarded.
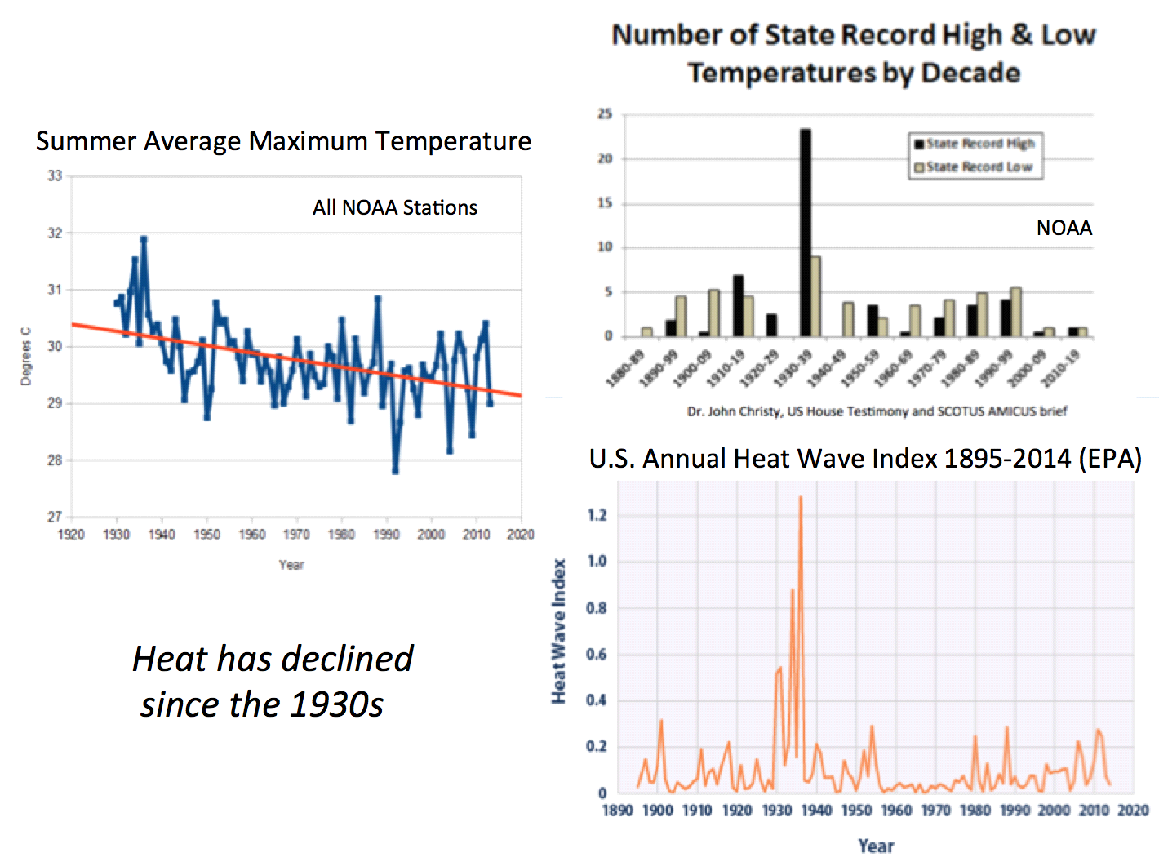
NOAA recently warned of an increase in heat waves and heat wave deaths. The reality is the heat peaked in the first half of the twentieth century and has been declining since then. In fact, 23 of the 50 states’ all-time record highs occurred in the 1930s, with 38 coming before 1960.
There have been more all-time cold records than heat records since the 1940s. As the graphs demonstrate, the number of 95-degree F days and widespread heat waves has been trending down since the 1930s.
For every continent, the all-time heat records were set in the 1800s to mid 1900s.
Dubious “Dangerous Warming” Claims
Totally ignored is the inconvenient fact that cold kills more people than heat. A rigorous study published last year in the medical journal Lancet examined more than 74 million deaths in 384 locations across 13 areas: cold countries like Canada and Sweden, temperate nations like Spain, South Korea and Australia, and subtropical and tropical ones like Brazil and Thailand.
It found that 20 times more people worldwide died from cold than from heat.
Government reports, writers of opinion pieces, and bloggers posting graphs purporting to show rising or record air temperatures or ocean heat, are misleading you. This is not actual raw data. It is plots of data that have been “adjusted” or “homogenized” (i.e., manipulated) by scientists – or it is output from models that are based on assumptions, many of them incorrect.
UK Meteorological Office researcher Chris Folland makes no apologies for this. “The data don’t matter,” he claims. “We’re not basing our recommendations [for reductions in carbon dioxide emissions] upon the data. We’re basing them upon the climate models.”
“Rather than seeing models as describing literal truth,” added Oxford University climate modeler David Frame, “we ought to see them as convenient fictions which try to provide something useful.”
But models are useful and valid only if their outputs or forecasts are confirmed by real-world observations. What’s more, these data plots were prepared by the same organizations that are responsible for producing the model forecasts. The fox is running the hen house.
Actual, original data have been changed so much and so often that they are almost unrecognizable from the original entries. For example, the 0.7 degree Celsius (1.3F) of cooling between 1940 and the 1970s – which had the world worried about another Little Ice Age – has simply “disappeared” in these corrupted-computer-model re-writes of history.
Important Perspectives on Warming Claims
In 1978, the late Leonard Nimoy of Star Trek fame warned audiences, “The worst winter in a century” occurred last year.
Climate experts believe the next ice age is on its way. According to recent evidence, it could come sooner than anyone had expected. At weather stations in the far north, temperatures have been dropping for 30 years. Sea coasts, long free of summer ice, are now blocked year-round.
Within a few more years, though, temperatures began to rise – and suddenly “climate experts” were warning that fossil fuels were going to warm the planet uncontrollably. Arctic sea coasts, they began to say, had far less ice and were in danger of being ice-free year-round.
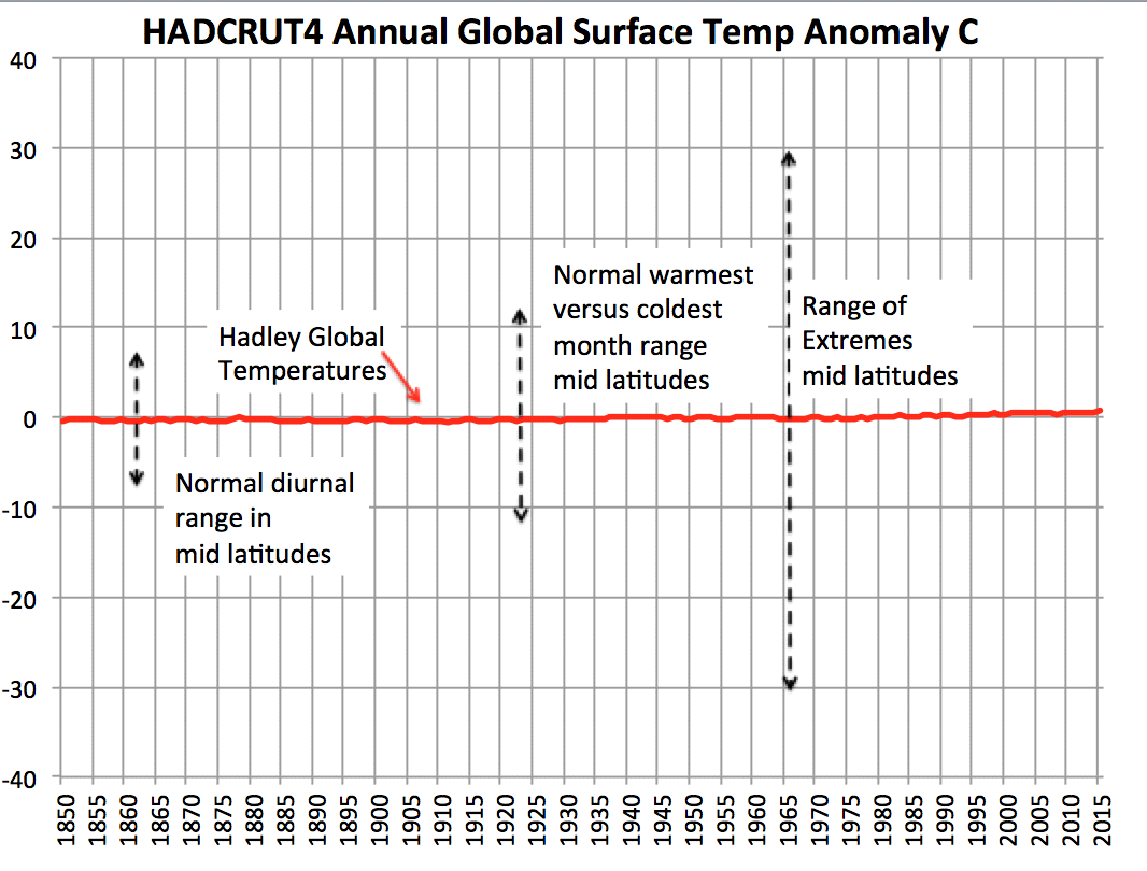
To underscore their concern, they exaggerate warming charts, by stretching the scale, to make any recent warming look far more significant than it actually is. Moreover, the claimed 1-degree-plus-or-minus warming needs to be put into perspective.
Here in the north, air temperatures often change more than 30 degrees F in a single day, monthly average temperatures vary more than 50F from January to July, and highest and lowest temperatures can vary as much as 125 F.
If you plot these normal temperature variations on a graph that also shows the global temperature change between 1850 and 2015 (based on data gathered by the institution that the UN trusts the most – the UK Hadley Center, or HADCRUT), the asserted average planetary warming is virtually imperceptible. It is certainly not “dangerous.
[Part II tomorrow will complete this post]
————
Joseph D’Aleo is a Certified Consulting Meteorologist and Fellow of the American Meteorological Society. He was a college professor and First Director of Meteorology at the Weather Channel. He has authored books and papers on how natural factors drive seasonal weather and long-term climate trends.
I’m not the least bit worried about the climate that my grandchildren will face.
I’m much more worried that they will have to deal with a United States economy closely resembling a third world country should the CO2 Climate Crackpots succeed with their pseudoscience.
Yes John: the real climate ‘risk’ and threat to sustainability is government activism in the name of climate change. Public policy, not only climate per se, is a risk from a humanist perspective.
I would dread to be educated in one of your classes.
Organizing data to reflect appropriate scaling is essential for representation and analysis.
Using ‘raw data’ is one of most amateurish thing one can do to draw conclusions. This kind of data jingoism driven by religious and pseudo scientific belief systems may be popular in the auspices of the Cornwall Alliance but does little service to honest analysis and reflection.
“Raw data” is the only DATA. After “adjustment”, what remains are estimates of what the data might have been had they been collected timely from properly selected, calibrated, sited, installed and maintained sites.
I first thought your reply was intended to be a joke, but then considered the possibility that you might be serious, so I’ll respond accordingly:
Sorry Charles: We did not “adjust” Strength of Materials data when creating designs for the Lunar Lander’s legs. Nor did we “adjust” Resonance data when countering frequency oscillations in the rocket’s fuel delivery systems. We used the raw (AKA real) data to assure successful NASA missions. The slide most often first shown in NASA Johnson Space Center presentations is:
https://dl.dropboxusercontent.com/u/4219691/Measure.jpg
You may “…dread to be educated in…” classes taught by Professor D’Aleo, but it is an education that you most surely need.
Thanks for the publicity for the Cornwall Alliance (www.CornwallAlliance.org), Charles. We invite visitors here to read the papers, articles, and blog entries at our cite and judge their quality for themselves.
The word “data” comes from the Latin “dare,” “to give.” Data are what are “given” by direct observation. As soon as the numbers denoting them are adjusted, homogenized, or in-filled, they cease to be data. There are good reasons for some adjustments of data (and bad reasons for others), but once the adjustments are applied, the result are not data.
Charles your points are highly relevant, however 180 degrees off target.
Joe D’Aleo was my Meteorological mentor for 4 years as we sat side by side for hours day after day studying and predicting the weather. It al began as I served as the first Meteorologist for the ABC network morning program, “Good Morning, America” and continued at The Weather Channel which I founded for which he served as the first Director of Meteorology. He has continued to be my Meteorological Hero since. This article is a small example of the depth of his great mind. If Al Gore had been in Joe’s class instead of Roger Revelle’s class, there would be on great Global Warming/Climate Change frenzy today. I trust Joe D’Aleo’s analysis and have no fear for the future. My children and grandchildren will experience the same constantly changing weather and climate that we have experienced in our lives. The changes will be largely the result of natural progressions in the Earth’s neighborhood of the Solar System and our galaxy. Mankind’s impacts on his climate will be local and minor. Thank you Joe for taking the time to present the data in this article and the one to follow.
It is precisely the “organizing and adjusting of data” that is the issue for those who do not wish to be led by the nose.
Ken Haapala, SEPP
[…] from a recent article by Certified Consulting Meteorologist and Fellow of the American Meteorological Society Joseph […]
I am proud to be one of Joe D’Aleo’s students. With his guidance, I went into graduate school, where I received a M.S. Degree in meteorology. After that, I had a career as a broadcast meteorologist, and now I am a college professor. Raw data is the ground truth for the scientific method and I have seen how it has been warped into mathematical musings. I have also witnessed the lack of verification in this area. Those who make projections should examine if the projections, or hypothesis succeeds or fails.
The comment regarding the use of “raw data” is fascinating. At first I assumed this was just your usual troll, but the sentence about “scaling” seems to indicate that the writer feels he is actually making a legitimate point, however incompetently he’s making it, i.e., in normal speech the opposite of raw is cooked–which although it definitely applies to much of the temperature fiddling, it probably not what he thinks he’s saying.
I’m used to seeing students get concepts twisted in knots, but I can’t figure out what concept in quantitative analysis he believes he’s referencing. Any ideas?
As a municipal engineer tasked with sizing drainage system upgrades costing a few hundred million dollars, I need to get rain trends right to assess upgrade capacities and fund capital works. I was shocked to find predicted rain intensity changes misreported as actual historical changes and research by Environment Canada – what is most disappointing is this misinformation is promoted by Ontario universities, government and insurance industry agencies with no scrap of fact checking. I took it upon myself to drill into our local rain trends and – surprise – there are no ‘detectable trend signals’, more decreasing intensities than increasing ones, and where there are increases, they can be explained by sample biases for naturally-skewed data in short records. This isn’t modelling or conjecture, its simple plotting of annual maxima trends. I’ve tablulated, plotted and mapped the data facts from Canada’s Engineering Climate Datasets (version 2.3) to show the truth is out there:
http://www.cityfloodmap.com/2015/12/trends-in-canadian-shortduration.html
So it seems that there is an epidemic of ‘fast thinking’ as Daniel Kahneman calls it – shortcuts in problem-solving and heuristic biases that prevent people from following data-driven, evidence-based approaches. You can show how the biases Kahneman describes apply to weather extremes:
http://www.cityfloodmap.com/2015/11/thinking-fast-and-slow-about-extreme.html
Lastly, the media have little resources to check facts and little motivation to make weather stories sound less severe – headlines sell. This has lead to basic operational issues and neglect of known flood risks being reported (hidden?) as extreme weather aggravated by climate change. This near tragic commuter train flood in Toronto is a prime example:
http://www.cityfloodmap.com/2015/12/stranded-metrolinx-go-train-avoidable.html
Even though the Ontario government has an inquiry into flooding in this area in the early 1980’s, they repackage they now repackage problem (quite readily explained by hydrology and river hydraulics) as a climate change problem prompting the need for cap and trade mitigation. Its unbelievable !
Free the data! Kick at the darkness ’til we see daylight.
“Using ‘raw data’ is one of most amateurish thing one can do to draw conclusions. This kind of data jingoism driven by religious and pseudo scientific belief systems” This is the single, most stupid thing I’ve ever read.
The Warmists are themselves the closest thing to a ‘religion’ I’ve ever seen. Even Scientologists make more sense than climate-clowns like Charles.
The DATA is what science uses to perform it’s primary function. Charles suggests it is irrelevant. Methinks Charles doesn’t understand what the purpose of science is. Methinks Charles has his own agenda.
There is evidence-based decision making and then there is decision-based evidence making….
Joe, could you please provide a reference for the Summer Average Maximum Temperature data from NOAA. I looked for it, but can’t find it. It’s hard to find ANY raw data there (perhaps to your point). But, looking through the decade data by state, it is easy to see that Alabama is the place to live. They have certainly mitigated all affects of any global warming. (That’s tongue-in-cheek.)
[…] dass deren Behauptungen zutreffend sind. Beispielhaft seien hier diese Links genannt: hier, hier, hier, hier und […]
[…] dass deren Behauptungen zutreffend sind. Beispielhaft seien hier diese Links genannt: hier, hier, hier, hier und […]