Air Quality Compliance: Latest Costs for SO2 and NOx Removal (effective coal clean-up has a higher–but known–price tag)
By Robert Peltier -- June 13, 2009Editor Note: Robert Peltier, Ph.D., PE, is editor-in-chief of POWER magazine. His bio is at the end of this post.
Environmental retrofits at coal plants have experienced costs greater than estimated by the Energy Information Administration. That is the bad news. The good news is:
- There are no significant technical problems with flue gas desulphurization (FGD) or selective catalytic reduction (SCR) technologies. Utilities are not buying “serial number one” so the performance or compliance risk is negligible. Completion risk for any project also appears to be minimal.
- The costs to construct either technology are reasonably well understood so that project capital cost estimates should be on the money.
- The cost escalation (updated below) during the boom is now subsiding.
The overall result is that the “dirtiest” power plants have been and are being cleaned up to current stringent air-emission standards via the Clean Air Act and other pollution regulation. This is real news–cleaned-up coal versus the political moniker “clean coal” (a separate issue dealing with a non-criteria air pollutant, carbon dioxide).
Background
Mary Hutzler’s excellent summary of the significant emissions reductions achieved by the electric utility industry (The Facts About Air Quality and Coal-Fired Power Plants, June 1) should be required reading by any proponent of coal-fired power generation. I have used the statistics cited for “criteria pollutants” in many public presentations, and few present were aware of this great “untold success story.”
One topic Hutzler succinctly reviewed was the background of the 1990 Clean Air Act and its evolution through the Acid Rain Program and up to the Clean Air Interstate Rule (CAIR), which requires significant reductions of NOx and SO2 from 21 states and the District of Columbia. Regardless of CAIR’s current legal status, many utilities can’t avoid similar air emissions reductions because they are either under a consent decree or have state emission limits to meet. Regardless, utilities otherwise covered by CAIR are moving ahead with the installation of flue gas desulphurization (FGD) and selective catalytic reduction (SCR) systems at a brisk rate.
An excellent example of the significant investment many utilities have made over the past decade is American Electric Power (AEP), one of the largest public utilities in the U.S. with 39,000 MW of installed capacity with 69% of that capacity coal-fired. AEP is under a New Source Review (NSR) consent decree signed in 2007 that requires the utility install air quality control systems to reduce NOx by 90% and SO2 by at least 95% on selected coal-fired plant in their system (reference). AEP’s total capital investment in systems to improve air quality is $5.2 billion spread over several years, $1.0 billion for 2009-2010 alone (reference).
The estimated cost to install either an FGD or an SCR system has risen steadily over the past few years making the familiar cost estimates obsolete. Hutzler reports the EIA estimates for a typical 700 MW plant in 2006 dollars as $98/kW for an SCR with 90% NOx removal and $190/kW for a FGD that removes 95% of the SO2 in the stack gas. Both removal rates are typical specifications used in the power industry. However, the cost estimates are long-outdated and should no longer be cited.
One more current data set is the historic capital costs reported by AEP averaged over several years and dozens of completed projects. For example, AEP reports that their historic average capital costs for SCR systems are $162/kW for 85% to 93% NOx removal—65% higher than the EIA estimates. Also, AEP’s FGD systems were installed at an average of $262/kW for 95% to 98% SO2 removal or 38% higher than the EIA estimate (reference).
What’s a Utility to Do?
So what are the actual costs a utility should expect when estimating the cost of installing an SCR and/or FGD system? Public benchmarking data sets are few and far between and those in existence are usually maintained and marketed by consulting firms that are in business to make a profit.
A better option for obtaining good estimates of the installed cost of an SCR or FGD system is the benchmarking data collected by the EUCG, an association of electric utility professionals that provides a forum in which utilities can improve their operation and maintenance practices and construction performance. One of the EUCG’s key activities is developing process and market benchmarks, unit reliability strategies, and best-practice applications to foster performance and cost excellence within the utility industry and competitive markets.
The EUCG’s Fossil Productivity Committee has more than 40 electric utility members reporting operating data on more than 300 individual coal-fired units. That number represents more than 30% of operating coal plants in the U.S. therefore making that dataset perhaps the most robust benchmarking data on coal-fired plants available anywhere. However, the complete datasets are only available to member utilities and those utilities that participate in the surveys. POWER magazine has been privileged to have access to those data sets and permission to publish top-level results from those surveys.
The following two sections present the reported historical costs of SCR and FGD systems based on the EUCG datasets. In sum, the EUCG historical data finds the installed cost of an SCR system of the 700MW-class as approximately $125/kW over 22 units with a maximum reported cost of $221/kW in 2004 dollars. This data was reported prior to the dramatic increase in commodity prices of 14% per year average experienced from 2004 to 2006 (from the FGD survey results). Applying those annual increases to the 2004 estimates for three years (from the date of the survey to the end of 2007) produces an average SCR system installed cost of $185/kW. Also, the average installed cost of a typical 700MW-class FGD system was reported in the EUCG survey as $380 for units under construction in 2007. Both historical installed costs reported in these two EUCG surveys far exceed the outdated and extremely optimistic estimates developed and reported by the EIA.
I. The Real Cost of Installing an SCR
Our first benchmarking survey (data reported in 2005, first published in 2006) focused on SCR system installation costs and the project and design attributes that contribute to them. Specifically, it identified the costs of construction labor, equipment, materials, and project management-engineering-construction management (PMEC). The survey addressed 11 specific scope/design unit attributes such as the type of ammonia system used, the NOx-removal efficiency design basis of the system, and SCR-related plant upgrades (economizer, air heater, fans, etc.) on a $/kW basis.
The responses to the survey yielded scope, cost, and design information on 72 individual units totaling 41 GW (representing 39% of installed SCR systems in the U.S. by MW at the time of the study) owned by eight large utilities from SIP Call states. They included Southern Company, Duke, TVA, Progress Energy, Constellation Energy, Ameren, Ontario Hydro, and AEP. The sample also reflected the distribution of installations in the U.S., so the survey results can be considered a valid top-level view of system costs.
Economies of Scale
As Figure 1 shows, although almost three-fourths of the surveyed units have a capacity of 300 to 900 MW, together they represent only a little over half the total capacity studied. Overall, costs were reported to be in the $100 to $200/kW range for the majority of the systems (Figure 2), with only three reported installations exceeding $200/kW. System size (with a 644-MW average unit size in the $100 to $150/kW range) seems to dominate; larger average system costs are significantly less than the next survey category (the $150 to $200/kW range, with a 309-MW average unit size). The data also suggest that the larger units were installed earlier: the average unit size retrofit before 2003 was 623 MW, vs. 466 MW since 2003.
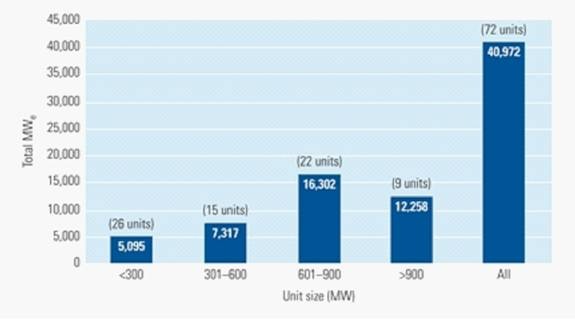
1. SCR cost survey results, categorized by plant size, covered approximately 39% of the new SCR capacity installed through early 2004. Source: EUCG as published in POWER
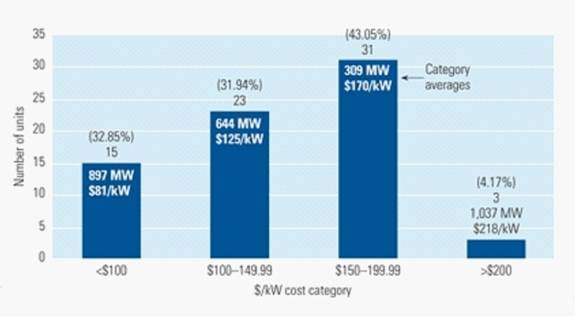
2. Number of units surveyed by average cost category. Source: EUCG as published in POWER
The range of category costs by unit size ($/kW) provides insight into SCR projects’ relative complexities. For example, the aggregated reported costs in the defined categories (Figure 3) point to several conclusions:
· The cost of construction labor on smaller projects exceeds the average construction labor cost in all categories by about 50%. The implication is that small plants will be cost-penalized by their lack of economies of scale because they may be more difficult to retrofit.
· Construction labor costs were relatively constant for plants larger than 300 MW, with an average cost of just over $64/kW.
· As expected, economies of scale also impact SCR material costs, with larger units costing less to retrofit, on a $/kW basis, than smaller units.
· Sophisticated regression modeling techniques (multivariate analysis) generally did not do a very good job of predicting overall installed costs; too many site-specific variables impact construction costs.
· PMEC costs are relatively consistent regardless of unit size.
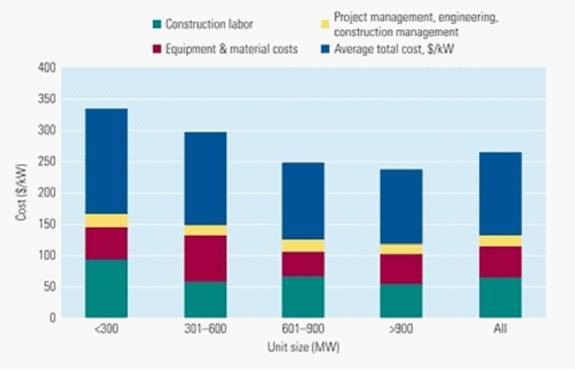
3. Cost distribution for 72 units with SCR installed by survey size range. Source: EUCG as published in POWER
The Good Old Days
The survey data also revealed that deviations from average installation costs correlate strongly with project timing, especially for those units installed after 2003 (Figure 4). The significantly higher construction labor costs for later projects most likely reflect increased project complexity—“easier” projects were already completed—but also perhaps increased competition for skilled labor resources as the number of SCR installation projects underway in the U.S. skyrocketed.
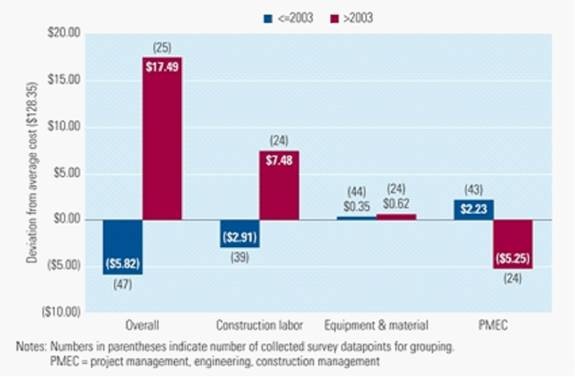
4. Deviation of category costs as a function of project completion date. Source: EUCG, POWER
Interestingly, the variation in material costs was constant over the survey period, most likely reflecting increased competitiveness among SCR suppliers. By contrast, PMEC costs showed higher variability, which—as in the case of construction labor costs—reflected the greater complexity of later projects. Average cost variation by cost category is summarized in Table 1.
Table 1. Variation of surveyed cost categories by unit size. Source: EUCG as published in POWER
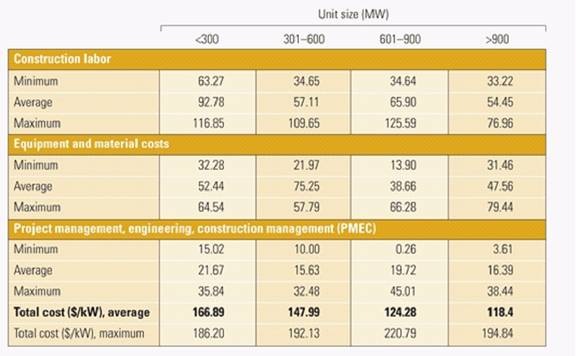
One Survey, Many Conclusions
Although the survey results provide useful insight into expected installed costs, they also confirm that there is no “one size fits all” SCR design. What the data also make clear is that site-specific characteristics of units and plants can drive a project’s cost much higher than anticipated. Together, these conclusions suggest that “retrofit difficulty” is indeed relative. Units with a capacity of 600 to 900 MW appear to experience more retrofit difficulty than those in other size ranges.
Since SCRs are unitized, greater economies of scale were expected from the survey results. Some possible explanations include:
· The impact of newer plants’ tighter layouts, which often necessitate much more complex duct installations, raising costs).
· Plants’ limited ability to use the most cost-effective method of equipment transportation. Some 41% of the units surveyed in the 600- to 900-MW range are close to navigable waters, vs. 76% of units larger than 900 MW.
· The increasingly modular design of SCR systems, which reduces their capital costs but still requires them to be delivered by sea or river.
II. The Real Cost of Installing an FGD System
Flue gas desulfurization (FGD) projects continue to be the largest line item for many utility construction budgets. The technology is sound, so the operational risks have decreased remarkably over the past decade. What remains, however, is the risk of project overruns caused primarily by rapidly rising commodity prices. In this 2007 survey (for which data were collected in 2006) we found that the base cost of an FGD system was $319/kW averaged over 49 separate projects. That was an increase of 21% since the previous survey was completed in 2005.
Survey Background
The data for the current survey were collected during the period December 2007 through June 2008 and then presented to the Fossil Productivity Committee (FPC) at the EUCG fall meeting in late 2008. There are important differences between the two surveys. First, the number of utility participants remained the same, at an even dozen, although there were four new participants. The survey continues to cover an excellent cross-section of coal-fired utility plants involved in FGD retrofits (Figure 5).
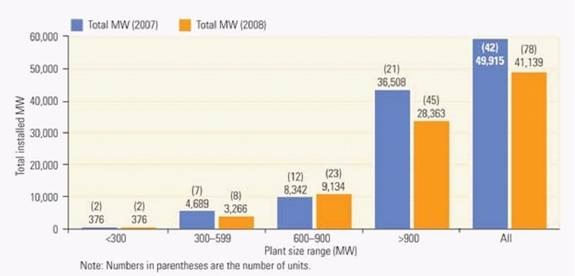
5. New survey update. The 2008 EUCG FGD cost survey includes 78 units total 41 GW. Source: EUCG as published in POWER
The 2008 survey covered more than 41 GW and 78 scrubbed units and represent the largest FGD data set analyzed in the industry. The average unit size in this survey was 956 MW, down slightly from 1,019 MW in the 2007 survey.
The survey data reflect the wide variety of plants, locations, and fuels used in this industry. The survey also covered a nice range of FGD system start-up dates (Figure 6). Nearly 50% of forecasted in-service dates were 2009 and 2010, the average start-up date is 2010, and the latest is 2015. As the reported start-up dates are in the near future, we have high confidence in the final construction cost estimates, which reinforces the usefulness of the data. We have included results from the 2007 survey in the figures to illustrate recent industry cost trends for FGD systems.
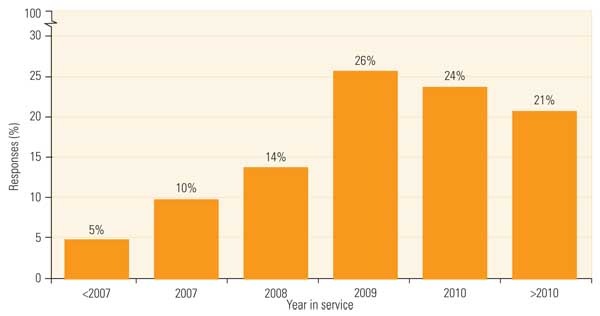
6. Latest cost data. The majority of the survey data come from scrubbers that were recently installed or are currently under construction. Source: EUCG as published in POWER
System design characteristics and assumptions for units covered in the current survey were not unlike those in the 2007 survey and are summarized below:
· All the surveyed facilities are using limestone forced oxidation technology.
· Tower technology selection varies by site, although more than half of the units still prefer spray technology (Figure 7).
· The FGD average sulfur dioxide removal design basis selected by respondents remained in the range of 4.0 to 4.9 lb/mmBtu, although the number of respondents reporting the mean value almost doubled (Figure 8).
· Sixty percent of the respondents stated that their design includes a single stack/double flue configuration; another 29% specified a single stack/single flue design. These results are very similar to the 2007 survey data.
· There was more agreement with the flue material selection. In 79% (70% in 2007) of surveyed plants the flue is fiberglass resin; 12% (14% in 2007) selected an alloy steel or C-276 clad flue.
· For FGD waste disposal, 60% (53% in 2007) of respondents are using an old or new landfill; slightly fewer (26%) are recycling at a wallboard plant (35% in 2007).
· Reagent prep delivery is mostly by truck (57%); the remainder use rail (24%) and marine vessel (17%). These results are within a few percentage points of the 2007 survey results.
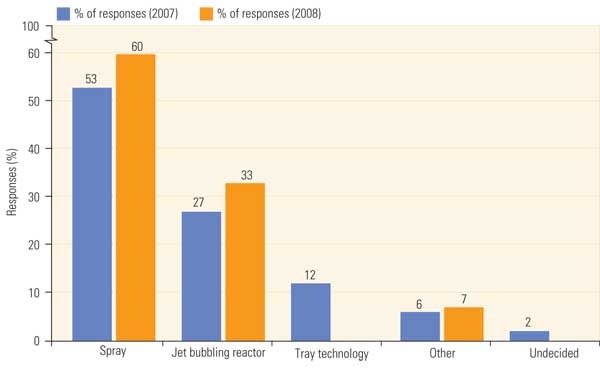
7. Make your choice. Although all of the FGD units reported on in the current survey were of the limestone forced oxidation technology, almost two-thirds were of the spray type, and a third were jet bubbling reactors. Source: EUCG as published in POWER
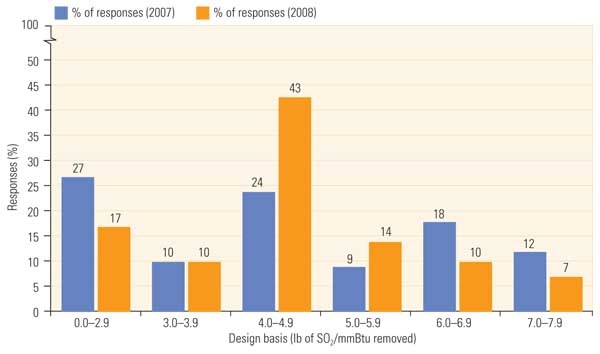
8. Capture the SO2. The average FGD SO2 removal design point is about 4.5 lb of SO2 removed per million Btu of fuel consumed. Source: EUCG as published in POWER
Cost Survey Results
Average total installed costs reported by the survey respondents were expected to have wide variation, principally because of the peculiarities that exist at each project site, the retrofit project complexity, and the timing differences between projects. Therefore, defining an average project cost is difficult without some understanding of the project-specific details of each of the 78 units surveyed. A look at the summary or “fully loaded” installed costs clearly shows that costs continue to rise (Figure 9) and continue to stay consistently above $300/kW. The data clearly show there are economies of scale for larger plants, but they are not as pronounced as you might expect.
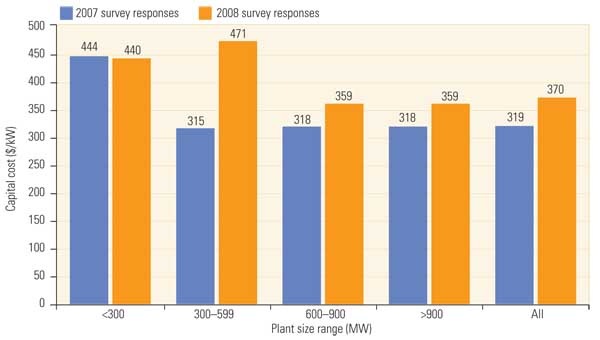
9. Big bucks. “Fully loaded” FGD system capital costs were reported by unit rating and show a significant increase since the previous survey. Source: EUCG as published in POWER
The survey data go into much more detail, although the in-depth data are restricted to those that participated in the survey. However, we can take one more step and strip out the FGD-only costs from the installed cost data to evaluate system-only cost changes since the 2007 survey.
The survey instructions requested that respondents define project costs for their just-completed, current, under construction, and/or planned FGD projects and that they include the following line items, at a minimum, so that comparable data were reported that could be compared across projects:
· Project design costs
· New stack and ductwork costs
· Reagent prep method and costs
· Absorber island/reactor technology costs
· Site prep costs
· Wastewater treatment costs
· Balance-of-plant costs
· Other direct costs (such as engineering and project management)
· Associated boiler work (such as boiler modifications and draft fans)
Comparing these costs to the “FGD only” cost summary, we begin to see some of the economies of scale expected for projects of this size, although they are not as pronounced as might be expected (Figure 10). The FGD-only costs were calculated as the sum of the FGD absorber reactor costs, reagent preparation system costs, the FGD waste disposal system costs, and the balance-of-plant cost. Stacks, site preparation, wastewater systems, and other project costs for boiler cleaning systems, coal blending or major electrical upgrades are excluded. This definition was refined before the current survey in order to obtain better cost data for the different cost categories.
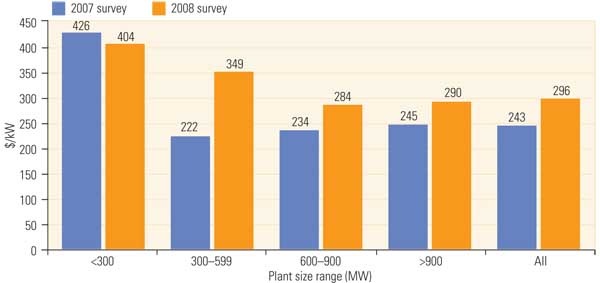
10. Costs have risen. Significant cost increases have occurred for “FGD system only” capital costs, yet the economies of scale do not seem to apply for units 600 MW and larger. Source: EUCG as published in POWER
Total project costs reported in the 2008 survey were approximately 28% higher than those reported in the 2007 survey (which used data from late 2006), representing an average annual escalation rate of 14%. The data also show a project cost escalation rate from 2006 to 2007 of approximately 22%. This number may seem large, but it is very similar to escalation rates for other major utility projects during the same period. Also, the 2008 survey shows essentially no difference in fully loaded project costs from conceptual design through start-up (Figure 11). The conclusion we draw is that FGD project installed costs may be rising significantly, but costs have become more predictable.
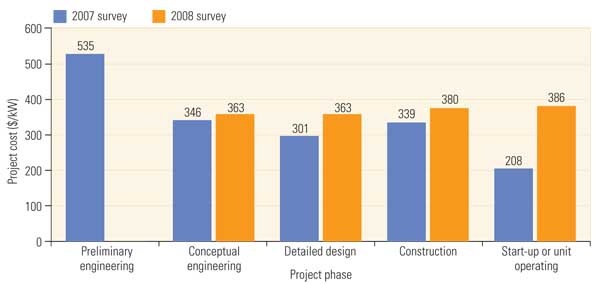
11. Reach for the sky. In the 2007 survey, “fully loaded” FGD system costs were much higher for preliminary engineering than for later phases and already completed FGD projects. The 2008 survey shows fully loaded costs to be very flat and independent of project phase. Source: EUCG as published in POWER
——————————————-
Robert Peltier began his power industry career with the regulated utility, San Diego Gas & Electric Co., the unregulated power developer Energy Factors, and gas turbine supplier, Solar Turbines, Inc and later was manager of production engineering Stewart & Stevenson’s Gas Turbine Division (now part of General Electric).
Dr. Peltier was also a tenured professor at Arizona State University for eight years where he taught numerous power generation-related courses. In 1999, Captain Peltier was recalled to active duty in the United States Navy to serve in Washington, D.C. on the staff of the Naval Sea Systems Command. He left active duty in September 2002 and completed two major command tours before retiring from the Navy Reserve in January 2007. Bob also joined POWER magazine’s editorial staff as senior editor in September 2002 and was named Editor-in-Chief of POWER on April 1, 2003.
Peltier has a BS, MS and Ph.D. in mechanical engineering and is a registered engineer in California and Arizona.
[…] Appendix: Increasing Thermal Efficiencies in Modern Coal Plants (Robert Peltier) […]
[…] Appendix: Increasing Thermal Efficiencies in Modern Coal Plants (Robert Peltier) […]