GHG Forcing: Diminishing Returns (bad mitigation math)
By Robert Bradley Jr. -- December 6, 2023The saturation effect, the nonlinear, logarithmic relationship between greenhouse gas (GHG) forcing and increases in atmospheric concentrations of carbon dioxide (CO2), is an important scientific point for the climate debate. Diminishing returns is not as well known as it should be because of a media blackout on its negative implications for CO2 mitigation (reduction) efforts.
The log relationship means that the warming from a doubling of CO2 is not repeated at a tripling but at a quadrupling. This diminishes the fear of future increases that are in severe diminishing returns. This is an optimistic point to not sweat CO2 buildup this century or even next. And if global greening is applauded, the opposite of worry is reasonable.
An Example
I asked Randal Utech to do the math on the diminishment of CO2 forcing today (420 parts per million) versus in the late 1980s (at 350 ppm) when the climate debate took off. His result: a metric ton of CO2 reduction today is 18 percent less effective than a metric ton of CO2 reduction made in 1989. And this will continue with future PPM increases.
The Math
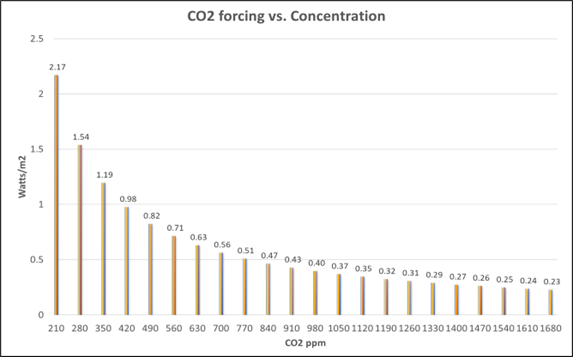
- CO2 forcing = 5.35 In(CO2 / CO2 pre-industrial)
1) So the CO2 forcing between pre-industrial (280 ppm) and today (420 ppm) is about 2.16 Watts per square meter.
- 5.35 x In(420 ppm / 280 ppm) = 2.16 W/m2
2) The forcing for a 70 ppm change from 280 ppm to 350ppm is 1.19 W per square meter.
3) The CO2 forcing of a 70 ppm increase from 350 ppm to 420 ppm is 0.97 watts per square meter.
The change in 70 ppm forcing going from 2) -> 3) is 82%, so in equivalent, forcing reduction of approximately 18%.
Forcing Chart
Implications
Advocates of mitigation make two points in response. First, GHG forcing is still positive. Second, increasing global CO2 emissions make the forcing line linear.
The fact remains that mitigation is a losing proposition over time, elevating the relative importance of adaptation to extreme weather events (whatever the cause). And as adaption takes place over time, the feared negative externality of CO2 emissions is diminished.
Wealth-is-health free markets, anyone?
Deceptive article immediately rejected for today’s recommended climate and energy reading list at my blog
The RIGHT question is how much global warming will a DOUBLING of CO2 cause INCLUDING a water vapor positive feedback. There is no attempt to answer that question here. The correct answer is no one knows but there is a huge range of guesses, from +0.5 to 5.0 degrees C. per CO2x2. The vest skeptic scientists I follow estimate +0.75 to 1.5 degrees C. The IPCC estimates +2.5 to +4.0 degrees C.
Not deceptive at all. The percentage applies to any estimate of climate sensitivity…
The water vapor positive feedback is ignored here.
The IPCC claims that feedback could triple the effect of CO2 alone. That feedback is gradual, but CO2 in the atmosphere is long lasting.
The chart is deceptive because it shows 70ppm increments
There are six 70ppm increments between the current 420ppm and a CO2 doubling at 840ppm
The effect of CO2 doubling, a standard measure, requires adding up six increments on the chart. That is impossible by glancing at the chart, and that’s why the chart is deceptive.
For your information, the climate models in the 1970s, when used with a reasonable CO2 growth rate (RCP 4.5), on average were very accurate (so far) with their 70 years TCR prediction for 1975 to 2045.
Based on that good performance from 1975 to 2023, it is impossible to refute the same climate models when used for 400 years. Those 400+ year predictions include warming MAINLY from the water vapor positive feedback. That feedback is the primary climate science debate.
The logarithmic effect of CO2 alone is not a subject for debate nor does it prove CO2 emissions will be harmless in the long run. The effect of CO2 alone is in the HITRAN and MODTRAN databases that both consensus scientists and “skeptic” scientists, such as Richard Lindzen and William Happer, use.
The three main CO2 questions:
(1) CO2 logarithmic effect = general agreement
(2) CO2 life expectancy in atmosphere = no agreement
(2) Water vapor positive feedback effect = no agreement
This article was about (1), the least controversial, by far, of the three main issues related to manmade CO2 emissions
I have a climate and energy blog that publishes a recommended reading list every morning. Articles from this website usually make the list. This one did not, and I just explained why.
https://honestclimatescience.blogspot.com/
Response to Richard Greene’s first comment:
Correct, feedback is not addressed and is a subject of great uncertainty and wide disagreement in the scientific community, as you suggest.
Response to Richard Greene’s second comment:
The chart is not deceptive as it represents a simple, mathematical expression of the CO2 forcing reduction over each interval (T=70Yr). The function is continuous as interval approaches zero (T->0).
The accuracy of history matching from a model never proves the model and input assumptions are correct. The model can be right for the wrong reasons.
As for (1) CO2 logarithmic effect = general agreement
Yes and this is the subject of the post, Items (2) and (3) are not addressed.