Have Fossil Fuels Progressed Humanity? (Part III)
By Julián Salazar Velásquez -- January 26, 2023Ed. note: Julián Salazar Velásquez, geologist and petroleum engineer in the Mexican and Venezuelan oil industries, is a leading educator and proponent of free market energy. He is author of numerous articles and Gerencia Integrada de Campos de Hidrocarburos” (2020), a primer on the oil industry value chain. His four-part world view began with Part I and Part II and concludes tomorrow with Part IV.
If institutions and governments consider hydrocarbons and coal as a curse, what will follow is a great retrogression, not unlike historical precedents of collapsed civilizations. Incredibly, this has already occurred in several countries.
Most have witnessed the benefits from fossil fuels, first coal and then oil and gas. Yes, atmospheric CO2 emissions have increased, but so have the living standards of a record number of people, what is called The Great Breakthrough. Examine the data for yourself: economic, demographic, educational, health, quality of life, political, science and technology, productivity and food consumption, and others that are too many to list.
In the economic aspect, the impact in recent years can be observed according to the indicators of: Gross Domestic Product per capita (GDP), world exports, and poverty rate. Dwell upon the growth in world population and life expectancy.
From the perspective of education, health, quality of life, politics, science and technology, and food production, note the improvement in basic education, literacy, vaccination, infant mortality, and democracy.
——————–
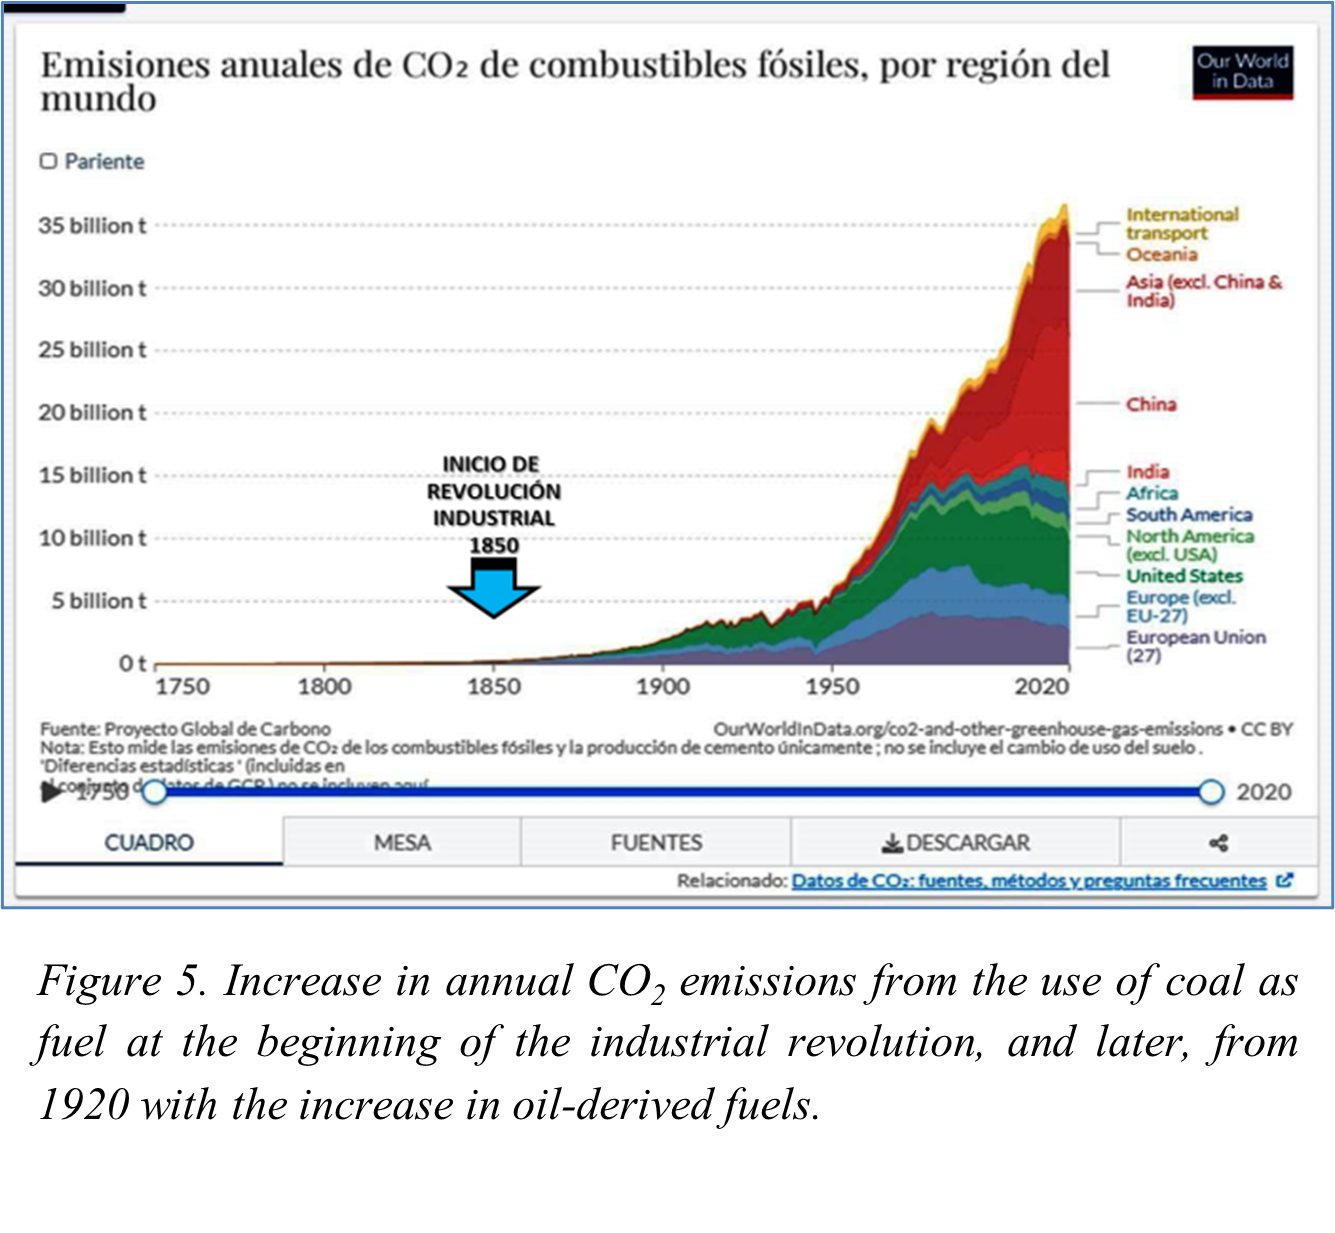
As shown in Figure 5 below, it is since the Industrial Revolution—which had as a triggering factor the use of coal as fuel to power steam engines, steamboats, railways, spinning machines and other innovative technologies— that CO2 emissions began to be generated into the atmosphere. Simultaneously, the world’s prosperity stage began, and then accelerated at the beginning of the 20th century with the use of energy sources derived from oil and gas, making the 20th century the century of exponential development. Such development continues to this day.
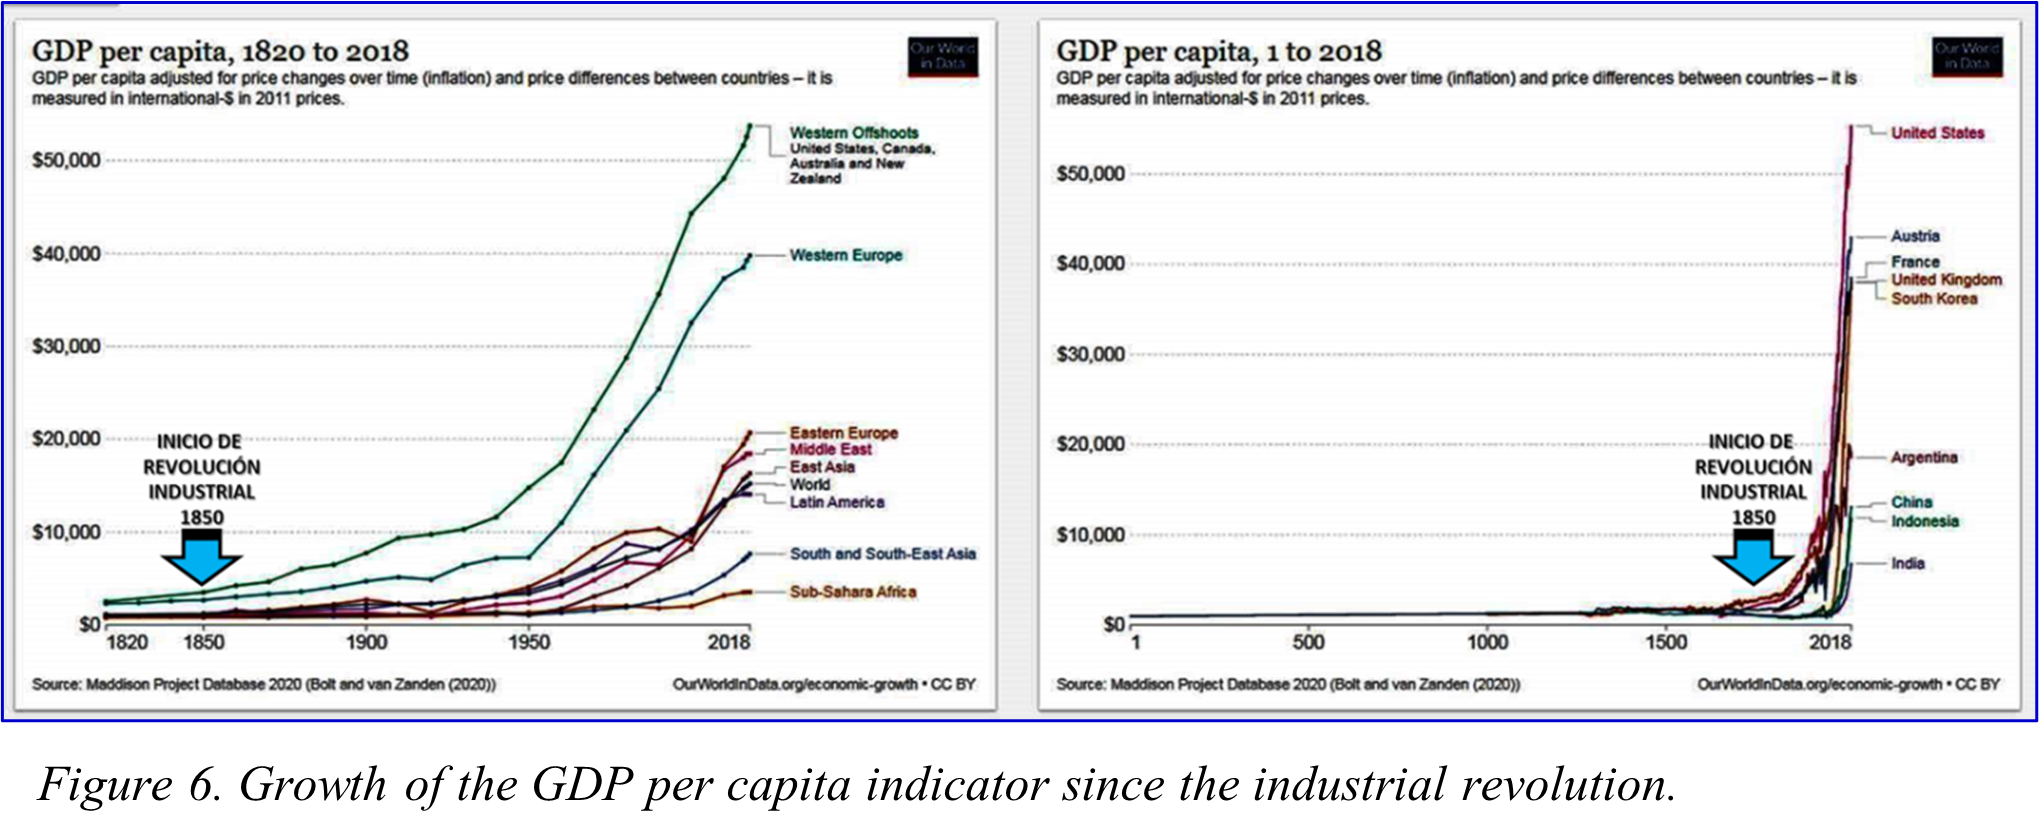
The most used macroeconomic indicator to measure the wealth of countries and their inhabitants, the Gross Domestic Product per Capita (GDP per capita), begins its sustained growth from the use of coal as an energy source that sustains the Industrial Revolution (Figure 6). This indicator skyrockets from the beginning of the 20th century with the incorporation of petroleum-derived fuels such as gasoline, fuel oil, kerosene and gas and oil that give movement to the global productive apparatus.
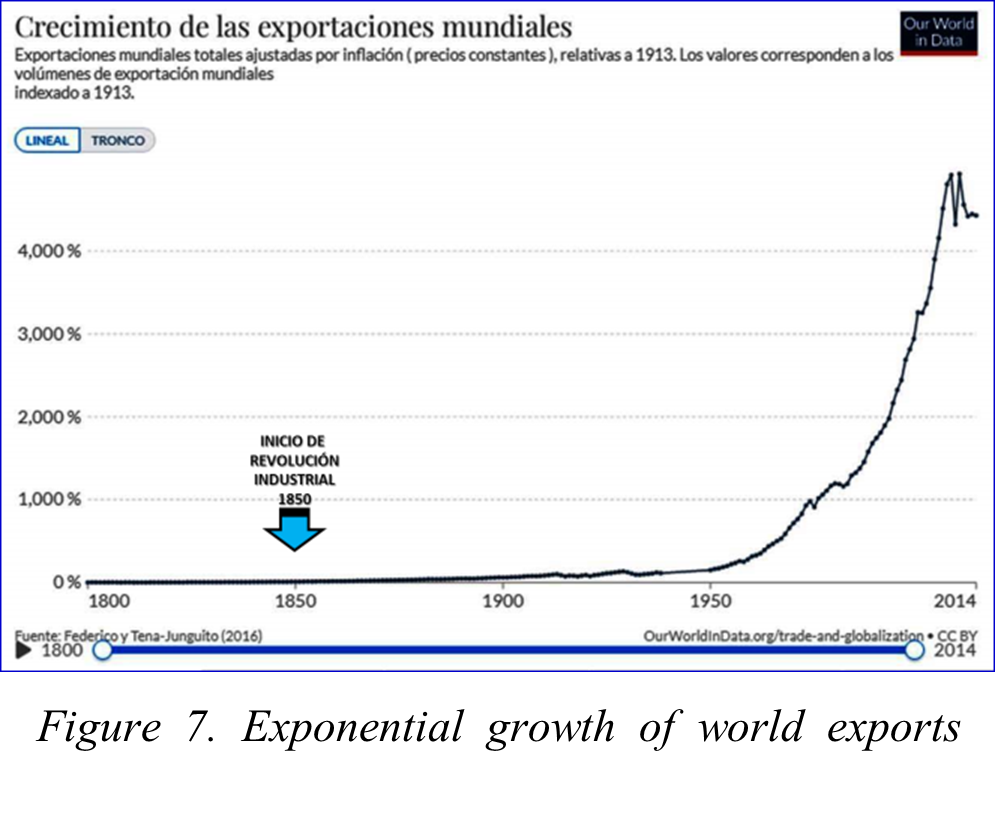
That prosperity is reflected in the global export growth indicator that follows an exponential trend like most 20th and 21st century indices (Figure 7).
The most important indicator of global prosperity is declining poverty. As shown in Figure 8, the indicator of extreme poverty (that is, those inhabitants who live with an income of less than 1.90 international dollars per day) has trended downward as fossil fuels came to dominate the energy market. In 1820, 88.2% of the world population lived in extreme poverty; in 2015, less than 10%, which correlates with the substitution of fossil fuels for dilute, intermittent renewable energies (primitive biomass, falling water, etc.).
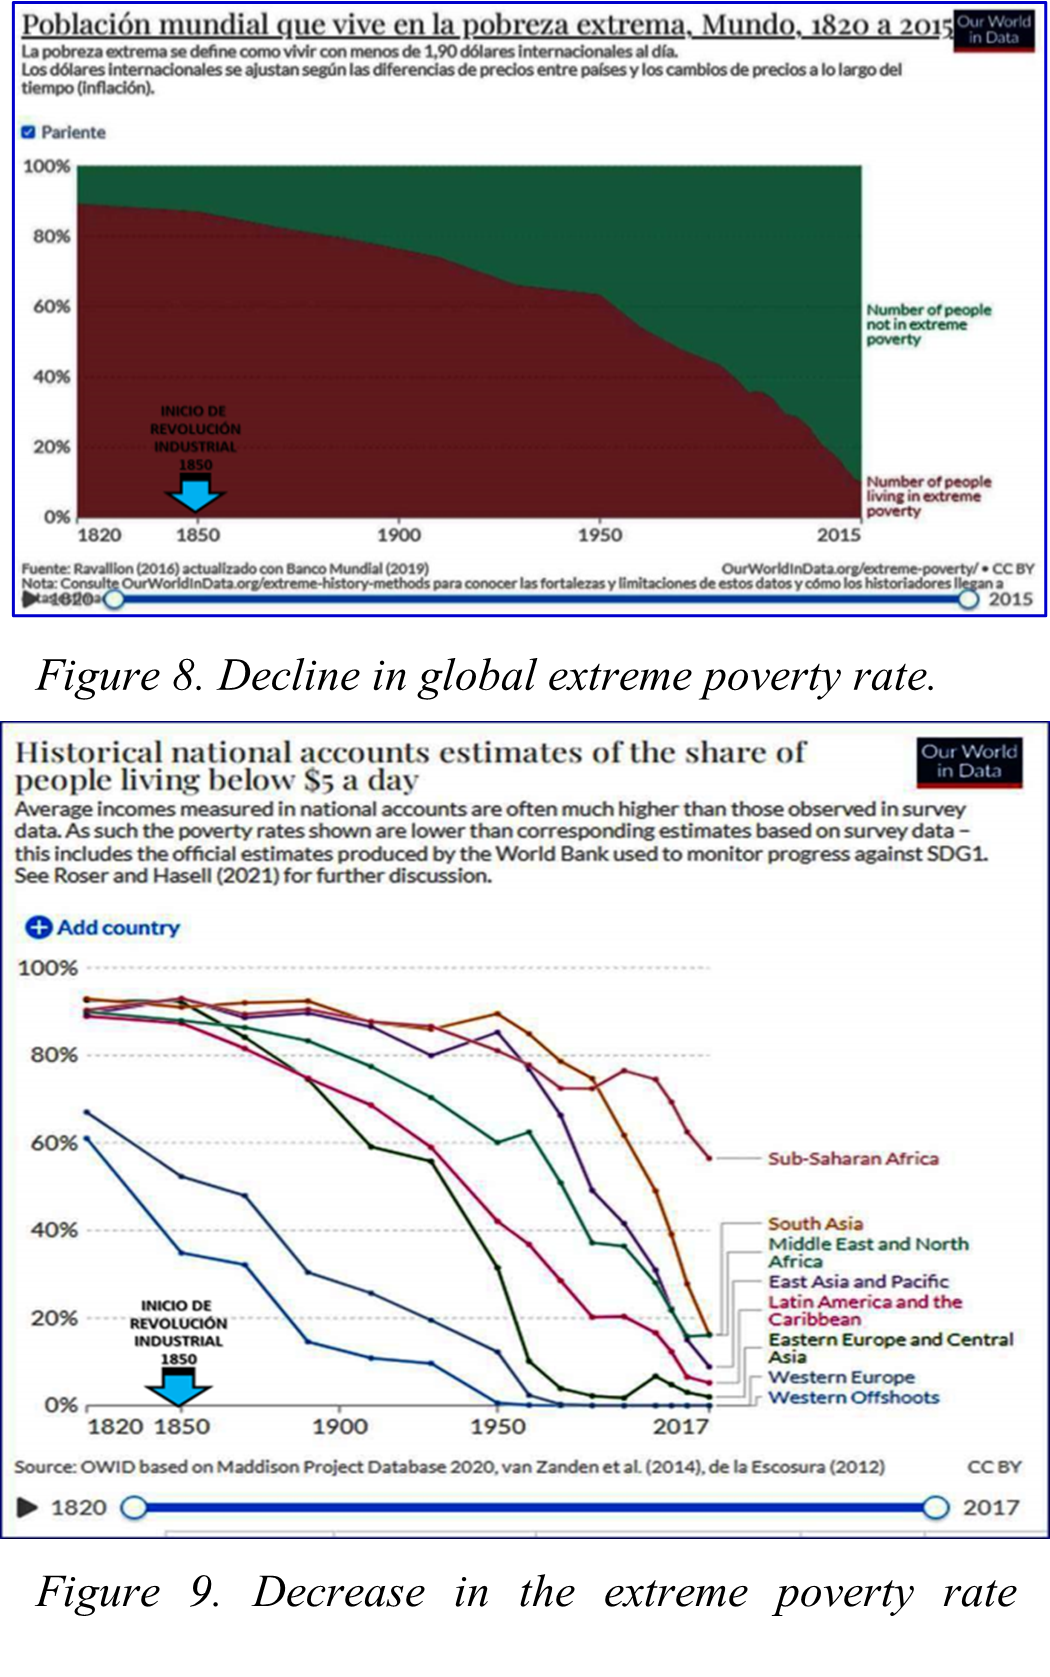
Figure 9 shows the distribution of extreme poverty by region. Poverty is below 10% in the most economically developed countries, such as USA , Canada, Australia and New Zealand (Western Offshoots), Western Europe, Eastern Europe, Central Asia, Latin America and the Caribbean, and East Asia. However, extreme poverty in Sub-Saharan Africa is at 56% of the population, characterized by its very low energy consumption.
The rate for Latin America is 5%, which does not include the terrible condition of Venezuela. This country has regressed to pre-industrial levels with a poverty rate in excess of Africa’s 56% according to a study by the Andres Bello Catholic University (UCAB) in 2021. Little surprise, Venezuela is marked by an almost total lack of freedom with the implementation of unfeasible communist projects and policies.
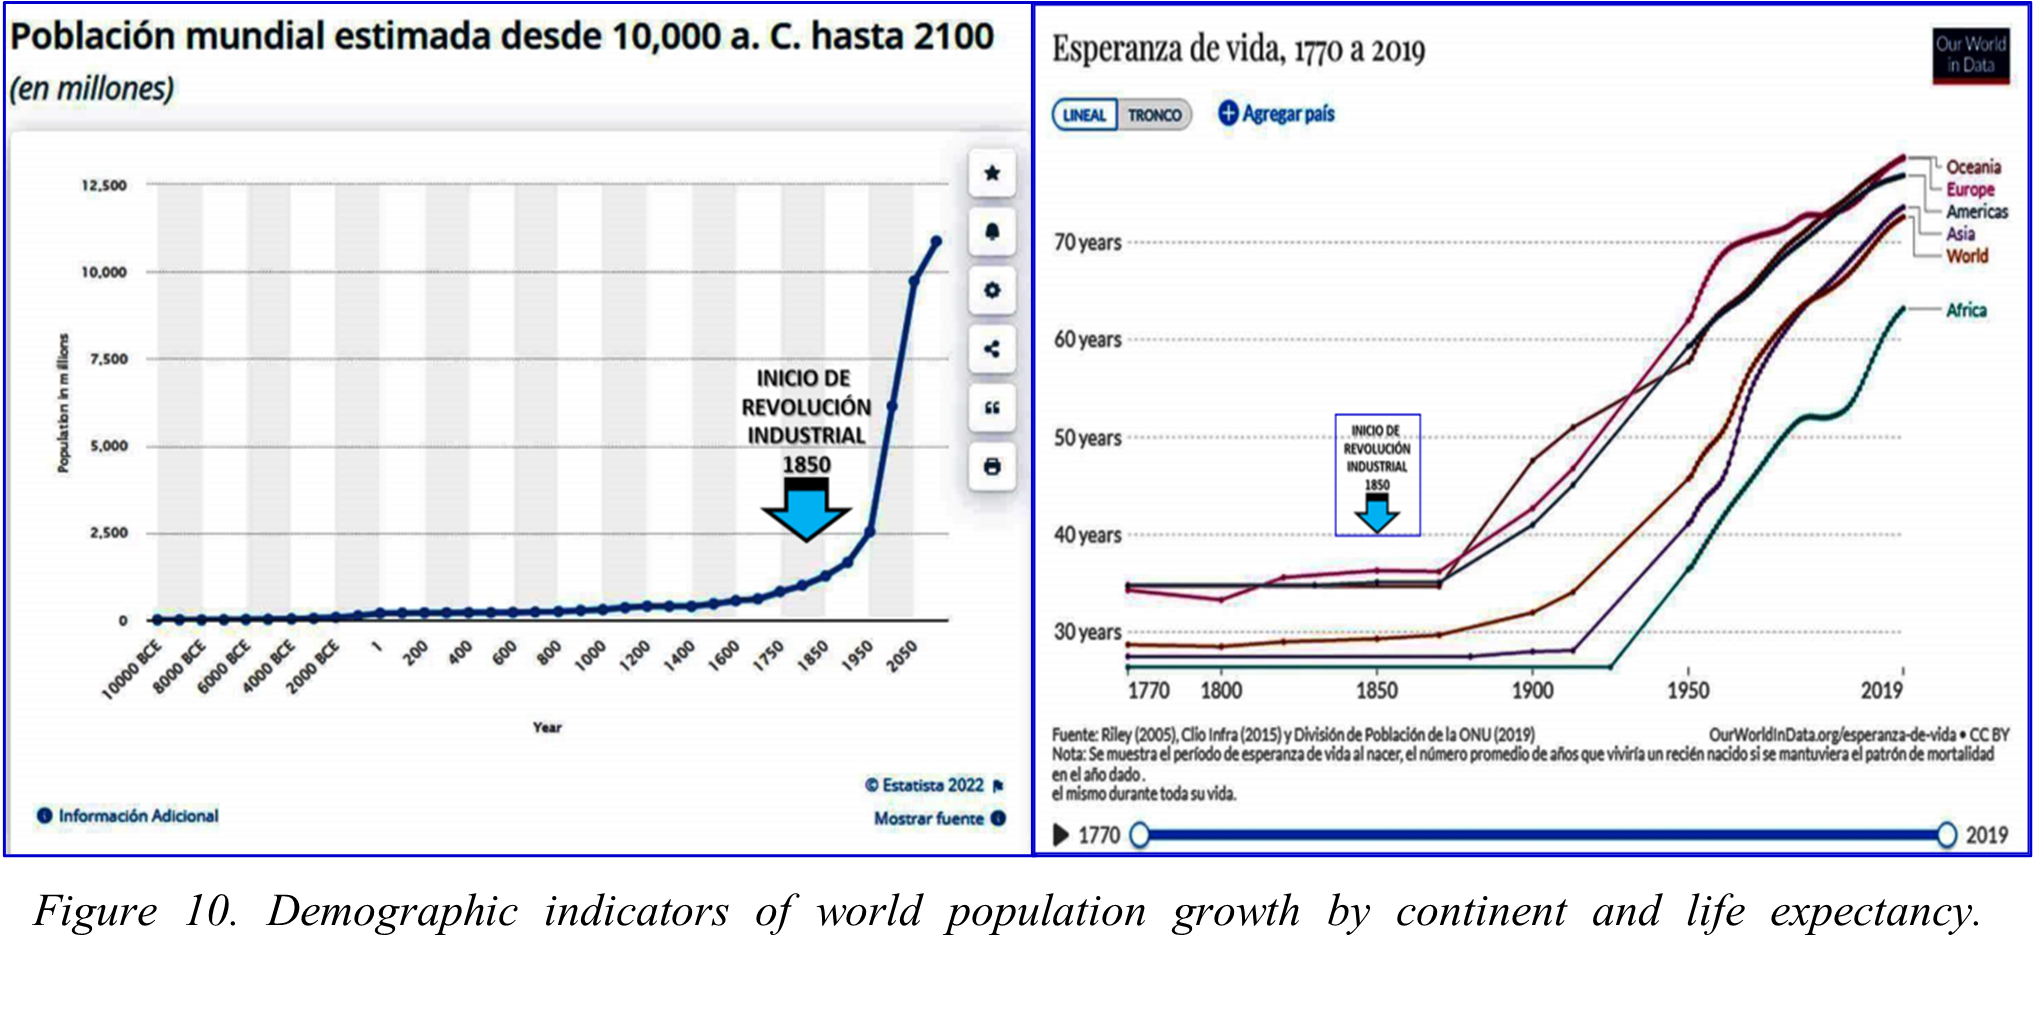
The behavior of the demographic indicators corresponds to those previously analyzed, in the sense that the variation of the world population and life expectancy are also influenced by the start of the Industrial Revolution and the use of fossil fuels. According to the graphs in Figure 10, the world population begins a substantial increase from the Industrial Revolution, which was 1.26 billion in 1850 until it grows and reaches 7.5 in 2020, estimating 8.91 for 2050.
Similarly, life expectancy was around 35 years in the continents of America, Europe and Oceania, which has grown steadily from that time until reaching 80 years in 2019; while the rest of the world ranged from under 30 years old to slightly over 60 years old in the same period. This important improvement has been due to the decrease in infant and adult mortality, due to the progress of medical technology and public health and, to the improvement of the aforementioned indicators such as: the rate of poverty and GDP per capita, plus others related to basic education, literacy, vaccination, and infant mortality.
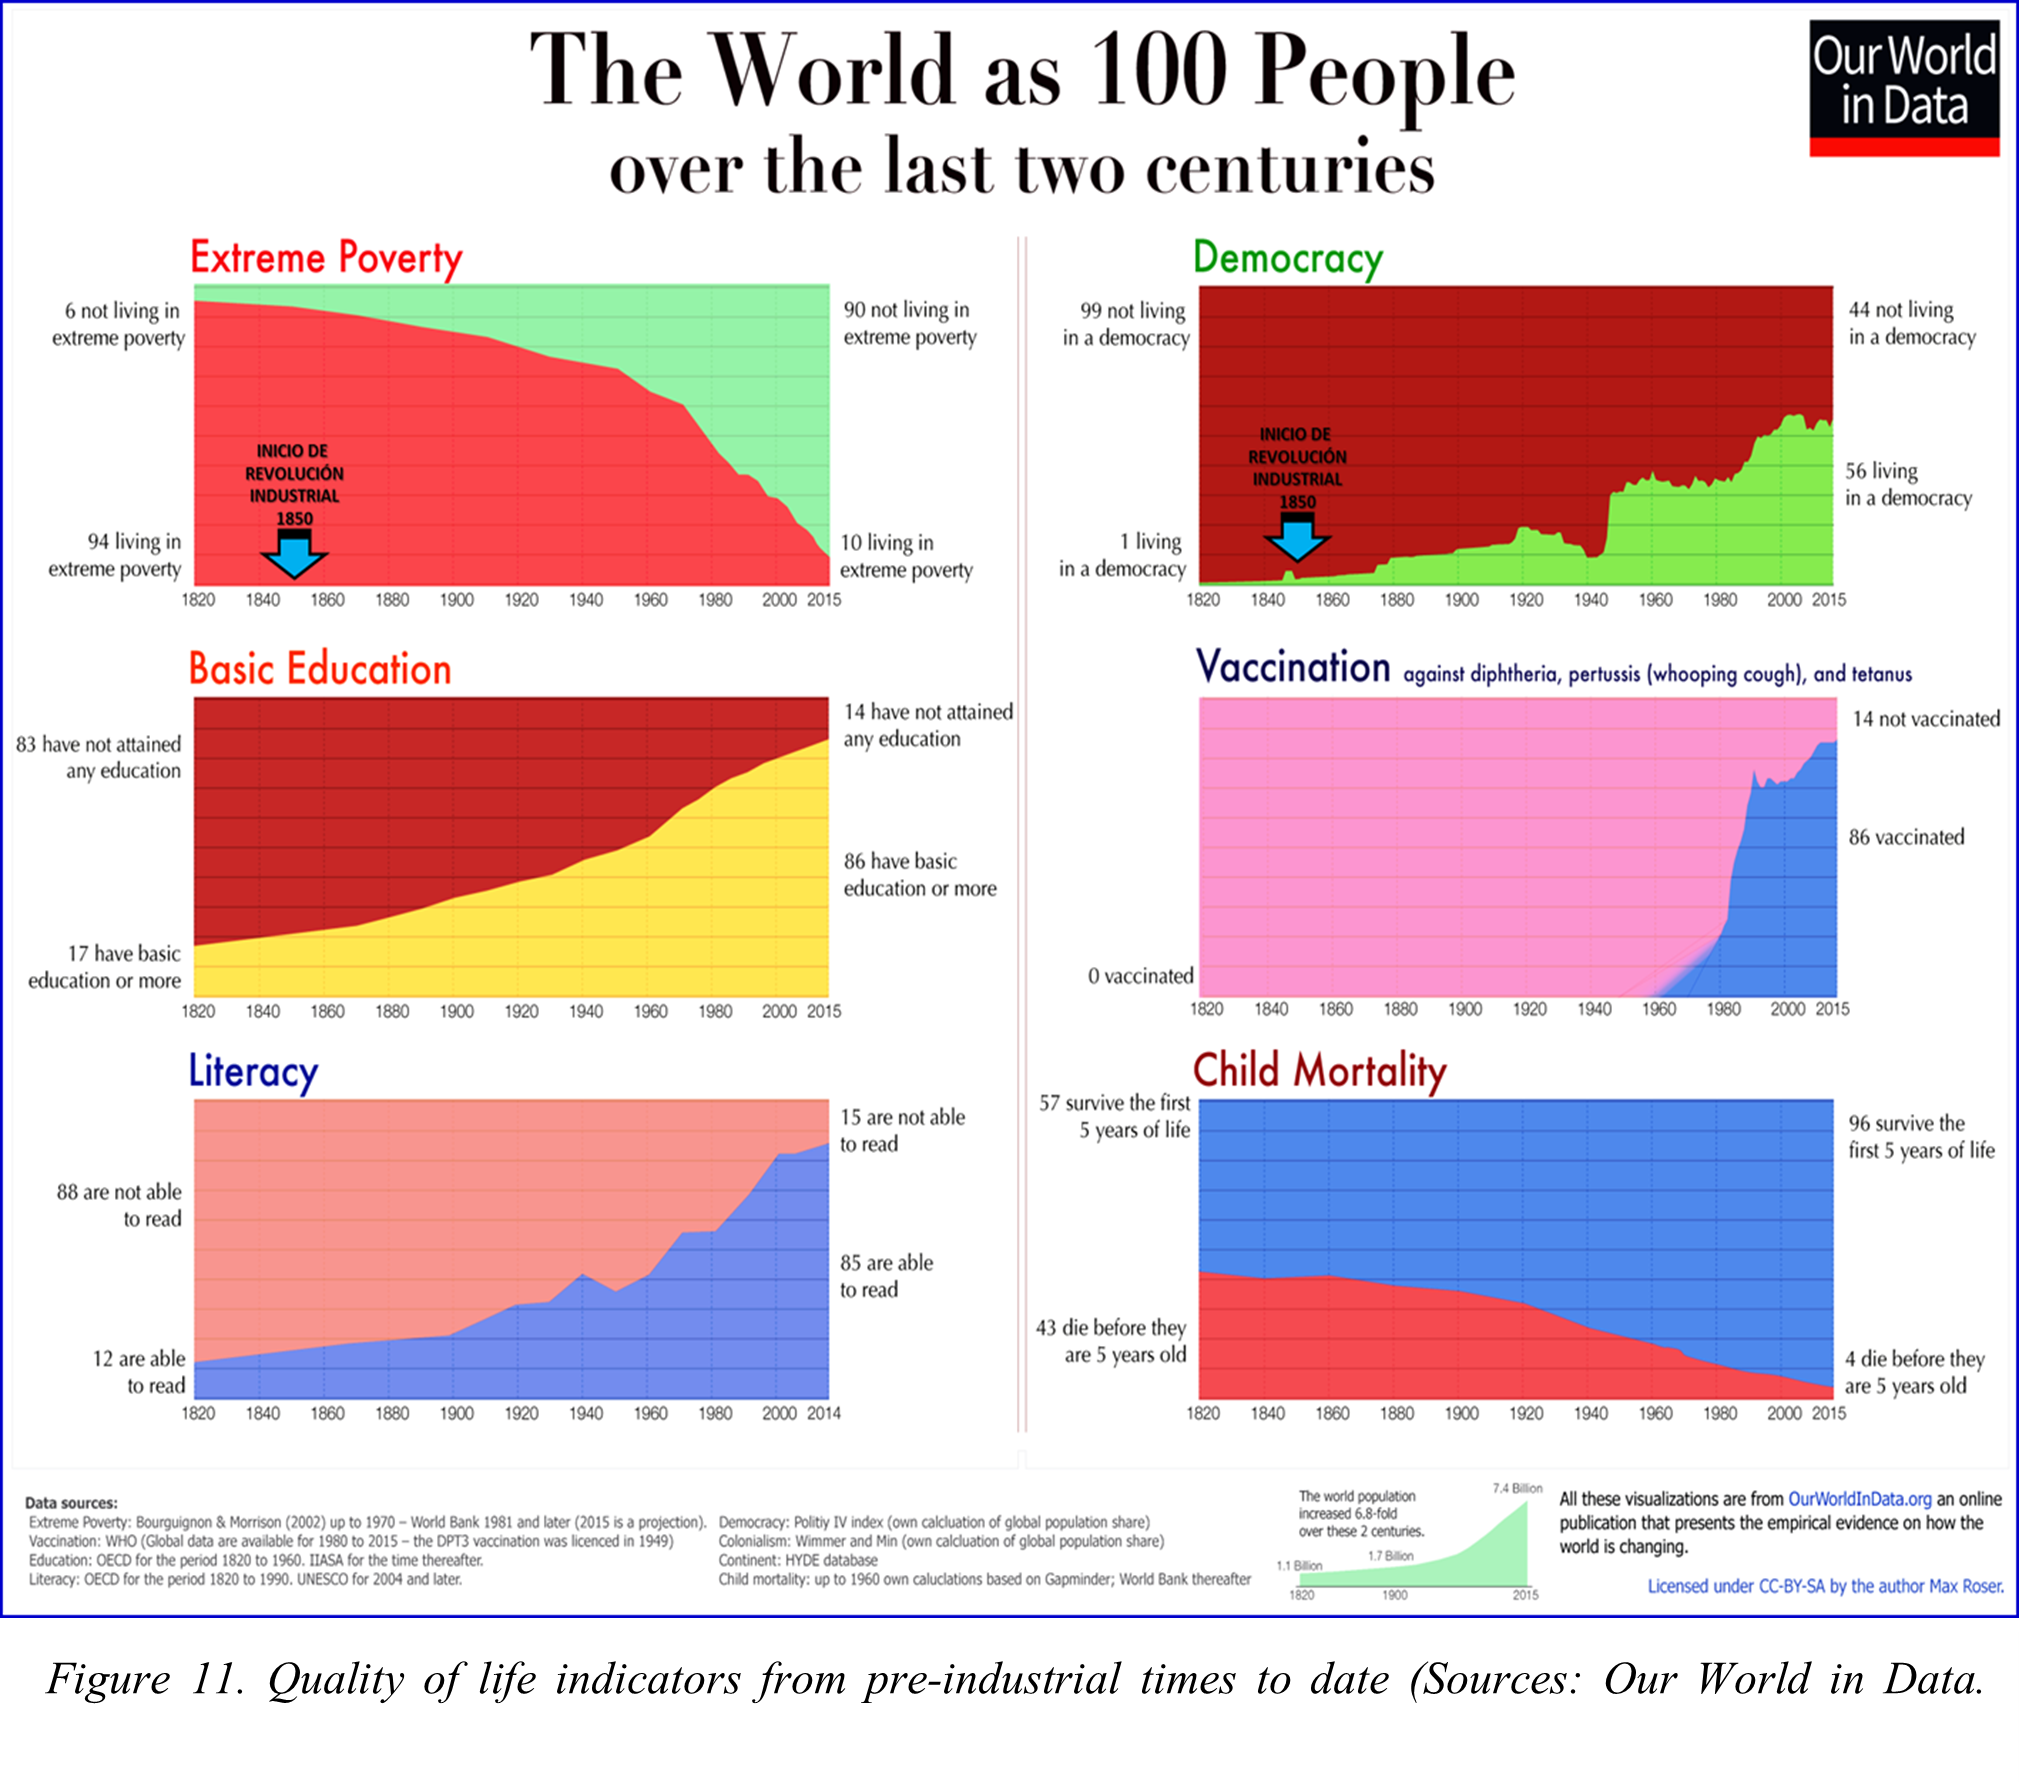
In the composite Figure 11, human progress is evident in terms of quality of life, which improves transcendentally from the widespread use of coal as an enabler of the Industrial Revolution and the addition of fuels derived from oil from the 20th century, which is manifested by 17% with basic education in 1820 rising to 86% in 2015; as well as an literacy improvement from 12% to 85% in 2014.
On the other hand, only 1% of the population in 1820 lived in countries governed in democratic freedom, while in 2015 it reached 56%. By 1820 the benefits of vaccination campaigns against diphtheria, whooping cough, and tetanus were unknown; in 2015, a 86% vaccination rate was achieved. This was a high-impact factor in the decline in infant mortality from 43% in 1820 to just 4% in 2015.
Part IV tomorrow continues and completes the analysis above.