Peter Lang on Australian Windpower: High Costs, Low Emission Reduction
By Kent Hawkins -- January 21, 2010The higher costs and inferior reliability of government-mandated wind power and solar power are well known to students of the electricity market. Many analyses on wind and solar have documented their real-world problems.
But another negative aspect of wind and solar technologies is their failure to live up to their raison d’être: emissions reduction. As I have explained in a four-part post, firming intermittent electric generation requires very inefficient fossil-fuel generation that creates incremental emissions compared to a situation where there is not wind or solar and fossil-fired generation can run more smoothly. This is a huge insight, a game changer, that could take the renewable energy debate in a new direction entirely.
A number of studies are emerging that quantify both the cost premium of politically-forced renewables and the minimal amounts of emissions reduction (and even notable emissions increase) resulting from their use. Country-specific studies (such as the one under review) present a methodology that is applicable to other jurisdictions (such as the U.S.) to better assess policy options and their consequences for all stakeholders, including taxpayers.
Peter Lang’s important new study, Emissions Cuts Realities – Electricity Generation, analyzes five options for the Australian electricity system for cutting CO2 emissions over the period 2010 to 2050 compared to business-as-usual (BAU) in terms of cost. The range of CO2 emissions reductions by 2050 compared to 2010 is from zero to 80%.
The conclusions that Lang draws include:
- The nuclear option provides the largest reduction in CO2 emissions – 80%.
- Any CO2 emissions reduction achieved with wind and solar thermal (there are arguably none and even increases) is “achieved” at a very high cost – 250-300% of 2010 costs.
Lang’s analysis is very conservative. The author’s preference seems to be to gain an unassailable beachhead in a very contentious debate. But in reviewing his data, I see confirmation that new wind or solar capacity provide marginal reduction in CO2 emissions at best. I would even argue that there are emission increases because any reductions due to new renewables are dependent upon solar thermal technology development by 2020 providing sufficient thermal storage to allow operation for 8,000 hours per year.
Other conclusions that can be reached are:
- The nuclear option provides an effective ‘bridge’ to future generation technologies.
- The extraordinarily large funding required for the implementation of new renewables in this period would be better spent on energy efficiency/conservation programs and in research and development for other technologies, such as carbon capture and storage (CCS), nuclear waste management, nuclear fusion and solar.
In summary, Lang’s study and other considerations provide another illustration of the failure of industrial-scale new renewables, particularly wind and in the near future, solar, to meet societies’ goals. They do not provide the impact that is needed in terms of energy independence, avoidance of fossil fuel use and reductions in CO2 emissions that conventional wisdom, with all its inadequacies, dictates.
My summary of Lang’s paper follows.
Options Investigated
The BAU option is illustrated in the following chart from Lang’s paper (all charts reproduced with permission). It shows the electricity production projected to 2050. The five options investigated replacing all the coal production by 2040 in accordance with realistic build rates, with the remaining BAU generation unchanged. The electricity production from the replacing generation must provide for that of the replaced coal plants.
Figure 1 – Electricity Production for Business as Usual
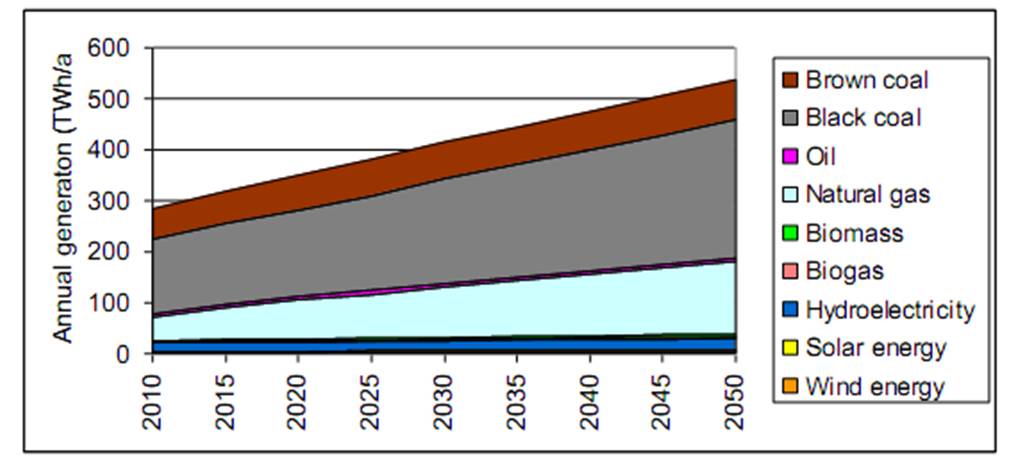
In 2010, about 70% of electricity generation uses coal, followed by natural gas and hydro. The five options considered to replace the coal portion entirely are:
- Combined Cycle Gas Turbine (CCGT)
- Nuclear and CCGT
- Wind and gas, including CCGT and OCGT (Open Cycle Gas Turbine)
- Solar thermal and CCGT
- Solar thermal, wind and gas (including CCGT and OCGT)
Solar thermal has some inherent storage capability due the thermal inertia of the heat transfer fluids, which will smooth out short term fluctuations. As well, it is assumed that technology development by 2020 will provide sufficient thermal storage to allow 8,000 hours per year operation, eliminating the need for shadowing/backup by other generation plants, as is required by wind.
The results show the combined effect of the BAU case, minus coal, plus that of the replacement technologies.
Results
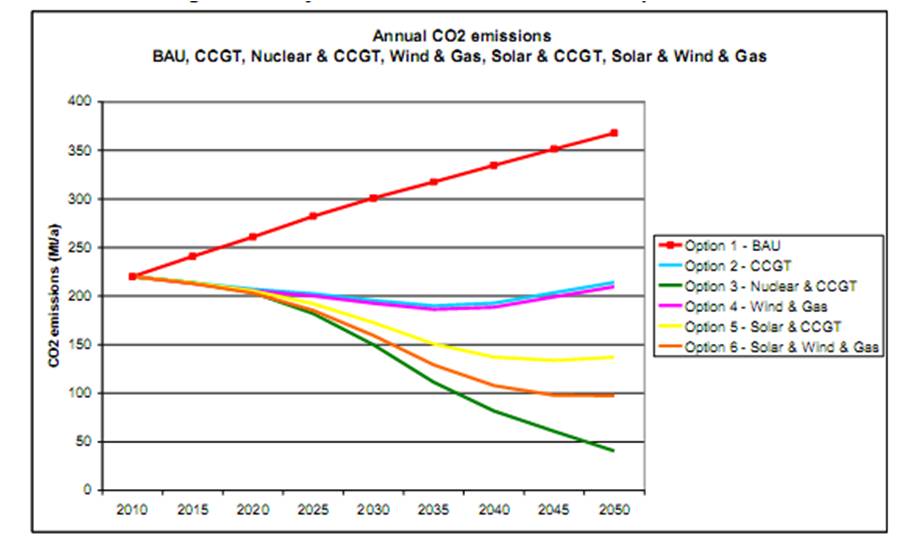
Figure 2 summarizes the outlook for CO2 emissions for all the options. Note that Option 3 (Nuclear & CCGT) provides over 80% savings, which is a target that many claim to be necessary in the context of combating climate change.
Figure 2 – Projected CO2 Emissions for Coal Replacement
Lang’s options 5 and 6 merit some comment. First, Option 6 will be discussed, and to assist in this, it is necessary to look at the chart for this projection, which is shown in Figure 3.
Figure 3 – Option 6 (Solar & Wind & Gas)
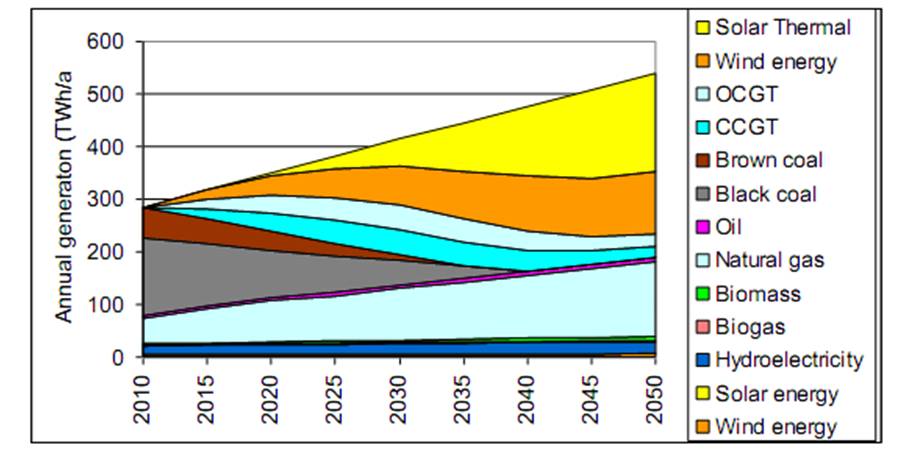
In Figure 3, focus on the top four segments, Solar Thermal, Wind energy, OCGT and CCGT. This represents the coal replacement complement for Option 6. The gas component below this is that already present in the BAU scenario (see Figure 1). The model was built assuming a given build rate for solar and wind, which results in a certain level of production. The difference required to meet the necessary total MWh was then added as additional gas production, including OCGT and CCGT. However, this replacement gas production is not sufficient to balance the amount of wind present. It should be about at least twice the wind production to avoid adversely affecting electricity system reliability. This change would increase the gas component and reduce some combination of that for Solar Thermal and Wind energy accordingly. These changes would likely increase Option 6 (Solar & Wind & Gas) to about the same level of CO2 emissions as Option 5 (Solar & CCGT).
With respect to Option 5, as mentioned above, it is assumed that technology development by 2020 will provide sufficient thermal storage to allow 8,000 hours per year operation, eliminating the need for shadowing/backup by other generation plants, as is required by wind. Inasmuch as this is generous, it will overstate the benefits attributable to both options 5 and 6. The resulting CO2 emissions could easily increase to the same level as options 2 and 4, that is, showing no decease relative to 2010.
A few model parameters are generous to new renewables. Less generous treatment could easily show increases over 2010 in CO2 emissions for all options that involve wind and solar.
- The wind capacity factor of 30% is at the high end of general experience world-wide, especially in extensive implementations.
- Lang reduces my calculator’s CO2 emissions increase rates for OCGT and CCGT in a wind shadowing/backup role by 50%, which is arguably conservative. Extensive studies are needed to establish the level that should be used. As I have indicated elsewhere, the availability of multiple gas turbine engine-generator sets may allow some gas turbines to run more efficiently in a wind shadowing/backup role. Countering this are other considerations, such as, the grid topology may not allow this type of co-operation of plants across an electricity system.
Turning now to costs, Figure 4 shows the resulting impact on electricity costs per MWh, which speaks eloquently for itself.
Figure 4 – Electricity Costs per MWh
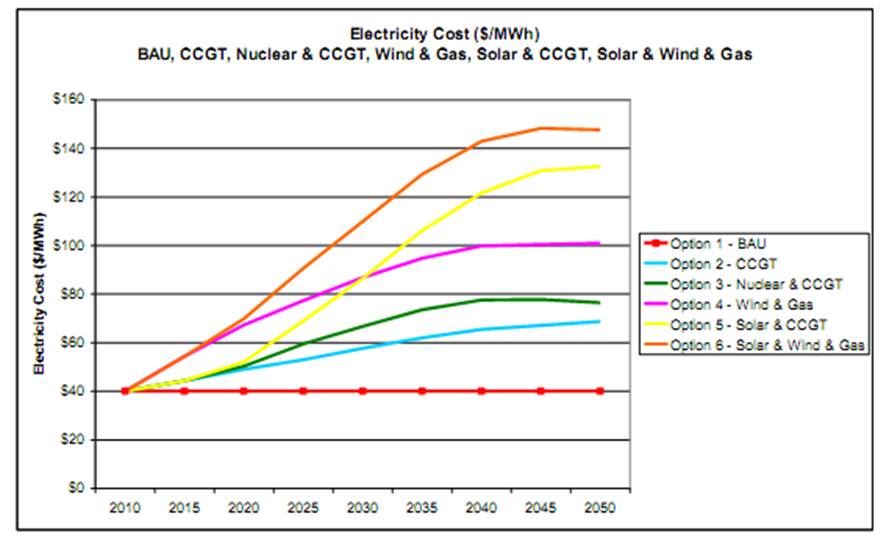
Suffice it to say that the three options involving new renewable energy technologies will result in electricity cost increases from 250% to over 300% of the 2010 levels.
Conclusions
Lang presents further proof that industrial-scale renewable capacity additions, particularly wind and in the near future, solar, are problematic in terms of meaningfully reducing emissions. They do not provide the impact that is needed in terms of energy independence, avoidance of fossil fuel use, and reductions in CO2 emissions that conventional wisdom, with all its inadequacies, dictates.
Acknowledging that we must make efficient use of all our resources and in the absence over the next few decades of significant advances in CCS technologies and breakthroughs in energy conservation/ efficiency, we must look to nuclear fission plants as a bridge to future electricity generation capabilities. In the meantime, the extensive resources needed for new renewable energy implementations would be better spent on energy conservation/efficiency measures and, perhaps of greater importance, research and development for future technologies including: CCS, nuclear waste management, nuclear fusion and solar.
As electricity is an essential resource for the well-being of people in all countries, approaches to providing it must be soundly based. To that end, Lang provides a much-needed and effective road map.
Lang, Peter (2010). Emissions Cuts Realities – Electricity Generation: Cost and CO2 emissions projections for different electricity generation options for Australia to 2050.
The focus on cost is important. I am an advocate of energy cheaper than from coal, the only way to persuade all nations to forgoe burning coal, through economic fundamentals. The liquid fluoride thorium reactor has the potential to provide power at $0.03/kWh (US). Aim High presents the benefits and technology of LFTR.
Good job, Kent Hawkins. Peter Lang’s work complements your own in this important area of inquiry. Thanks for clarifying the extra components in his various options, beyond #1, making them additive, that is, beyond what is now generated, excluding the coal phase-out.
You might have pointed out that his assumptions about a 25-year life cycle for wind turbines should also be questioned, particularly for proposed off-shore projects. There are a number of indicators, including the wind industry’s own insurance policies, that such life cycles don’t comport with reality.
Lang’s Option 6, the one with wind and solar reminds of nothing more than an Amory Lovin’s wet dream, full of sound and fury, but, as you point out, signifying very little.What must happen in this scenario on a cloudy day with low wind? There’s not enough reserve in the whole arsenal to compensate for such a situation–not to mention the likely insuperable problems with regulating the variability under such a load. Battery storage for such vast energies are not remotely on anyone’s horizon.
I hope Lang will reexamine his latest paper in the light of your critique here, honing it more carefully, and then consider placing it in an influential energy publication, where it could influence policy makers throughout the world.
[…] Kent Hawkins from the MasterResource energy blog has done a detailed write-up of and commentary on Peter Lang’s recent work on emissions reductions. It’s an […]
Kent Hawkins,
Thank you for this summary. For your readers, I’ll just confirm that I agree with the criticism about Option 6. Option 6 is so pie-in-the-sky for many reasons that I did not go into this level of detail in the paper. Likewise I agree with your other criticisms. The aim was to keep the paper sufficiently simple that it could be understood by the “intelligent, interested, non-specialist”. However, I do note that this is one of several improvements that will be needed in a subsequent version.
I should clarify for your readers that Figure 4 is not the total cost of electricity for each option. It is the cost of electricity from the proportion that is generated by coal and the replacement generators. The full cost of electricity from each option would include the cost of the proportion of electricity generated by the other generators (oil, hydro, etc).
Jon Boone,
Thank you for your comments.
You said:
“Thanks for clarifying the extra components in his various options, beyond #1, making them additive, that is, beyond what is now generated, excluding the coal phase-out.”
I am not sure I understand what you mean in this statement. The analysis is on the basis that the replacement technologies generate exactly the same power as the BAU option at all times. All six options supply the same energy per period. The replacement technologies replace the energy that would have been generated by coal as the coal generators are decommissioned. The five options beyond #1 comprise different technology mixes; they are not additive.
I agree with your comment about the assumed 25-year life for wind turbines. The comment also applies to the assumed economic life for solar thermal plant. The reason for using these figures is they are the figures in the authoritative references from which I sourced the data – e.g. EPRI (2009), NEEDS (2008). I had to use consistent figures from the authoritative references. The life expectancy affects the costs of electricity calculated in the source documents. I did not recalculate electrcity costs. The only place that I used these figures is to calculate when the installations would have to be replaced.
I think your comments about Option 6 are addressed in the paper. I did mention that the capacity margin is ignored in the calculations in this paper; the overbuild required for solar power is the subject of two previous papers (references sited in the pdf).
This is intended to be a “big picture’ comparison. If I try to get too detailed and too technical, I will lose the audience I am trying to reach. I agree some items do need to be addressed in a future version and Barry Brook and I do intend to submit a paper to a peer reviewed journal.
Thank you, Peter, both for your comments here and for your work in general. As I said, it’s important work that merits much attention, and am delighted that you intend to submit the paper for peer reviewed publication.
Perhaps it was my careless reading of your text, but to me it was unclear, in all your options beyond #1, what you meant by keeping a floor of natural gas, then adding OCGT and CCGT, since these are fueled by natural gas. It was in this sense that I used the word “additive.” In light of Kent Hawkins’ comments, and now your own, it’s now clear what you were doing.
That you explored–and compared– a range of fuel mix options for the future is extremely helpful. Last night I watched a debate forum in West Virginia, in which Robert Kennedy Jr claimed that wind and solar could replace coal generation in the United States within the next 20 years–this based on articles in the magazine, Scientific American, and on several recent Department of Energy feasibility reports.
But he did not say that such a scheme would offset meaningful levels of CO2 emissions (although he likely assumed this). Your work here, and that of Kent Hawkins, should go a long way in showing how feckless wind technology is as a means of avoiding this CO2 emissions.
As it is, even government reports like the one issued yesterday from the National Renewable Energy Lab, which admitted that even with extensive wind buildout, beginning with $93 billion of tax revenue spending, “the projected global warming benefits are modest: a drop of about 4.5 percent in emissions, at best.” Using your methodology for assessing the thermal behavior of all units involved with wind integration, even such a seemingly inconsequential figure of 4.5 percent will be seen as a gross exaggeration. At the scale imagined by the NREL report, and using your calculations, it’s likely that wind integration would actually increase the volume of CO2 emissions well beyond what they would have been without any interjection of wind technology at all.
Perhaps you and Kent Hawkins–and others–could one day collaborate on a multinational analysis that would be the methodological basis for evaluating any grid system’s potential for having wind technology used to abate CO2 emissions–assuming that real data will be made available for this purpose.
Thank you for investing the effort to analyze Peter Lang’s report. I have only one suggestion for today: I would prefer different priorities for better investing the money currently being wasted on renewable subsidies. You wrote:
If I were “king” I would amend that list to a single program: Gen IV sustainable nuclear power, meaning fast neutron reactors, such as the IFR design which was shut down by the Clinton administration. This class of nuclear reactor consumes what is currently defined as “nuclear waste” as well as newly mined uranium-238 — while producing as a side-benefit of power production, new fissile fuel of similar or greater energy-content as the input fuel. Unlike nuclear fusion this is not a search for breakthrough technology.
Rather it is an effort to accelerate the arrival of volume commercial scale deployment of already demonstrated experimental designs. I would also fund proof of concept implementation of another Gev IV reactor design, the LFTR (Liquid Thorium Floride Reactor) to assess what development investment and timeframe is likely required to reach commercial scalability. The LFTR is likely to be more cost-effective than the IFR design, but we have less experience with the design. LFTR may have a number of significant benefits w/r/t IFR, but time to implementation appears a risk because we haven’t operated LFTR designs. And I believe we need to start replacing new coal generation by about 2030 and old coal power soon after. This is a staggering industrial challenge – though a minor challenge compared to a policy that relies only on “renewables” like on/off-shore wind and PV/thermal solar generation.
Any useful low-carbon electrical (and thermal) generation solution must be “cheaper than coal”, at least cheaper than the coal price + realistic future carbon price, or the coal price + CCS price. We are not going to see a carbon price in the near future. My limited study on CCS reached the conclusion that we need to know if coal can be any part of the generation profile around 2050. The answer is determined by the true life cycle cost of CCS and the extent to which CCS is actually scaleable (and what geographies are scaleable). I am pessimistic on both, but believe we should risk a relatively small amount of taxpayer-supported R&D to evaluate CCS at scale — i.e., outfitting existing 1 GW coal-fired generation inland and near suitable ocean subfloor geology.
If we could pass a nearly-global increasing carbon price that electric utility executives believed to be real, the market might do the required development. As I said, a believable carbon price will not happen in the foreseeable future. So we need to incentivize the electric utility executives to choose nuclear over new coal, and (harder) to persuade them to replace existing coal with nuclear power. Proving out the life cycle cost of Gen IV will accomplish that.
Thanks for this post, Steve. The Gen IV should be given serious thought. But it appears as if it’s primarily for baseload. Are there promising nuclear units with flexible ramping that can follow load, thus allowing nuclear ultimately to handle virtually all demand economically?
Jon Boone,
The European EPR Gen III reactor being built in Finland, France and China claims to have the capability of ramping at the rate of 80 MW per minute and can operate down to 25% of its capacity. Of course, baseload is the most economic.
[…] work of engineers like Kent Hawkins in Canada (here and here), Peter Lang in Australia (here and here), Bryan Leyland in New Zealand, Jim Oswald in Britain, C. le Pair and Kees de Groot in The […]
[…] work of engineers like Kent Hawkins in Canada (here and here), Peter Lang in Australia (here and here), Bryan Leyland in New Zealand, Jim Oswald in Britain, C. le Pair and Kees de Groot in The […]