Wind Integration Realities: The Bentek Study for Colorado (Part III)
By Kent Hawkins -- May 25, 2010[Editor’s note: This is the third of four posts on (elevated) fossil-fuel emissions associated with firming otherwise intermittent wind power. Part I introduced the issues. Part II showed negated emission savings for the Netherlands at current wind penetration (about 3 percent). Part III (below) and Part IV tommorow examine the higher emissions from wind in Colorado and Texas, respectively, according to a new study by Bentek.]
The Bentek study is a significant contribution to the wind/fossil-fuel emission literature despite some notable limitations. The study analyzes the PSCO system, which dominates Colorado’s needs, and the ERCOT system in Texas, which manages 85% of that state’s electricity.
The analysis includes SO2, NOx and CO2 emissions. Bentek looks at coal cycling events only in both cases, ignoring any gas cycling, while noting PSCO’s acknowledgement that wind impacts gas as well as coal.
There are reasons why coal cycling is focused upon:
- Although gas turbine plants are better suited for cycling to support wind, for both PSCO and ERCOT gas resources are insufficient to balance all the wind energy produced.
- There is a small amount of pumped storage available to PSCO, which can run for only four consecutive hours.
- Wind is strongest at night when base load coal plants predominate, and there is reduced gas generation, which may not be sufficient to safely cycle gas plants.
- As a result, reported gas cycling events at PSCO are less frequent than that for coal.
Both analyses utilize published production information. As PSCO does not reveal hourly wind production, for emissions analysis purposes, Bentek has to rely on a few coal cycling events in relation to detailed wind production provided in PSCO training manuals. This limitation is offset by the information available on a notable increase in coal cycling, which has occurred during the period of wind introduction, and which is arguably attributable to wind. As ERCOT does release wind production at 15 minute intervals, the same analysis approach is used in the Texas system to validate the Colorado results, which it does.
Criticisms that the PSCO analysis is based on two days experience only, are well answered in the Bentek report. The reality is that PSCO does not make the necessary information available, and Bentek has done well with what they had to work with. Also, the validation of results based on the ERCOT experience is important. Finally, Bentek appropriately acknowledges limitations by calling for more comprehensive studies based on detailed information.
Having established that RPS appear to add to the emissions problem, Bentek concludes that, given RPS, it will be necessary to incorporate adequate flexible fuel capacity facilities (gas plants) to ensure reduction in emissions, which is true enough. What is missed in this logic is that incorporating such new facilities without RPS will achieve even lower emissions. More on this is provided below. There are not only more emissions with RPS than without them, but also there is duplicate capacity installed (wind) at significantly higher costs, which adds notably to the costs of electricity.
PSCO Results
This section looks at the PSCO system in more detail and compares results with the Netherland’s study in Part II and my CO2 emissions calculator.
First, there are a number of relevant, notable characteristics of the 2008 Colorado electricity production profile.
- The utility portion of the total electricity production is about 80% of the total.
- Wind penetration is 6% of the total production, including independent suppliers, which is high and in the same range as Germany, where wind curtailment is necessary.
- The ratio of gas to wind production (excluding independent suppliers) is about 150%. It is necessary to have a ratio of 200-300% for gas to operate in the wind balancing role. This, plus the nature of wind production to be highest at night, explains the high degree of cycling required by the coal plants.
Because of cycling events, arguably attributable to the presence of wind plants, the findings are that in 2008 the coal plants produced an additional 152,000 tons of CO2 emissions over running stably without these events, and in 2009, an additional 93,000-147,000 tons.
How does this compare to what my calculator predicts? The following are the input considerations.
Wind Capacity Factor
The referenced NREL metadata file indicates a theoretical capacity factor of about 31% based on the wind profile. However other published data from the DOE/EIA shows a wind capacity factor 35% in 2008. Colorado does have a stronger wind regime than Texas with a similar relative wind penetration at about 5%. This means that curtailment should be the practice, as is the case in Germany. Surprisingly, given the capacity factor and penetration, there is not much curtailment of wind production in PSCO during 2008 as reported by the NREL.
Heat Rate Penalty and CO2 Emissions Increase Factor
One of the calculator inputs is heat rate penalty or the loss in efficiency due to the presence of wind for the fossil fuel plants used in the wind balancing role. The study of the Netherlands system by Le Pair and de Groot developed a way of calculating this (at ?F=0) as follows: [Here ? was intended to be the Greek letter delta, or “change in. Looks like WordPress cannot handle this character in the text]
?R = (Ew / E) x R
Where:
?R = the overall efficiency loss due to the presence of wind plants of the power station fleet
Ew = the electricity production of the wind plants
E = The total electricity production of the wind plants and the fleet of other power stations
R = The efficiency of the these power stations without wind present
From DOE/EIA published information, for Colorado in 2008, and an assumed R of 41% based on the U.S. national average, this is:
?R = (3,200/39,400) x 41% = 3.3%
Bentek shows a 2% increase in all plants on one day on page 42. For the following analysis however, 3.3% will be used, based generally on the strength of the Colorado wind regime. Also, on this basis, there is consistency with the ERCOT analysis in the next part of this series.
Based on the Netherlands study’s Table 3, and using a ?R of 3.3%, means a heat rate penalty for plants in the wind mirroring role of (45.0-29.2)/45.0 = 35%. As indicated in Part II, using a different initial R value produces the same percent heat rate penalty. The calculator factor for fossil fuel and CO2 emissions increase is therefore 56% (an extension of the table in the calculator, which stops at 30%)
Calculator Results for PSCO
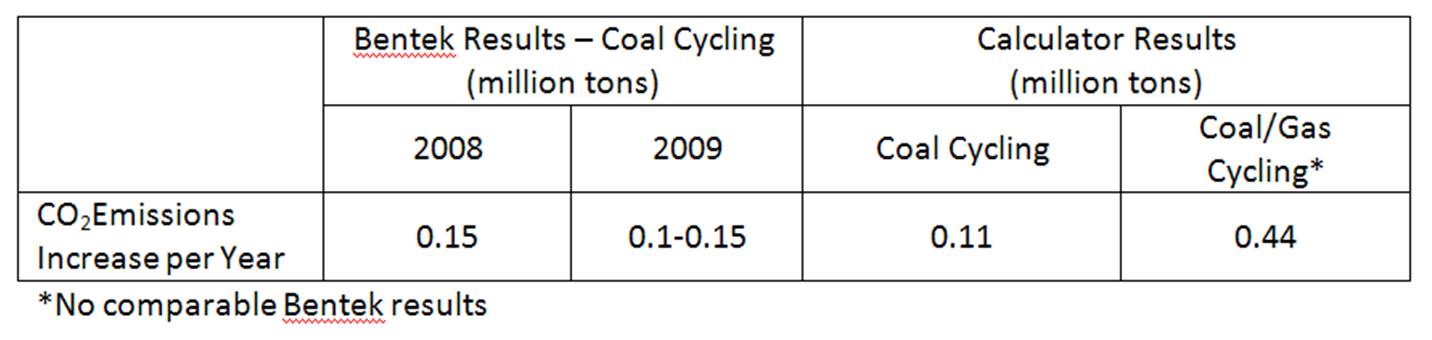
The resulting calculator CO2 emissions increases for coal cycling only are 100,000 tonnes (110,000 tons) per year, which is in the same range as the Bentek results.
A reasonable view is that both coal and gas plants will be involved in cycling at different times, so the calculator was used to show this as well, although there are no comparable Bentek results. As PSCO-owned coal capacity significantly exceeds that of gas and, because wind is strongest at night, coal is more heavily weighted in the wind balancing mix at 80% coal and 20% gas. The total ERCOT gas mix is heavily weighted to OCGT on a capacity basis, and for wind balancing all the gas is assumed to be OCGT, or CCGT operating as OCGT. Frequent cycling of CCGT plants damages the HRSGs (Heat Recovery Steam Generators) so single stage operation is needed. In summary, more OCGT production is used than would be required if wind was not present in the system. The emissions increase over normal coal/CCGT operations becomes 0.44 million tons per year. Table 1 shows the comparison of the Bentek results with the calculator.
Table 1 – Comparison of Bentek Study and Calculator results for PSCO
The results are remarkably close considering that the calculator provides a general model, which is a working hypothesis of expected fossil fuel consumption and CO2 emissions with the introduction of wind power into an electricity system. In the absence of adequate studies using finely time-grained (less than one hour) production information and fuel consumption for the applicable generation elements over sufficiently long periods of time and dealing with the fast ramp rates required, it was developed as an interim measure and framework.
If the coal/gas results look odd, it is necessary to look at the absolute numbers, which are provided in Table 2. The calculator results are in tonnes, but this has been converted to tons in the last row.
Table 2 – Absolute Levels of CO2 Emissions for Wind Mirroring Fossil Fuel Plants (Without and With Wind Present)
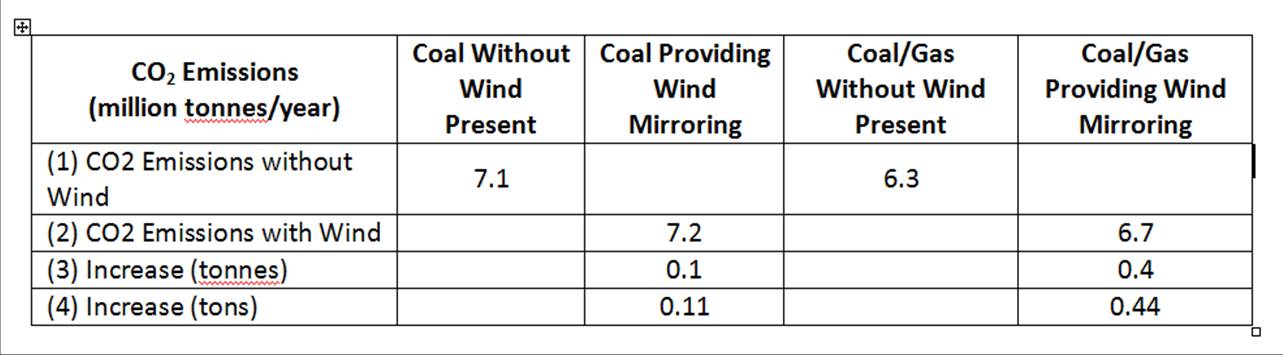
This shows that by introducing CCGT plants to replace the portion of coal plant production that would be used for wind balancing, but operating normally in wind’s absence, there is an immediate saving of 0.8 million tonnes of CO2 emissions (7.1-6.3), as shown in row (1). As shown in row (3), with wind present, the CO2 emissions increase is higher in the coal/gas case largely because of the need to use OCGT (or CCGT operating as OCGT) plants. However, row (2) shows the absolute level of CO2 emissions is less than using coal solely to balance wind. One of the key findings of the Bentek study is that adding flexible generation resources, such as that provided by natural gas, facilitates the goals of RPS without increasing emissions. This is true enough, but this ignores the reality that using gas without wind is a better solution, by 0.4 million tonnes per year (6.7-6.3), as shown in rows (1) and (2).
Conclusion
In summary, Table 1 shows that the Bentek study findings for PSCO are consistent with the Netherlands study, given the higher wind penetration, and in the same range as the the calculator results.
Part IV in this series will analyze the Bentek results for ERCOT in a similar manner, which validates these results, and addresses the issue about the limited information available from PSCO.
Here are links to the previous posts in this series:
Part I – Introduction
Part II – The Netherlands Study
I hope people are paying attention to this report, for several reasons. If not only exposes the spurious claims made in support of wind technology but it also is a clarion call for realtime measurement of wind integration reality, now made opaque by laws that allow wind LLCs to hide their performance behind cries of proprietary confidentiality. Thanks, Kent, for an outstanding job here.
A correction to the text has been made. The formula from the Netherlands study for ΔR is valid at the point that the fossil fuel savings become zero (ΔF=0). The calculation of ΔR is reasonable because the Bentek reported CO2 savings (and consequently the fossil fuel savings) for PSCO is very close to zero (-0.31%).
[…] of Colorado and Texas by BENTEK Energy, LLC, in addition to a study of the Netherlands, found the coercion of […]
A new study conclusively answers this question, and it turns out that wind energy’s emissions savings are not undermined by additional cycling at fossil-fired power plants:
http://www.nrel.gov/electricity/transmission/western_wind.html
Michael,
Nice try.
Because of their highly variable and random production over short time periods (minutes), wind and solar PV cannot be realistically or properly analysed using statistical methods to evaluate real time events. This statistical approach hides the real time impacts, and electricity systems must balance load and generation in real time (again minutes).
To illustrate, I have done some analysis of the BPA wind performance, at 5 minute intervals (which still masks some greater volatility) and 14% wind penetration in energy terms, which shows that, statistically speaking, the standard deviation of the increase in ramping of load minus wind versus load alone is 26 MW. However, the real time effects show over 8 instances per day (one every three hours on average) of over more than three times this level (three standard deviations), with one event per day (on average again) in excessive of 200 MW which is over 8 standard deviations. Note that the ‘averaging’ over time of these events does not mean that their occurrence cannot be more concentrated in real time. There are more ‘black swans’ in wind production than statistical approaches are designed to handle, if you want to avoid severe consequences. For real world experience, talk to the financial industry about this.
Statistical analysis is based on the assumption that the distribution of 99.7% of all events is contained within three standard deviations. Therefore the BPA analysis shows that three standard deviations should exclude only 7 ‘black swans’ or extraordinary events. Over the period measured there were 52 or over 7 times this number. This shows that it is questionable and risky to apply statistical analysis here in connection with our electricity systems on which so much of our well-being depends.
For the purposes of planning reserve requirements based on the use of reliable, dispatchable generation plants in the electricity system (and wind and solar PV are neither), statistical methods have some value.
Having said all this, statistical analysis of wind and solar PV performance may have some value if limited to providing some indication of the relative effect of their use (1) between jurisdictions, and (2) within a jurisdiction between time periods and wind and solar PV penetrations, for example. But, and this is important, it is not valid for the determination of absolute values, especially actual reserves required, stress on wind balancing plants and, importantly, emissions.
I should introduce you to the ‘Statistics Professor’ who some time ago in a comment tried to convince me that statistical methods are applicable in the analysis of real time wind performance, claiming that the ‘square root of the sum of the squares’ formula properly captures the real time effect of combining two random series – in this case the net of wind and load and load alone. Perhaps you already know him, being of like mind on this issue.
In short, you have neither proved your case, nor disproved mine.
It looks like this issue is not going to go away, so for a more complete response I will have to look at completing my BPA analysis when time permits.
[…] generators, and when those fossil fuel plants ramp up and down repeatedly in a back up role, they emit more pollutants than they would if they just ran consistently without the renewables on the […]
[…] the use of those fuels, as the recent Bentek analysis in Colorado and Texas has shown. (Also see http://www.masterresource.org/2010/05/wind-integration-realities-the-bentek-study-for-colorado-part-… and […]