Properly Representing Wind and Solar in Electricity Systems: Electricity Generated (Part II)
By Kent Hawkins -- April 12, 2017“If the purpose is to show fuel consumption by various fuels in electricity generation, the correct measure is not the electricity produced but the fuel consumed with the impact of erratic and unreliable wind and solar generation accounted for.”
This is the second post in a series reviewing Power magazine’s article on the International Energy Agency (IEA) paper, the recent World Energy Outlook. Part I yesterday dealt with installed capacity projections to 2040 and showed that this was a misleading measure. This post will show that in understanding fuel consumption, simply reporting the electricity produced is also misleading.
To illustrate the trends in fuels for electricity generation, the Power magazine article shows a more complex chart of electricity generation flows (compared to the installed capacity in Part I), reflecting such things as the net effect of plant closures and new plant construction to arrive at a result for 2040. This is a more realistic representation than installed capacity, but the graphic is not easy to re-create and understand.
Electricity Generated
Table 1 shows the information in a more comprehensible form. I do not know why the starting point changed to 2014 from 2015 in Part I.
Table 1 – Electricity Produced by Fuel from 2014 to 2040 as published in Power Magazine
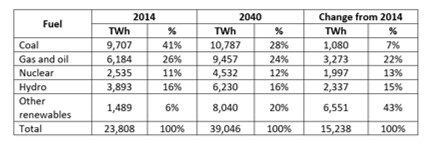
On the surface, it appears that the 2040 total for other renewables (wind, solar, and biomass) are challenging coal and gas individually. The other renewables growth to 2040 appears impressive and considerably exceeds that of fossil fuels combined. However, the projected capacity factor for wind and solar is 31 percent, which is possibly somewhat generous.
What is wrong with this representation is that electricity generation (as well as costs and installed capacities) cannot be directly compared between non-dispatchable generation plants (wind and solar) and those that are dispatchable.[1] The reason is that non-dispatchable electricity is not reliable or useful by itself.
The other consideration is that electricity produced does not necessarily correspond to fuel consumption on a one-to-one basis. With wind and solar present this becomes a major consideration, because of the loss in efficiency experienced by fossil fuel plants balancing the unreliable and erratic nature of wind and solar electricity production to turn it into useful electricity supply. (I used the term ‘wasted energy’ and ‘friction’ to describe this previously.[2])
Ignoring this, unfortunately, appears to be the generally accepted practice in dealing with the relative characteristics of electricity generation technologies. Why? I assume it is because this is a complex and not well understood matter, and it is possibly commonly accepted that it can be ignored.
So, if the purpose is to show fuel consumption by various fuels in electricity production, the correct measure is not the electricity produced but the fuel consumed with the impact of erratic and unreliable wind and solar generation accounted for.
Fuel Consumption in Electricity Generation
Table 2 shows the primary energy consumption, converted from TWh to Mtoe (million tons of oil equivalent), assuming conversion efficiencies to electricity are 40 percent for all primary energy sources,.[3] TWh could have continued to be used, but this conversion is done primarily to clearly differentiate this from electricity produced.
Table 2 – Primary Energy Consumption by Fuel in Mtoe
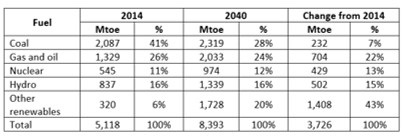
This sets the stage for the necessary adjustment to energy consumption, reflecting wasted energy.
Wasted Energy Considerations
In Part I yesterday, it was shown Capacity Factors alone did not cover all the considerations necessary to make direct comparisons with dispatchable generation plants. In the capacity case, and Capacity Credit had to be applied instead.
In this case, the effect of wasted energy must be accounted for. The wasted energy is due to the need to continuously balance erratic wind and solar to produce steady, reliable, and hence useful, electricity. This must account for the dynamic minute-by-minute operation (dynamic efficiency impact) forced on wind and solar balancing plants, in addition to any reduced efficiency due to part loading alone (static efficiency impact) as described in note 2.
If there is no efficiency loss due to part loading and short-term dynamic loading, then there is no increase in fossil fuel consumption from that shown in Table 2 even at the decreased loading of fossil fuel plants with wind and solar present. However, if there is decreased efficiency, for the reasons described above plus more frequent plant start-up/shut-down, then the fossil fuel consumption will likely increase substantially because of the efficiency losses experienced. This could extend to no savings in fossil fuel consumption with wind and solar present, or even more fossil fuel consumption.[4]
The assumptions used in establishing real primary fuel use here are:
- The effect of the reduced efficiency is taken to be based on zero fossil fuel savings, so the fossil fuel plants will experience increased fuel consumption to the level they would have experienced in generating the electricity replaced by wind and solar energy, which is the equivalent of the primary energy consumption of wind and solar. So, this amount is added to that for the fossil fuels, which increases the overall energy consumption total in Table 2.
- As gas will likely be the main wind and solar balancing technology, the added primary energy consumption will be allocated to coal and gas in the ratio of one-third to coal and two-thirds to gas. In the calculation, the biomass component is not included in the increase to other fossil fuel energy consumption.
- Hydro is a candidate for balancing wind and solar but a less useful one because of their short term erratic behaviour, which is a major source of efficiency loss.
Table 3 shows the results. Intermediate levels of efficiency loss can easily be determined by interpolating between the differences in Tables 2 and 3.
Table 3 – Takes into Account the Reduced Efficiency Imposed on Fossil Fuel Plants by Wind and Solar
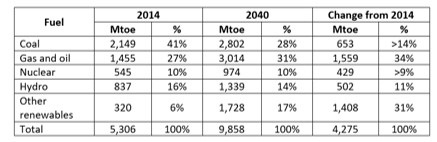
This notably reduces the total of wind and solar (representing about 90% of Other Renewables) relative to the fossil fuels such that these are not challenging fossil fuels to any significant degree. In terms of the change from 2014 to 2040 wind and solar do not dominate as before in total or combined fossil fuel consumption.This is more likely representative of fossil fuel consumption than that shown in Table 2. What Table 3 says is that, although no more electricity is generated, more fossil fuel is consumed because of the increased inefficiencies of the fossil fuel generation plants due to the presence of wind and solar.
This means that wind and solar can be removed from Table 3, returning the totals to those shown in Table 2, and:
- No additional capacity is required as the wasted energy due decreased efficiencies with wind and solar present can be replaced by the existing fossil fuel plants. This was shown graphically in Part I, Figures 5 and 6.
- There will be no increased emissions from fossil fuel generation plants because no additional fossil fuels are consumed.
Impact on Dispatchable Generation Plant Capacity Factor
Capacity factor is the ratio of electricity produced over time (usually a year or years) to the maximum that the installed capacity can produce for the same period. It is normal for an electricity system without wind and solar to have an overall capacity factor of about 50 percent. At peak loads all the installed capacity is called on, which includes meeting demand and providing a range of services to ensure system reliability, including reserves. This should be about 20 percent of total installed capacity.
Table 4 shows the impact on the capacity factors of coal, gas, nuclear and hydro with and without wind and solar present.
Table 4 – Capacity Factor Comparison with and without Wind and Solar
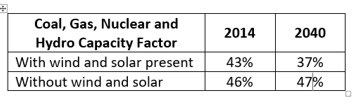
Note the improvement in global capacity factors without wind and solar present in electricity systems, especially in 2040.
Conclusions
Comparisons cannot be directly made between electricity produced by non-dispatchable generation plants (wind and solar) and dispatchable, reliable generation plants.
Fuel consumption should not be assumed to be equivalent to electricity produced.
The main take away from the Power magazine article is that renewables (especially wind and solar) will strongly take the lead over coal and gas through 2040. The article claims that the “coal boom is over” and the outlook for gas is “dim.” Taking into account the decreased efficiencies in fossil fuel plants with wind and solar present, these are very questionable statements.
————
[1] See DOE/EIA document http://www.eia.gov/outlooks/aeo/pdf/electricity_generation.pdf. Note comments in the second paragraph on pages 2 and 4 and in the following tables that wind and solar are shown separately.
[2] See http://www.masterresource.org/energy-sources/primary-energy-electricity-ii/, under heading ‘Wasted Energy from Wind, Solar Forcing”. Further to the driving a car on a highway illustration, add the consideration of stop/start/idling in rush hour traffic in major cities.
[3] This appears to be a very rough approach, but closer examination will likely show difficulties in setting individual efficiencies on a global basis and accounting for aging generation plants, especially wind and solar. This more complex approach will not likely materially change overall results and could be equally questioned in detail. For more information see http://www.masterresource.org/energy-sources/primary-energy-electricity-ii/, endnote 1.
[4] It is reported that KEMA, an international energy consulting firm based in the Ne therlands, showed that the cycling of fossil fuel plants from a normal full load to reduced load and back to normal over one hour resulted an increase of more than 1% fuel consumption over operating normally for the same period. See paragraph 4.a Cycling at http://www.clepair.net/windSchiphol.html. This means that this limited cycling of fossil fuel plants increases emissions over their steady state condition, and it is reasonable to expect that continuous frequent cycling within the hour would increase this even more. This cycling already occurs in load following in the short term and the same, but to a greater degree, when balancing wind. Note that when cycling less electricity is produced over the hour than normal, steady state. This strongly suggests that the fuel consumption and emissions increases with the presence of wind. So simply relating emissions to electricity generation with simplified efficiency assumptions is a questionable approach to analyzing wind emissions performance.
Increased maintenance is another cost, in dollars and downtime, that is not factored into what’s required to provide a dependable power supply.
Boilers, turbines and all generating plant systems that undergo frequent temperature cycles develop cracks, leaks and all manner of problems that are minimized when the systems are base loaded. So, the backup power for non-dispatchable, unreliable wind and solar power itself becomes less reliable and less available.
I confess to being biased and a bit of a ludddite. Additionally, I’m an AGW skeptic, spent most of my career in and around power plants, and think the government messes up pretty much everything it meddles with. (ex: South Australia) The greens have sold the masses a bill of goods, and I don’t think they’re going to be happy with the results.
Reply to Bob Cherba
Re: “Increased maintenance is another cost, in dollars and downtime, that is not factored into what’s required to provide a dependable power supply”
The pernicious effects of renewable energy in California are often masked and go way beyond added maintenance costs.
I suspect that the shut down of the San Onofre Nuclear Power Plant due to a purported botched retrofit of the fuel rods was really a retrofit of the plant so that it could ramp up and down as a peaker plant to coordinate with the unpredictability of non-dispatchable green power.
I wrote an article “Curtailed Hydro from Wanapum Dam Crack: An Unpredicted Change in the Wind” (MasterResource March 17, 2014) about how a crack in Wanapum Dam in Washington state may have been due to a retrofit of the power station due to the “risk of having a major system event for an unpredicted change of the wind energy level increases”.
The KEMA report is crucially important. All should read it. Kent once again exposes the issue with wind and solar. It’s not just that these dilute energy sources cannot produce modern power; rather, it is that their performance renders them dysfunctional to grid systems, making everyone and everything around them world work much harder just to remain in place.
Power magazine’s penchant for publishing projections of power generation 25 years in the future gives some idea about how low its standards have become. Such projections have no accountability, providing gossipy prattle in lieu of genuine epistemics. Beyond this, Kent shows how remarkably silly the article’s mainline methodologies are.
As I keep reminding Master Resource readers, one doesn’t need to make up future scenarios to see how problematic wind and solar are. The best guide to this is found in the past. Take any grid with a substantial amount of installed wind and solar on it. Examine a five year history of the grid’s generation mix consumption, accounting for changes in demand and import/exports. Note the annual output in MWh of wind and solar. Check any corresponding reductions in conventional generation, especially that for fossil-fired generators, that should follow the wind/solar output. The result: there is no correlation between wind/solar output and any reductions in conventional generation. It’s as if wind/solar had no effect at all. Take a bow, Kent.
As I’ve also reminded MR readers over many years, the more wind/solar, the more need for fossil fired generators. There is no zero sum relationship here. It’s all a win/win for fossil fuels. Which is why every energy corporation, including Areva, has wind/solar deeply embedded in their investment portfolios.
This is a scam of enormous financial and intellectual consequence. Making the commonweal falsely believe that the shepherd boys of wind and solar are the mortal enemies of philistine fossil fuel Goliaths is the basis for a relatively few informed people to make a lot of money, at nearly everyone’s expense. Imagine how contemptuous these bunco artists are of the climate change crowd who so ignorantly believe renewables are the best means of saving the world, in the process enabling the fraud. Someday, perhaps sooner than later, someone will make a film of the energy version of Dumb and Dumber….
Jon,
You are in great form, as usual, and correct as usual.
One only needs to monitor the Energiewende, to see it, slowly but surely, marching off to the deep end. The next five years or so should reveal lots of fun.
It appears that CA is getting close to a Leman Brothers moment which will be discussed live:
http://www.energy.ca.gov/2017_energypolicy/documents/index.html#04242017:
“April 24, 2017
Joint Agency IEPR Workshop on Risk of Economic Retirement for California Power Plants
Submit comments. Integrated Resource Planning. (17-IEPR-14)
Workshop Notice, (17-IEPR-14). Submitted April 12, 2017”
By now the powers that be- that have already said it’s ok for my in-their-80’s in-laws to pay 50% to 100% more for a kWh of electricity in the winter to help pay for the efforts to address CC- have figured out that a few little details seem to have been left out of the plans……….
The legal community is looking forward to years of lucrative work- http://www.cleanenergylawreport.com/energy-regulatory/caiso-expects-it-may-need-to-curtail-up-to-8000-mw-this-spring-and-up-to-13000-mw-by-2024-which-could-test-curtailment-risk-allocation-provisions-in-renewable-ppas/?utm
Mark