US Renewable Energy Output: A Closer Look
By Stanislav Jakuba -- May 2, 2018“There is also an oft ignored consideration for the ultimate number of wind and solar installations to be built and operate: a complete fleet turnover would be needed four or five times a century.”
Note: This report analyzes the output of renewable-electricity sources in the U.S. for the last twenty years. It is based on data published in annual reports of the Department of Energy (DoE).[1] The listed numerical values for power have been converted here to just one unit, the watt (W) accompanied by the international symbol for billion (G). Using just the GW* makes numerical comparisons straightforward throughout the article.
The Department of Energy (DOE) lists six renewable sources: Wind, Solar, Hydro, Wood, Waste, and Geothermal, where “Solar” implies the combined output of both photovoltaic and concentrated-solar power plants.
The six sources are usually presented as two groups: Wind and Solar (W&S) in one, and all the others (H&W&W&G) in the second. Accordingly, the following two graphs show the history of the two groups in separate charts: W&S (Figure 1) and the rest in Figure 2.
Figure 1 Wind and Solar
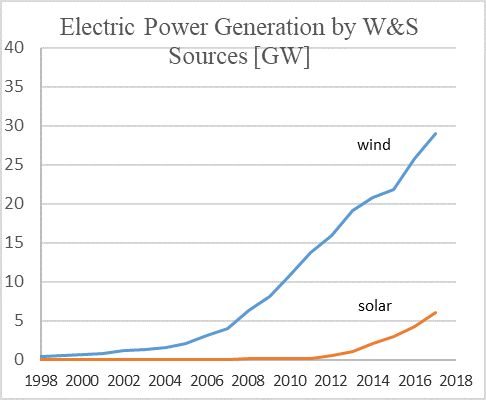
Figure 2 All Other Renewables
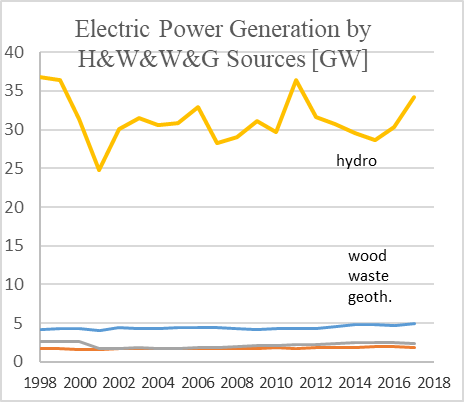
A quick glance at the graphs reveals the upward trends in the W&S chart and the near-horizontal lines in the H&W&W&G one. In the latter, the wiggles in the line for hydro output are caused by differences in rainfall and irrigation demand from one year to the next rather than man-caused influences.
The combined output of W&S in 2017 amounted to 29.0+6.0=35 GW, a 16.5 % growth from last year. The decade-long growth in wind power indicates a linear trend of about 2.5 GW/y. At that rate, it would take two centuries to reach the 468 GW, the 2017 electricity consumption in the United States. Except that the consumption will, most likely, be increasing during those centuries.
The solar contribution, which has grown to 1.2 GW/y in the last two years, would shorten the period accordingly. As for the U.S. primary energy consumption of 3300 GW, it would take a thousand years for W&S output to reach that level. Except that these centuries-long projections for the W&S would, of course, be realistic only if some large-scale storage technology existed, one that was also relatively inexpensive, inasmuch as W&S electricity alone is already many times costlier than that originating from traditional plants.
For illustration, a 1970s nuclear plant[2] cost 2.4 $/W, the dollars adjusted for inflation and the wattage reflecting the actual, average power delivered over several decades. In comparison, an off-shore wind farm[3] exhibits 21.0 $/W, all conditions the same. The nuclear plant is still running in its fifth decade. The wind turbines are being dismantled after the usual two decades.
Concerning the reported output of W&S plants in general, the wattage delivered is exaggerated, for unlike nuclear and heat plants, W&S draw electricity from the grid when there isn’t enough wind or insolation. In some plants, as much as one tenth of the power is drawn from the grid at those daily and nightly events and during repair and maintenance. For example, a CSP[4] in Mojave desert draws some 9% of its power from the grid and from burning fossil fuels.
There is also an oft ignored consideration for the ultimate number of W&S installations to be built and operate: a complete fleet turnover would be needed four or five times a century.
Today the W&S industry already employs slightly more than either the gas or coal industry at about 250,000 jobs. But jobs are a cost, not a benefit; that employment produces 1% of overall energy generation in the US. As for electricity alone, one employee at heat plants accounts for 1600 kW vs. 16 kW in W&S plants, a hundred times more.[5]
Available work-force will be insufficient to manufacture, operate, maintain, tear down, dispose of, and erect all those millions of W&S plants needed every 20 years. All of us would work for the W&S industry, its operators, suppliers, contractors, maintenance and line crews, etc.
The Other Renewables
As is apparent from the H&W&W&G graph presented earlier, the near-horizontal trend lines of those four sources attest to the lack of an appreciable growth and, aside from hydropower, the negligible contribution. There has been no worthwhile upward trend in W&W&G in two decades, yielding 9.1 GW combined, while hydro registered its usual ups and downs, ending at 34 GW in 2017. The combined yield of all six sources is lower today than it was two decades ago.
Increasing hydro’s yield would require either more rain or reduced irrigation. (Dams sometimes serve both power and irrigation purposes). The rain is beyond our control. Regarding irrigation, are we willing to cut down on fresh veggies? Some propose to build more dams, or equip current irrigation and flood control dams with turbine-generators. The trouble is that too few sites are suitable for the damming and some of those could not be built because of environmental concerns anyway. The retrofitting offers too low a return on investments, if any. Which is the same reason why engineers in that past did not equip them with generators when it would have been much cheaper. And that was at times when electricity was more expensive and environmental restrictions fewer than today. The builders undoutedly considered also the ultimate death of all dams – silting.
The three “Other” sources, wood, waste, and geothermal, unlike the wiggling hydro, provide steady supply from year to year, but it is minuscule in comparison. Besides, although wood and waste are renewable sources they cannot be classified as clean: their burning emits CO2 as well as “real” pollutants such as those that one can smell. Thus the legitimate, clean, sources in the “Other” category are just hydro and geothermal. They yielded 29+6=35 GW in 2017, with hydro contributing 94 % of the total from the H&W&W&G group. That output inevitably will continue averaging at the same level for the foreseeable future, hydro’s annual deviations alone exceeding the values of the three others.
It should be stressed that those four sources cannot be claimed a result of the recent clean energy financing; they existed long before those budgets did. Nevertheless, the DOE considers them to be not only a relatively recent addition to the renewables group but also growing rapidly. The DOE/EIA annual report contains the following true-but-misleading statements:
Between 2005 and 2015, electricity generation from solar increased 48 fold, from 550 GWh to 26,473 GWh.
Biomass increased 18.3% from 54,277 to 64,191 GWh, and geothermal increased 14.1% from 14,692 to 16,767 GWh. (Biomass is “wood” and “waste” in the graphs.)
Media then broadcast those percentages without revealing that the 48-fold increase from a near-zero value is still very small; both lines in the graph are essentially horizontal. The DOE statement is also misleading as it fails to report the decrease in hydro during the same period – a decrease that outweighs the sum of the increases many fold. The overall decline in the sum of the four is not mentioned in the DOE/EIA report at all.
Looking at the H&W&W&G graph again, notice that selecting the starting point later (say at 2001) would have given a much different growth percentage; this is just another illustration of how misleading statistics can be.
The following graph then shows the combined output of W&S, the only renewable sources with a growth potential. Their output grew to 6+29=35 GW in 2017.
Figure 3. Wind and Solar
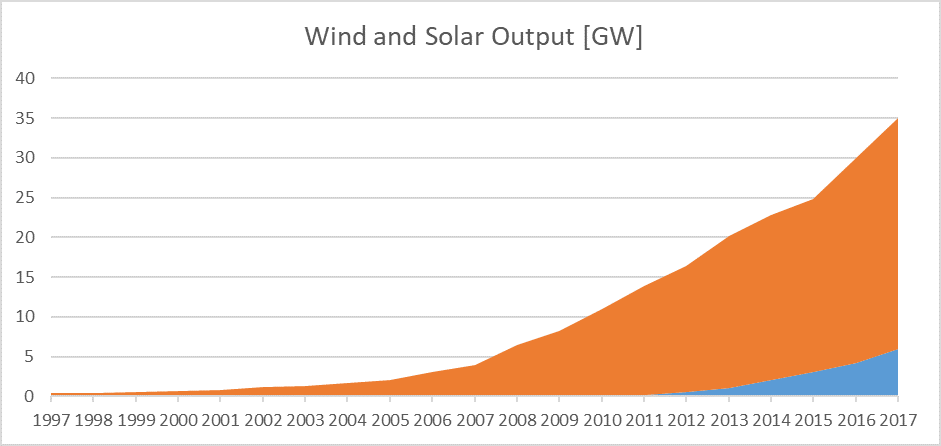
To estimate the future output, these two sources together would have to be producing an additional 468-35=433 GW in order to achieve the 100 % renewable-electricity generation that is being proposed by some. Should electric cars become ubiquitous – see Gasoline vs. Electric Cars[6] – they alone would be consuming another 110 GW lifting the total to 543 GW. That 15-times greater than present output may be theoretically possible, but the high cost of W&S electricity over the current one would have dire consequences for the US, to what purpose?
Conclusion
About $3 trillion has been spent on the renewable energy effort since 2004, and the figure has now stabilized at about $300 billion for each one of the last six years.[7] The return on that investment is illustrated in the preceding graph that shows the twenty years history of the W&S yield. For a comparison, the mentioned nuclear power plant – another source of clean and green electricity and also heat – cost $4 million, inflation adjusted. Not billions, just millions. Thousands of them could have been producing power for the money spent on renewables today, making our country and the world cleaner and richer as a result.
As to the likelihood of the W&S output slowing the dreaded climate change, that 17 % of electricity or 1 % of total US energy consumption, is not going to do it, nor is it possible to measure one reliably as yet. On the other hand, the manufacture, operation and disposal of the W&S plants is releasing pollution, and also consume both electricity and fossil fuels during no-wind and no-sun periods.
Despite this discouraging renewable energy history, documented numerically in voluminous literature, our country and individual states continue year after year to commit us, the tax- and rate- payers, to the goals of “20, 50, …. 100 percent of energy to be derived from clean, renewable sources in 5, 10 …. 20 years.” That, despite seeing those goals not met and budgets going red repeatedly.
*A note on units in the DOE annual statistics: It lists different units for different energies making comparisons difficult and confusing. Unified in this report on the power unit watt, 1 GW = 8770 million kilowatt-hours (per year). The “per year” is implied in the tables, but not stated. This omission in the headings is one reason why there is confusion in converting power and energy numbers. Where the watt should suffice, there are also joules, calories, Btus, …., and any of them per second, hour, day, or year, e.g. 1 GW = 30 TBtu/y = GJ/s.
References:
[1] www.doe.eia Annual Energy Review
[2] www.Millstone Nuclear Power Plant complex in CT
[3] www.Vindeby Offshore Wind Farm – Denmark
[4] www.masterresource.org/ivanpah-solar-plant/ivanpah-solar-fail
[5] www.Bloomberg: There Are More Jobs in Solar than Oil and Gas, Coal Extraction in the U.S.
[6] www.masterresource.org/electric-vehicles/energy-usage-cost-gasoline-vs-electric
[7] www.bnef.com/dataview/clean-energy-investement/index.html
Stan Jakuba, MIT ‘70 West Harford, CT
While capacity (measured in watts, W) is one important metric, it is only one piece of the puzzle, and is somewhat misleading to the layman when used in comparisons such as this. The chart of S&W capacity shows ‘tremendous’ growth, while, given capacity factors, the growth in actual production (in watt hours) is strikingly NOT so. In other words 1 GW = 8770 million kilowatt-hours (per year) is never achieved and is a ‘hidden’ but crucial comparative that needs light.
The 8770 is a conversion factor. Unrelated to Capacity Factor.
Concerning C.F., this report presents values for electricity delivered to the grid. Thus CF is accounted for in the reported GW.
[…] US Renewable Energy Output: A Closer Look […]
[…] US Renewable Energy Output: A Closer Look […]
[…] Archive: US Renewable Energy Output — A Closer Look […]
[…] Archive: US Renewable Energy Output — A Closer Look […]