Power Density Separates the Wheat from the Chaff
By Kent Hawkins -- February 20, 2013“Power density (W/m2) is perhaps the most revealing variable in energetics…”[1]- Vaclav Smil
It may be a bit of an exaggeration to say that understanding power density may be all the average person requires to put our energy sources and needs into perspective, but there is some merit in this argument. Unfortunately, this view of energy matters remains little discussed, probably because it appears rather academic.
This post attempts to overcome this by further illustrating the concepts. It will also demonstrate how industrial-scale wind and solar PV electricity generation plants fail to meet this important, high-level standard of performance for electricity sources required by mankind, particularly in developed societies, but increasingly in developing and even undeveloped societies.
This is even without taking into account:
(1) The persistent erratic (short term – minutes) and unreliable (medium to long term – hours to days) nature of electricity production that wind and solar PV provide; (2) their high costs; and (3) many other considerations described here.
This is not to diminish the importance of these other matters, but the contemplation of them all together is fairly elaborate and perspective is easily lost.
In summary, power density is the “gold standard” as a high-level pass/fail measure of an energy source’s value to humanity.
Power Density
Vaclav Smil introduced power density concepts to MasterResource readers in this series. As defined in his comprehensive book on the subject, Energy in Nature and Society[2], power density is watts per square meter (W/m2). It has two components:
- The earth’s surface area required to deliver our energy flow needs[3]
- The power aspect, which is the measure of the ability of an energy source to provide the needed energy rate of flow, or flux (e.g., W = Wh/h, or joules per unit of time). Simply put, this is the rate at which the energy source allows access.
Power density also serves as a characteristic of the user environment.
To some, this concept may seem irrelevant, possibly interesting only to academics. They might say: Why can’t we just deal in watts and watt-hours? The answer is that these alone are incomplete considerations and misleading in assessing the value of energy sources for human well-being and advancement.
To others, power density might appear to be too reductive or simplified a consideration. After all, is there not a large energy potential in wind and solar resources, and is this fact alone not enough to justify harvesting it? The answer is the amount of energy available is only one factor. The other, arguably more important, is the inherent capability of the energy source to provide the needed flow of energy, that is its power component, in relation to the earth’s surface required to harvest it.
To help clarify this, Figure 1 provides an introduction to the concepts and their relevance. This representation and the following charts are derived from information in Vaclav Smil’s book referenced above.
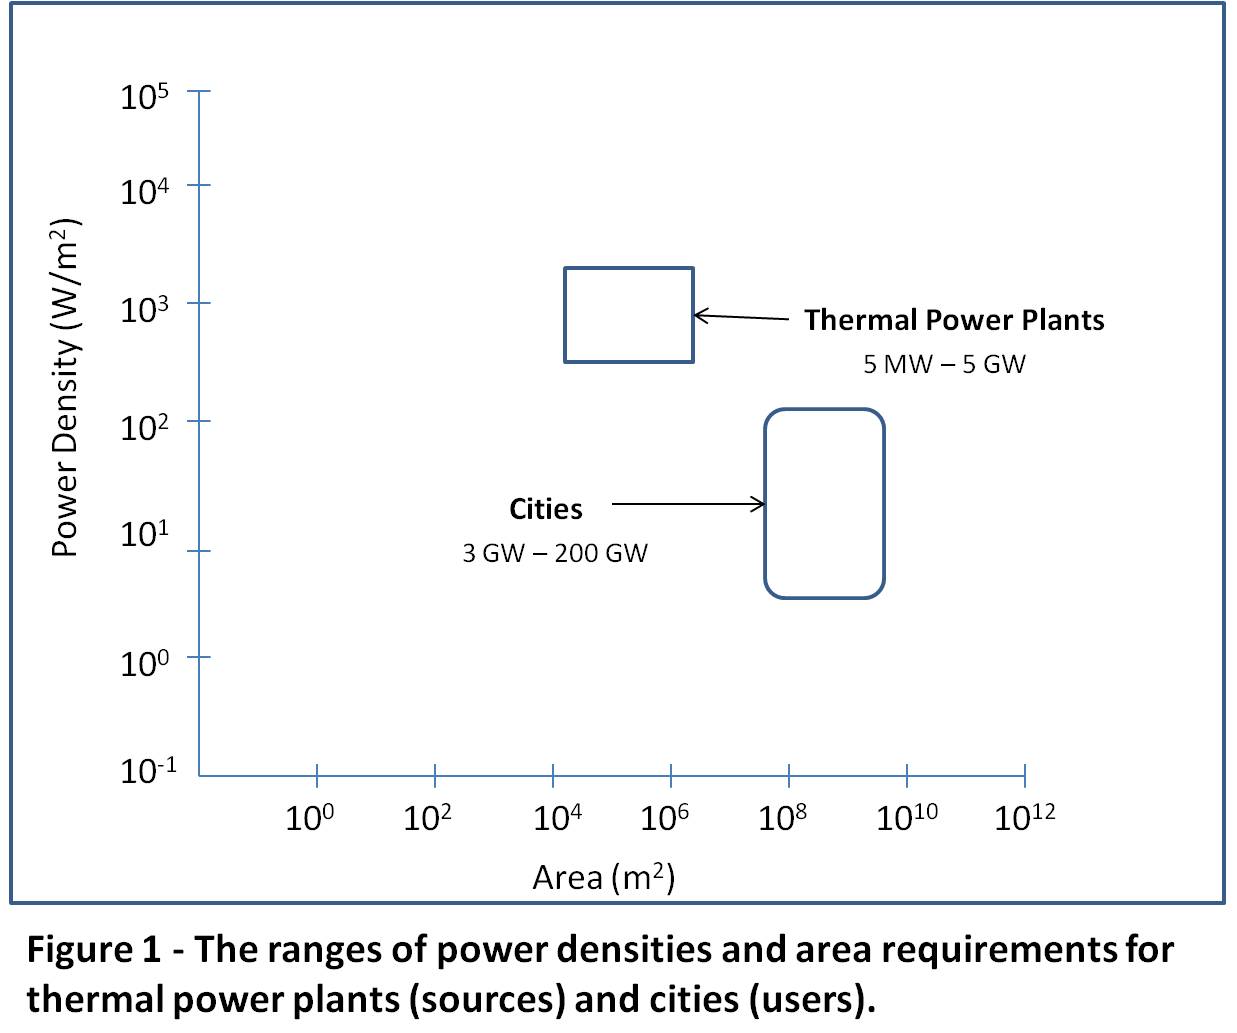
Figure 1 displays the ranges of power density versus land area required for individual instances of power sources and uses. The areas represented by the two boxes for thermal power plants (a set of sources), and cities (an example of the user community), approximately bound the ranges of instances of each. Heavy industry sites and high rise power densities can extend up to ten times the maximum value for that of aggregated cities, extending into the range for thermal power plants.
The process of determining the values is subject to a number of considerations affecting the size and positioning of the boxes shown, which are Smil’s, as represented and qualified by him. For example, for power plants the impact of the full fuel cycle is not included and will be discussed further below. Regardless of any discussion about the details, the values shown are useful for comparison and indicative purposes.
In the case of thermal power plants, the range in power density is from the hundreds of W/m2 to low thousands of W/m2. The range of ground surface required for a thermal power plant is in the order of 104 to 106 square meters. A simple calculation will show the approximate range of energy flux, or power. The energy in this case is electrical.
Low end = 500 (W/m2) x 104 (m2) = 5×10⁶ (W) or 5 MW
High end = 5,000 (W/m2) x 106 (m2) = 5×10⁹ (W), or 5,000 MW (5 GW)
For cities, the range in power density is from a few W/m2 to low hundreds of W/m2. The range of land surface covered is just less than 108 to over 109 square meters. This represents city sizes from roughly a hundred to a few thousand square km. In this case we are showing total energy needs, not just electricity.
Nuclear power plants, for the fenced plant site, can rate up to 4 kW/m2, or in general, similar to thermal plants.
I take the power densities and energy flows (or power) shown for sources to be on the basis of the installed capacity, ignoring the fact that some may not operate at this level on a full-time basis. A good illustration of this would be plants used in a reserve role. In the case of uses, cities for example, I take these to be averages over time and not representing peak values.[4] High power densities for energy sources relative to uses are necessary to meet growth, plant replacement, peak demands and reserve requirements without significantly expanding the land area requirements.
So, why is this so important?
Electricity’s Future
Given the projected growth in the world’s population and the needs of developing and undeveloped nations, we have to ensure we have the energy resources this entails, and in particular, be careful about how we evolve our electricity infrastructures and technologies to avoid self-inflicted setbacks. Otherwise, we could seriously restrict the needed advancement in human well-being. As societies progress, they become more complex and significantly increasing amounts of energy are required to sustain this complexity. From Thomas Homer-Dixon, director of the Waterloo Institute for Complexity and Innovation, in his paper “Complexity Science and Public Policy“.
“A modern society can’t sustain its complexity with low-quality energy; it needs copious quantities of high-quality energy.” (emphasis added)
In summary, we have to be prepared to meet vastly growing needs in these areas:
- Food –This obviously requires significant amounts of the earth’s surface area and fresh water. Competitors for land surface area are threats to this. Remember also, energy is a critical factor in food production, storage and transportation.[5]
- Water – Future water supply will likely be very dependent upon electricity, for example for desalination and for massive transportation (e.g., pumping), both to end users and areas that need irrigation and re-fertilization.
- Transportation – The electrification of transport could be an important factor.
- Shelter – This includes heating and cooling. Heating is another area that could be electrified to a greater degree.
- Improved, widely available technologies – In all areas of human activity including health care, medicine, education, and economic, industrial and financial systems, all of which are highly energy dependent.
- Education – Education is an important factor in the sustainability of our species. Think of the impact on this from all the above and vice versa.
- Security – This includes all aspects, which also are better ensured by meeting the above needs.
- Better government – I suggest better government is a likely outcome of the above. I don’t think it’s the other way around.
To meet these needs, very large energy use, especially electrical, will be required. I suggest that if we were to have a glimpse of the world 50 or more years hence we would be surprised as to the nature of our energy infrastructures. If we are guided by the principles of power density in our energy policies today, we are best ensuring the future we all want.
The following is a critical look at renewable energy sources in this context.
Hydro
Figure 2 introduces the power density considerations for today’s hydro electricity generation plants, compared to that for the energy uses, in this case cities. Hydro, a renewable, provides important lessons that are applicable to wind and solar.
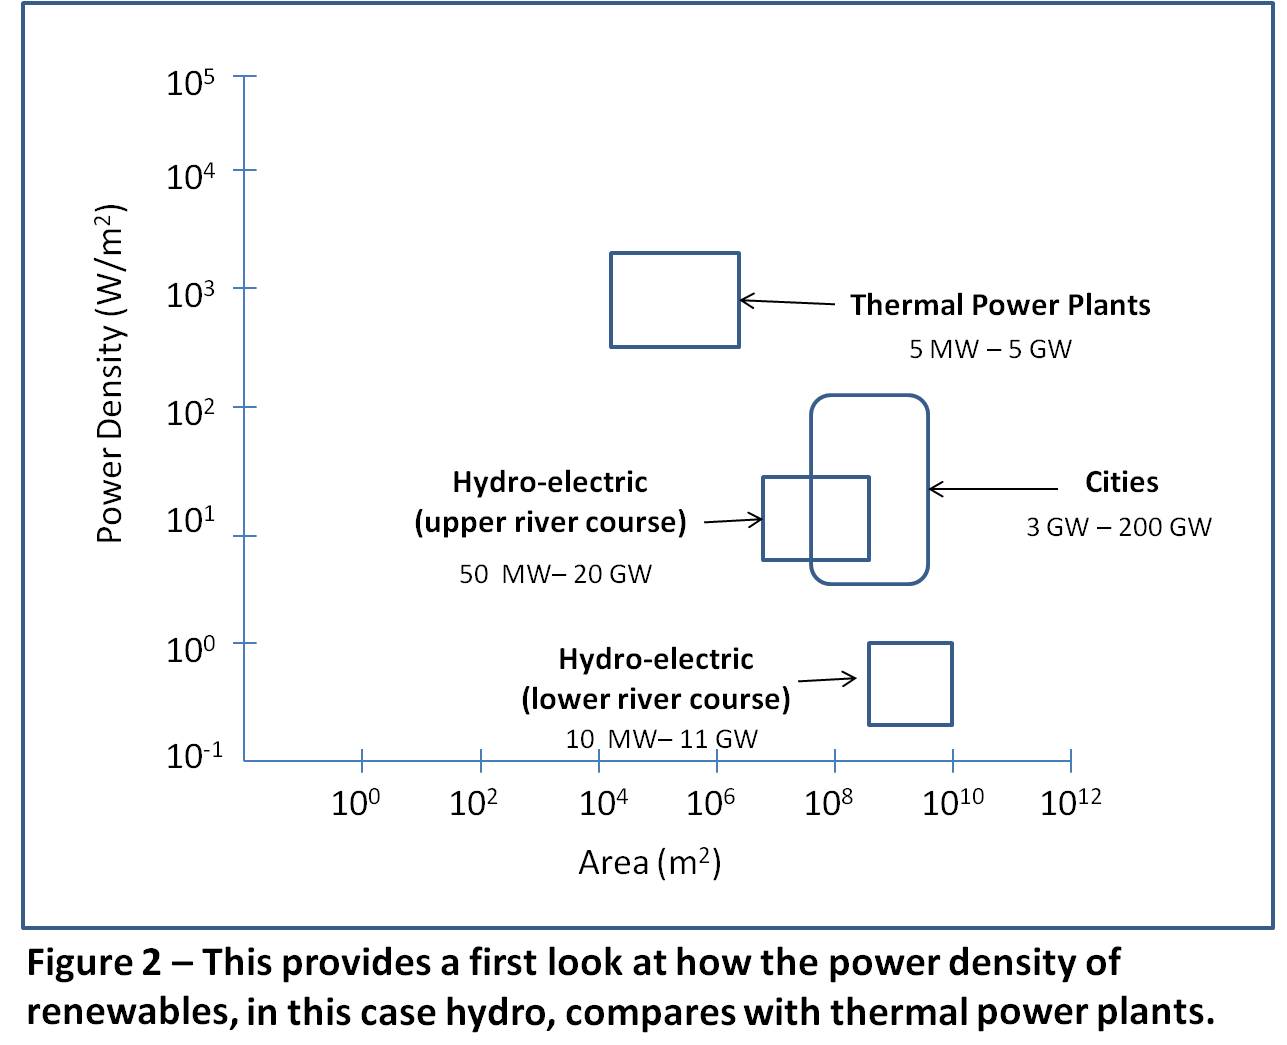
20 GW is shown for hydro, which roughly provides for the Three Gorges Dam in China at 22.5 GW, assuming a high capacity factor. The next largest is the Itaipu Dam in Brazil/Paraguay at 14 GW. All the rest are less than 10 GW. Typical sizes are about the same as the thermal plants.[6]
On an equal power or energy flux basis, this shows that the land area requirements for upper river course hydro-electric plants are about 100 times that for thermal plants, and low power densities for hydro are the reason. The land requirements for lower river course hydro plants are more than 1,000 times greater. Consequently, the land area requirements for hydro do not scale well to handle the volume, peak, reserve, and plant retirement needs.
To illustrate this, in Figure 3 note the extensive land area use requirements for hydro reservoirs compared to all the other components of the world’s electricity systems.
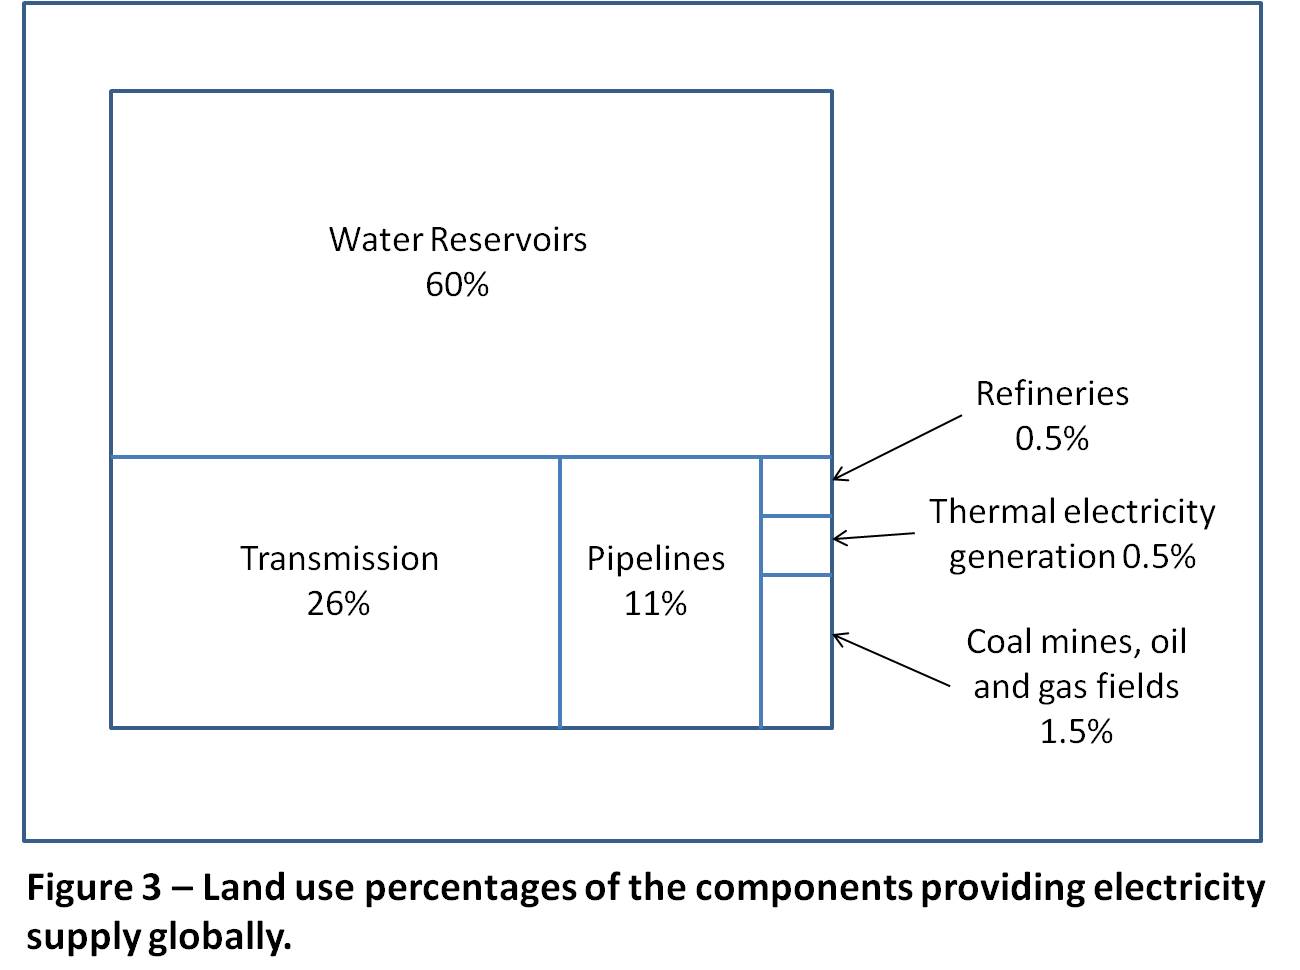
Hydro-generated electricity provides about 16% of global electricity supply,[7] but its land use is 60% of the total.
Hydro has a place today because it is an easily accessible energy source, which also lends itself to storing its energy so that we can use it, generally speaking, as required. It should not come as a surprise that 38 of the top 41 countries that rely on hydro-generated electricity, on a percentage of the total basis, are in Africa, Central and Southeast Asia, and Latin and South America. There are only three developed countries – Norway, New Zealand and Austria, largely due to their topography. In absolute terms, China is by far the leader, at more than double the next largest, the U.S.
Wind and Solar
Figure 4 shows how wind and solar compare. The boxes indicating the ranges of the instances of their generation plants are shown with dashed borders to remind us of the persistently erratic and unreliable behaviour of their electricity supply.
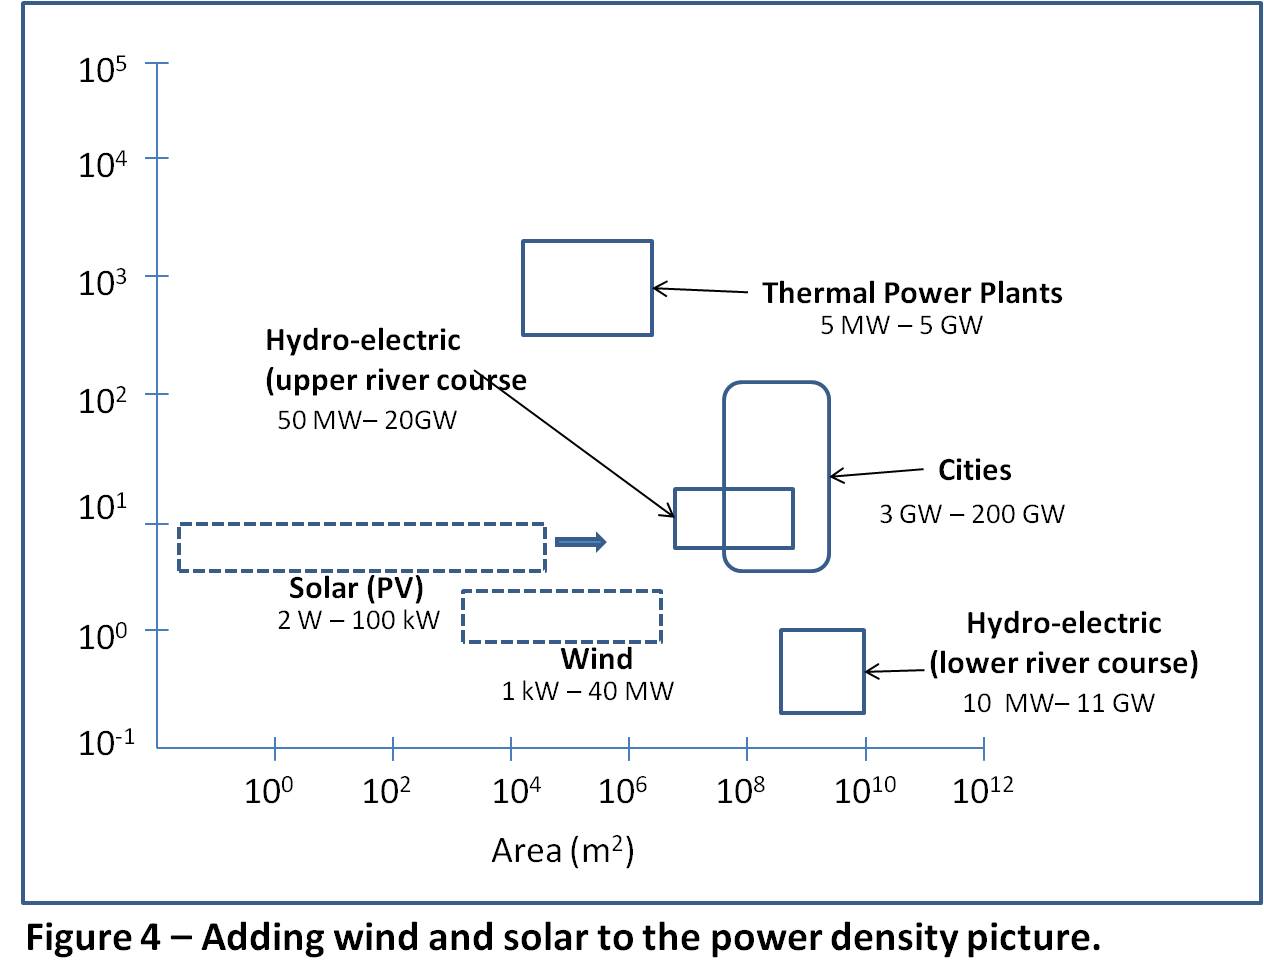
Note the capacities for wind and solar PV do not represent installed capacities, but energy flow levels, expressed in watts based on the low capacity factors dictated by nature itself. The arrow in the solar PV case is intended to show a higher range for solar than Smil does in his diagrams. Larger solar plants exist, including concentrating plants with installed capacities in the hundreds of MW, suggesting an upper range similar to that of wind.
This portrayal provides an appreciation of the realities of employing wind and solar in industrial- or grid-scale applications. Because of low power densities, large land areas are required, and use should be limited to small scale installations in a distributed generation role as this concept is meant to embody. Distributed generation involves the use of the electricity where it is produced primarily for local consumption involving low power density users, and not for feeding the grid to serve distant, high power density users.
Assuming an equal distribution between upper and lower river course hydro plants, solar PV is about the average of the two. So, on an equal energy flux basis, solar PV would require about the same land area as this combination of hydro. If the distribution of upper and lower course hydro is skewed towards the upper course type, and examination of Figure 3 suggests this, then more land would be required for solar PV. As the power density for wind is about one-fifth that of solar PV, the land requirements for wind are about 5 times that of solar PV on basis of equal energy flux, or power.
Because wind and solar PV have low capacity factors, between 15-30%, versus about 50% for a large hydro portfolio, the actual capacities required to deliver the energy flows shown would be at least 2-3 times the hydro capacity.
Remember also that, compared to wind or solar PV, much of hydro capacity is more reliable and not erratic.
Multiple Use of Land
Multiple use of land areas is another factor. For example, hydro reservoirs are also available for recreational purposes. Wind plants are believed to provide extensive other use opportunities of the land area required for them. This does not withstand close scrutiny. Some cultivation might be possible, but little else including human habitation and animal presence, both domesticated and wild. The extensive requirements for unique-to-wind grid additions, especially to collect the dispersed energy source and provide new long distance transmission facilities, access roads for construction and maintenance on the very large wind turbine structures and the negative impacts on rural communities and industrialization of large areas of our natural environments considerations should offset any possible multiple use considerations. Note the large footprint of transmission requirements in Figure 3.
I expect someone will argue that offshore wind avoids the land use problem. There is some current resurgence of the promotion of this by wind turbine manufacturers and their host countries in Europe, which should be seen as an attempt to respond to Chinese competition for international markets in onshore wind turbines. It is extremely unlikely (and arguably impossible) that offshore wind will prevail in our energy portfolios because of power density, energy intensity, costs, short wind turbine life, maintenance and repair limitations as well as ecological concerns.
Additional Power Density Considerations
As can be seen in Figure 3, taking into account the impact of the full fuel cycle would reduce the average power density of thermal plants by a factor of about 5 bringing this down to around twice that for the maximum, and ten times the average of cities. Similar considerations apply to nuclear plants. Taking pipeline land usage into account for gas plants reduces the average power density to almost two times that of the average for cities.
In the case of gas plants and pipelines, the average power density is still three times that of upper course hydro, six times that of solar PV and ten times wind.
It must be remembered that power densities for cities includes all energy needs, not just electrical. However, for future considerations, electricity should be a considerably larger share of this. One conclusion that can be drawn is that fourth generation nuclear (see here and here) and small modular reactor (SMR) plants look promising in the medium to longer term of the period 10-40 years from now. Also, we should not forget the possibility of surprises.
Conclusion
I know it’s all more complicated than represented here, but remember my opening remarks. I said that it may be a bit of an exaggeration to say that understanding power density may be all the average person needs to put our energy sources and needs into perspective, but there is some merit in this argument. I hope the considerations presented here help in bringing more common sense, in all interpretations of this term, to the energy policy discussions.
Winston Churchill said that the inherent vice of capitalism is the unequal distribution of wealth, and the inherent virtue of socialism is the equal sharing of misery. Similarly, current imperatives to impose renewables, especially wind and solar PV, on us through major central planning initiatives, will most likely produce the outcome of reduced energy availability relative to growing needs, resulting in an equal sharing of misery, not prosperity.
In summary, we need extensive amounts of high power density energy resources, especially in electricity systems, to best ensure the continued improvement in human well-being. There is very little room for low power density sources, except possibly in distributed processing environments, which are inherently small-scale.
————————————————–
[1] In general, energetics is concerned with seeking principles that accurately describe the useful and non-useful tendencies of energy flows and storages under transformation. (http://en.wikipedia.org/wiki/Energetics) In other words it describes how we access and use energy.
[2] Smil, Vaclav (2008). Energy in Nature and Society – General Energetics of Complex Systems. The MIT Press. Pages 18-19.
Energy density is also important, but less so. It is measured by volume, in J/m3 (not area), or weight, J/kg. So it is decisive for portable applications or where space and weight are at a premium. Energy concentration (J/m2) reveals the spatial density of resources, a critical measure of extraction or harnessing methods and costs and associated infrastructure needs.
[3] There is another definition, which is the energy flow through the working surface of the energy converter, such as the area swept by a wind turbine, which is more limited in application.
[4] This may be more complicated than portrayed here for the sake of some simplicity. An important distinction must be made between reliable electricity plants, such as fossil fuel and nuclear, versus wind and solar PV plants. The latter are limited at any time by the natural occurrence of the fuel, wind and sunshine, over which the electricity system operator has no control. So in their case, power density, power and energy flux considerations, I take to be based on production over time, which is considerably less than installed capacity. This still ignores the unreliable and erratic nature of such production.
[5] Food is the energy source for our bodies, which we use to maintain body functions, act and think. Thinking takes a remarkable amount of the body’s net energy output. In Voltaire’s words, “Thought depends absolutely on the stomach, but in spite of that, those who have the best stomachs are not the best thinkers.”
[6] A useful list of the world’s power stations is available at http://en.wikipedia.org/wiki/List_of_largest_power_stations_in_the_world
[7] For 2008 http://en.wikipedia.org/wiki/Electricity_generation#Production_by_country
[…] Density Separates the Wheat from the Chaff20 Feb 2013JonBy KHawkins “Power density (W/m2) is perhaps the most revealing variable in energetics…”[1]- […]
Kudos to Kent Hawkins for bringing home the importance of power density to modernity. As I once wrote for this forum:
“All systems of future power production will insist upon machines that are highly reliable and nimbly controllable in ways that permit them to interact with other highly reliable, controllable machines, providing power densities that allow integrated congruence in time and space. This will be as true for electricity production as it will be for medical technology, transportation, and not least, networked computing. In this, wind machines, as they are today, as they were two centuries ago, represent retrograde technology. There is only a difference in degree, and not kind, when comparing today’s 450-foot tall windscrapers with those pastoral Dutch windmills of yore. And economists who attempt to compare wind’s cost and price with conventional generation don’t seem to have a clue about factoring relative value into their calculations.”
I especially enjoyed reading the footnotes here, as well as the quotes from Churchill and Voltaire.
The problem with this argument of power density is that it doesn’t tell you anything about cost. So, it doesn’t actually tell you anything of interest.
Nuclear fusion might end up being the highest energy density power plant, but it might be expensive as hell.
But let’s try to follow through with the logic…what is the “moral imperative” in your line of thinking? To always build a power plant with the highest power density? Does this mean that I should build a natural gas simple cycle power plant rather than a natural gas combined cycle power plant because it has a higher power density? Your line of thinking can quickly lead to lost financial return on investment.
I think that it’s important to focus on the actual “moral imperative,” which is to invest in the project that yields the highest rate of return on investment after accounting for externalities.
One thing that is missing from this excellent critique is the issue of dispatchability, which is totally absent from direct solar, wind, waves, or even tidal. If enough water and snow is available, hydro is dispatchable. But a couple of light snowfall winters in the the Pacific Northwest led to a scandalous rise in the price of electricity.
Eddie
You obviously did not read carefully. Costs (along with all the other considerations) were addressed in paragraph 3 and the associated link. As I pointed out in the following paragraph, which said, ‘This is not to diminish the importance of these other matters, but the contemplation of them all together is fairly elaborate and perspective is easily lost.’
I think it a bit premature (to say the least) to introduce nuclear fusion into the discussion, along with any supposed characteristics. We are better served dealing with the ‘knowns’ today, and for the foreseeable future, which is the critical period being dealt with.
My point is not to distinguish between specific plant types, but the characteristics of the types of plants for the energy sources shown, as represented by the areas contained in the boxes shown in the figures. Different plant types have different characteristics and must be used in each jurisdiction according to needs and available energy sources, as indicated in the hydro example. At this level, the post demonstrates the inadequacy of renewables (especially wind and solar PV) to meet the needs of developed, developing and undeveloped countries, the latter needing to improve their condition considerably.
When it comes to ‘moral imperatives’, I maintain those that I have outlined in ‘Electricity’s Future’ are more important than just rate of return on investment considerations.
You clearly need a better understanding of fundamental energy matters. For starters, I suggest you study Smil’s book referenced in the post.
Below is a preliminary issue of a future article:
Energy densities of various energy sources:
Soy biodiesel @ 70 gal/acre/yr, 0.069 W/m2
Corn ethanol @ 500 gal/acre/yr, 0.315 W/m2
Large US wind plant, 1.1 W/m2
Large PV Solar plant, 6.0 W/m2
Oil stripper well @ 10 bpd, 90 W/m2
Eagle Ford gas well @ 8.5 Mcfd = 1,500 bpd, 293 W/m2
Almost all biomass have values less than 0.5 W/m2, according to David McKay’s book “Sustainable Energy; without the hot air”, page 43, on the internet.
Metric ton = 1,000 kg/tonne; 1 joule/sec = 1 watt; 1 yr = 365 x 24 x 3,600 = 31,536,000 seconds; 1 acre = 4047 m2; 1 ha = 10,000 m2
Biomass Methane Yield from Grass Silage
1) Sample Calculation of UK Grass Silage Energy Density, W/m2
Grass silage biogas yield, 160-200 m3/tonne
Biogas per acre/yr, 10 tons (6 tonnes CH4 + 4 tonnes CO2)
Biogas, 20 MJ/m3
Biogas mass, 1.1 kg/m3
Biogas molecular weight, 0.6 x 16, CH4 + 0.4 x 44, CO2 = 27.2 kg/kmol
Grass silage energy density {180 m3/tonne x 10 tonne/acre x kmol/22.4 m3 x 27.2 kg/kmol x 20 MJ/kg}/{31,536,000 s/yr x 4,047 m2/acre} = 0.342 W/m2
http://www.biogas-info.co.uk/
http://www.biogas-info.co.uk/index.php/biogas-yields
2) Sample Calculation of Irish Grass Silage Energy Density, W/m2
An Irish sample plant with 150 ha produces about 909,030 m3 of biogas/yr, which at 55% CH4, is about 500,350 m3 of CH4/year, or 3,336 m3/ha/yr, which with CH4 at 38 MJ/m3, is 126,755 MJ/ha/yr, which is 12.68 MJ/m2/yr, which is 0.402 (J/sec)/m2, or 0.402 W/m2. The biogas contains about 43% CO2, plus a few percent of other gases, which usually are vented to the atmosphere.
http://www.iea-biogas.net/_download/publications/workshop/8/5-Energy_crops.pdf
http://www.iea-biogas.net/_download/publi-task37/publi-member/ireland_10_costgrassbiomethane.pdf
http://www.iea-biogas.net/_download/publications/workshop/12/6_Grass%20digestion_operation%20and%20optimisation_Murphy.pdf
3) Biomass Methane From Grass Silage in Vermont
Electrical Energy Production
Neglecting cropping and transport-to-digester energy (equivalent to about 10% of biomass energy gained; this energy emits CO2), plus digester plant self-use energy (equivalent to about 12% of biomass energy gained; this energy emits CO2), Vermont would need to crop an ADDITIONAL 100,000 acres (1/4.047 x 100,000 = 24,710 ha) of grass area to obtain a biomass capacity of 0.402 W/m2 (Irish value) x 10,000 m2/ha x 24,710 ha = 99 MW (thermal), which yields an annual energy production of 99 MW x 8,760 hr/yr = 870,023 MWh/yr (thermal), less if not neglecting cropping, transport, and digester plant self-use energy. The ratio of biomass energy gained to energy expended is about 4.
Vermont’s current hay crop area is about 270,000 acres, yielding about 533 tons of hay/yr; i.e, biomass methane from grass silage on a large scale is not feasible in Vermont.
http://norml.org/legal/item/vermont-top-10-cash-crops
If this thermal energy is used as fuel for 30% efficient diesel-generator plants near the digester plants, the electrical energy production would be 870,023 x 0.30 = 261,007 MWh/yr, about 261,007/5,600,000 x 100% = 4.7% of Vermont’s present annual consumption, less if not neglecting cropping, transport, and digester plant self-use energy.
Capital Cost
The capital cost of bringing 100,000 acres (if available) into grass crop production, building a number of large digester plants, building a number of diesel-generator plants, would be about one billion dollars. The unsubsidized levelized (Owning + O&M) cost of the energy produced would be at least 3-4 times NE grid prices.
Below are additional biomass methane URLs for reference.
http://www.ucc.ie/en/eri/ericonferences/Integratedprocessforgrassbiomethane.pdf
http://www.biogas.org.nz/Publications/Resources/biogas-from-energy-crop-digestion.pdf
http://www.itrn.ie/uploads/SesA_ID88.pdf
Much Less Costly Alternatives:
1) Natural Gas
Use abundant, domestic, low-CO2-emitting, no-particulate-emitting, low-cost (3.5-4.0 $/million Btu) natural gas as fuel for 60% efficient CCGTs (less than half the CO2 of coal/kWh), at about $1,500/kW, for the next 5-10 decades.
They could be located near Vermont Yankee and use the same, or augmented, transmission systems, and take over the role of Vermont Yankee in 2032, the year its NRC license expires, or sooner.
2) Hydro-Quebec:
Buy additional renewable hydro energy (CO2-free) from Hydro-Quebec, under long-term contacts at about 6 c/kWh, tied to NE grid prices, for at least the next 10 decades. The environmental damage to build the HQ hydro plants has already occurred. Vermont’s utilities already are buying energy from HQ under long-term contracts.
NOTE: It would be irrational to waste scarce capital and other resources, and to do additional environmental damage to build 459-ft tall, wind turbine plants on sensitive, pristine ridge lines, a la Lowell Mountain, that have high capital costs (compared to east of Chicago), high operation and maintenance costs (compared to east of Chicago), low capacity factors (about 0.25 vs 0.38-0.40 east of Chicago), to produce property-value-lowering; quality-of-life-lowering; health-damaging; variable, intermittent wind energy, i.e., grid-destabilizing junk energy, at about 3-4 times NE grid prices.
This post is more than two years old but I believe that today in 2015, with a growing demand for Distributed Power, power density is definitely worth looking at on top of Cost of electricity and $ profitability.