Case Study on Methods of Industrial-scale Wind Power Analysis (Part II)
By Kent Hawkins -- April 7, 2010Part I of this two-part post reviewed most of the considerations that must be understood in evaluating analyses of wind power.
Part II completes this analysis by focusing on one of the most important considerations in the wind utility debate, wind’s capacity value. To this end, I review a paper by Gross et al, which is relied on by Komanoff, and conveniently provides an opportunity for the review of a second paper.
Wind’s Capacity Value
Komanoff uses a flawed analogy by claiming that a backup quarterback contributes value to a team even if he never plays. First, the concept of “never playing” is arguably a reasonable notion with respect to industrial wind power. Second, the analogy applies more correctly to operating reserves, which are needed to fill in for the other generation means if, and when, needed.
These operating reserves have similar characteristics to that which is being replaced, that is they provide steady reliable power at the call of the system operator (football coach). The appropriate analogy with wind would be to have a basketball player sitting on the football team bench to back up the quarterback. The basketball player has different characteristics and does not add value to the team. If you prefer, substitute a guard or tackle as the quarterback backup, but this does not change the situation. In these cases an additional, and effective, backup quarterback would have to be added to realize the “value” that Komanoff claims. Table 1 further illustrates this point.
Table 1 – Comparison of Characteristics
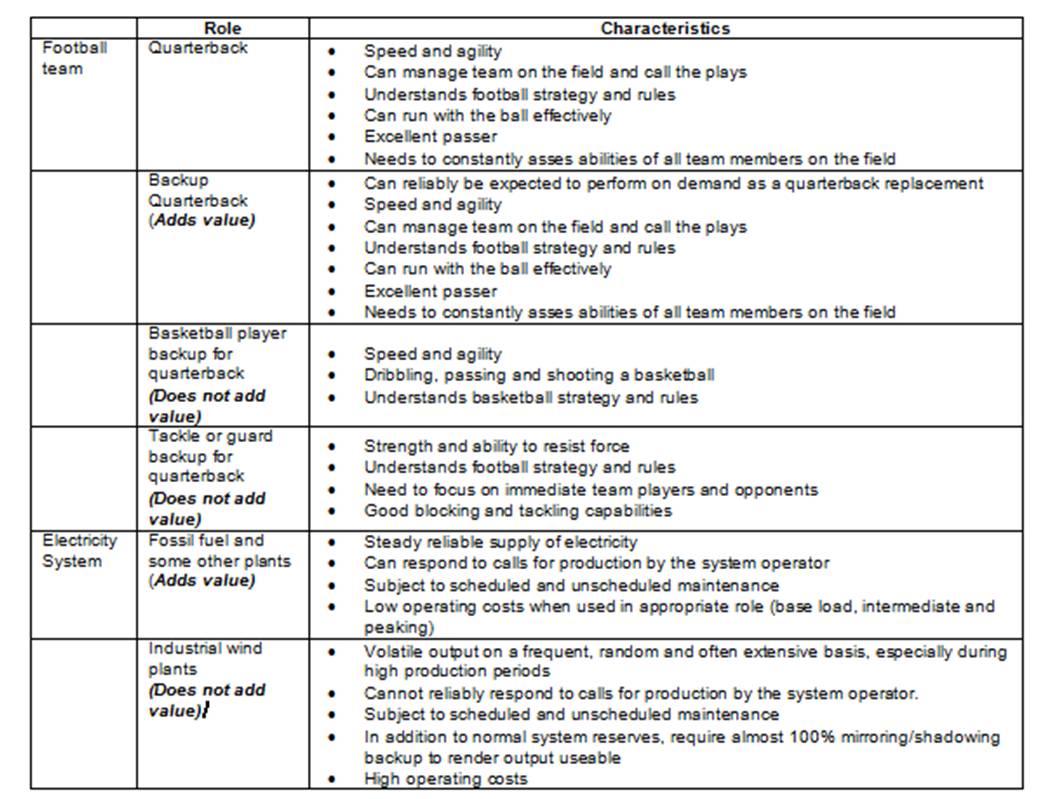
Table 1 illustrates the capacity value aspects of generation plants. Wind has zero capacity value just as the basketball player, guard or tackle adds no value to a football team as a backup quarterback.
Another aspect of the analogy is a backup quarterback who has an extensive, “wild” social life. He might just not show up for some games. Other times, he’d be there but would be hung over. Alternatively he may just exhibit erratic behavior in his play, e.g. kicking on first down, passing on third and one or running out of a good “pocket” with receivers in the clear. The effect could be extremely adverse, for example in a key game. Don’t ask me how he got the position. Perhaps one of his parents is an influential alumnus. His contribution to the team is at best like capacity credit (versus capacity value) in the case of wind plants. Statistically over time he could be considered as making some small contribution, but cannot be relied upon in any specific circumstances. Because of this, an additional team member, a second but reliable backup quarterback, would have to be present to fill in for most of the time a backup quarterback is called on, due to the unreliability of the first “backup quarterback.” The team’s rhythm and cohesion are upset because the reliable backup quarterback must be frequently inserted to rescue the situation. Unfortunately, the use of the first backup quarterback has been mandated, and the coach has no choice but to use him as a first priority. This provides an example of the capacity credit aspects of wind power as defined here.
Komanoff suggests that the capacity value of wind is 20 per cent based on what the PJM grid in Pennsylvania “projects”.[i] This level of wind contribution is more correctly referred to as capacity credit as described above. It is confirmed by two different analyses and reported by the EWEA.[ii] The first is a study performed by ILEX which attributes about this amount to wind and the second a German Energy Agency (dena) analysis which attributes this amount only at low wind penetrations. In the dena study the capacity value of wind falls dramatically as wind penetration increases. At the then current penetration level in Germany, it is about 8 per cent and approaches zero at higher penetrations. A significant difference in these two analyses is that the ILEX report assumes overall electricity system reliability requirements to be 91 per cent, whereas the dena report assumes 99 per cent,[iii] a more reasonable level, considering the importance of electricity to us all.
Komanoff then makes the assertion, citing the PJM system as an example, “Nevertheless, it should be noted that grid operators increasingly are recognizing that wind turbines do have some capacity value.” It is a reasonable statement that all grid operators recognize that wind has some capacity credit, which is useful primarily in capacity planning. The question is: how much? There appears to be no grid operators with significantly greater experience with industrial wind than PJM that have any illusions about the latter point, especially one of the German system operators with extensive wind experience, E.ON Netz.[iv]
Comments on Gross Study
The Gross report contains a great deal of material, and the comments here are definitely not exhaustive. No attempt has been made to look at all the detail, as there appears to be enough to suggest caution even at a higher level of review. In sum, it appears impressive but is very questionable when looked at more closely. In general, although a contribution to the topic, it reinforces the view that one should be cautious in attributing too much to any one report, regardless of the extent of sources cited.
The main focus of the 64 documents that do use some “statistical and/or time series simulation” versus “review” referenced by Gross (out of the total of 212 considered, and the total is sometimes relied upon by wind proponents) is on reliability, reserves and balancing. One of the 64, the E.ON Netz report, which shows very high requirements, is labeled an “outlier” because it deviates substantially from most of the others. This is remarkable as E.ON Netz is one of the most wind-experienced electricity system operators in the world and its report one of the most recent. Table 2 provides a breakdown by date of publication, and other considerations, of all the reports mentioned.
Table 2 – Summary of Reports Referred to by Gross
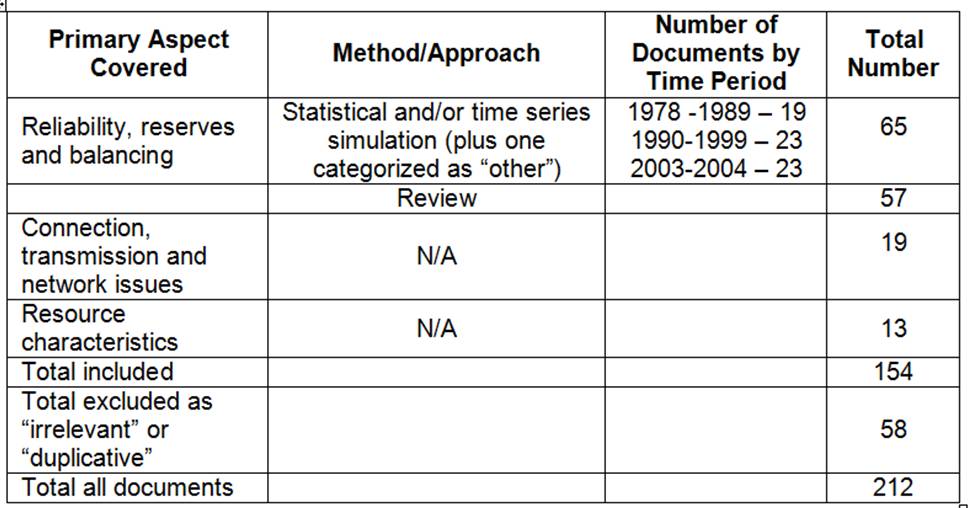
65 per cent of the documents addressing reliability, reserves and balancing were produced before 2000 when wind power was not a significant factor in electricity systems. See Table 3 below for information on installed wind capacities. Further restrictions are:
- With respect to system balancing, only 10 show any metrics of the effect of penetration (the percentage of installed wind measured in MWh), and two of these had to be dropped from Gross’ Figure 3.1 as they did so in a way that could not be represented. Of the remaining 8, three graphed did not specify the penetration level.
- Fifteen, all after the year 2000, were graphed in Gross’ Figure 3.2, showing the cost of reserves. Of the 15, eight were from the UK and three from the US, both having low wind penetration experience and representing a total of over 70 per cent of the reports. They typically showed lower costs. Two were from Denmark, with one showing costs in the higher range. One was from Spain, again showing costs in the higher range.
- Nineteen were graphed showing capacity credit values, for a wide range of penetration values, but 58 per cent pre-dated the turn of the century, increasing to 74 per cent if the period 2000-2002 was included.
Here are selections from general observations by Gross (page 36) with respect to the information studied:
“One striking characteristic of the data is the range of different metrics used to assess the impacts. This means that for each of the categories of impact identified above, the numbers are presented in several different formats. This creates the potential for confusion and the risk that comparisons between results is not on a genuinely like for like basis. Attempts to normalise data from a range of studies to facilitate comparison run the risk of losing important detail or, at worst, suggesting that figures are comparable when they are not.”
“Even where studies have used ostensibly the same metric it is not always possible to compare the results because a study has focused on a particular elementof a metric, or other system dimensions are not declared. Examples include studies which do not identify the extent to which intermittent generation displaces existing plant. Other studies are not explicit regarding total intermittent generation levels, total system capacity, or total system demand, all of which hamper the derivation of the penetration level.”
“These issues do not imply a criticism of the studies reviewed – they are used to illustrate that it is prudent to exercise caution when drawing comparisons between results.”
One comment that can be made is that it appears that most do not provide a complete analysis of the elements to make a comprehensive determination. Gross also explains that wind penetration levels analyzed are not always clear. This is an important consideration as low levels of penetration may have a relatively small impact.
In this regard it is interesting to note that a number of the reports evaluate wind penetration up to 30-40 per cent, whereas many, including the two for Germany, stop at 20 per cent or less. There is no basis to assume wind penetrations at the higher levels are supportable in any jurisdiction, and there is sufficient confirmation based on actual experience in Germany and Denmark, for example, that the limit is well within single digits of wind penetration percentage.
Returning to the question of the impact of wind on system reserves, Gross states that “Different analysts use different definitions of ‘reserves,’ which means that a range of impacts are captured.” However, there is a further consideration beyond reserves. This is the requirement for wind mirroring/shadowing backup on a continuous basis to render wind’s output useful. This is arguably separate and additional. Gross refers to it in note 54 with the comment that “Eon Netz introduce [sic] the term ‘shadow capacity’ which is not used in any other literature and its precise meaning is unclear.” The meaning relates to this additional requirement, and appears to be at variance with the comment on page 21 of the Gross report, which states:
“Intermittent renewable energy plants can save fossil fuel [very questionable], but may also increase the amount that conventional plants must vary their output, operating in response to market signals. This change in utilization of generation is a separate issue from the need to establish additional reserves.” (emphasis added)
I refer again to E.ON Netz’ real, practical experience with wind power compared to most, if not all, the other documents reviewed. E.ON Netz claims that 80 per cent backup for wind is required in its Wind Report 2004, and increases this to 90 per cent in the 2005 edition.
This consideration is shown in capacity credit values and in the amount of total capacity required in an electricity system, over and above that which would be required without the presence of wind, as discussed in Part I. In penetrations above about 1 per cent, this approaches the full wind capacity on a statistical basis over time. On an instantaneous, or even a very short term, basis the range of involvement of shadowing/mirroring wind backup could be any value between 0-100 per cent of installed wind capacity.
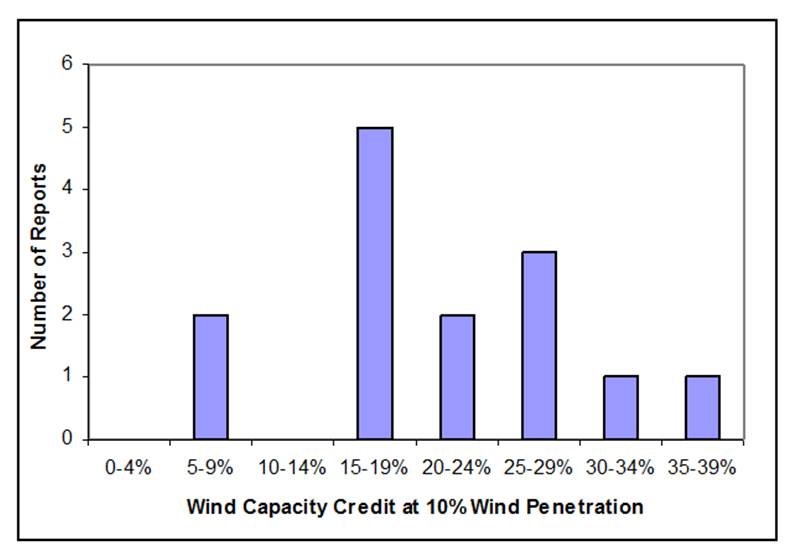
These and other considerations bring into question the display in Gross’ Figure 3.4 (represented here in Figure 1) of a frequency distribution of findings of the Gross report at the 10 per cent wind penetration level. Given Gross’ own questioning of comparing results, it is suggested that such a representation may be misleading.
Figure 1 – Gross’ Figure 3.4
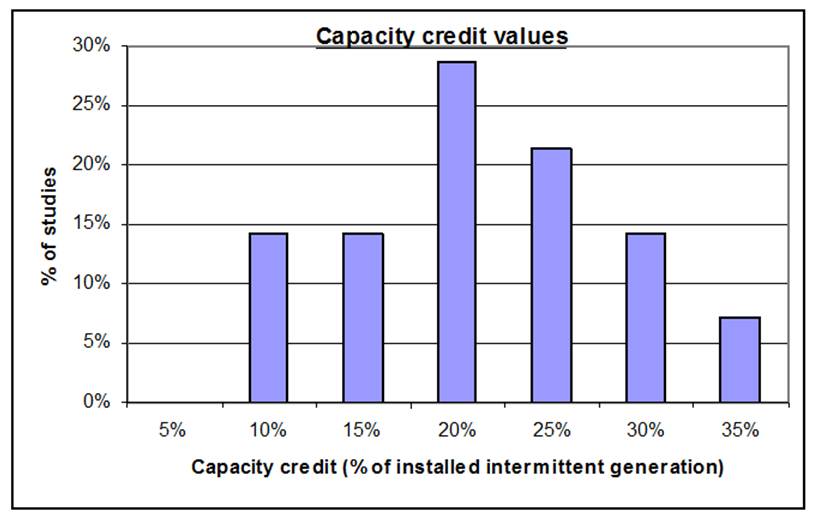
A closer look at this representation is interesting. The first point is that percentages of studies are used for plotting results, and the effect of converting this to number of studies is revealing as shown in Figure 2. The second is that the classification of results as 5, 10, 15…, introduces a distortion. A better representation would be to show these as a range e.g. 0-5, 6-10 etc. Otherwise there is a “rounding up” of results.[v] For example, within the 10 per cent class the specific values are 6 and 8. Figure 2 also shows the results represented this way, maintaining the same upper range of intervals.
Figure 2 – A Better Representation of the Gross Study Results #1
(Actual number of reports)
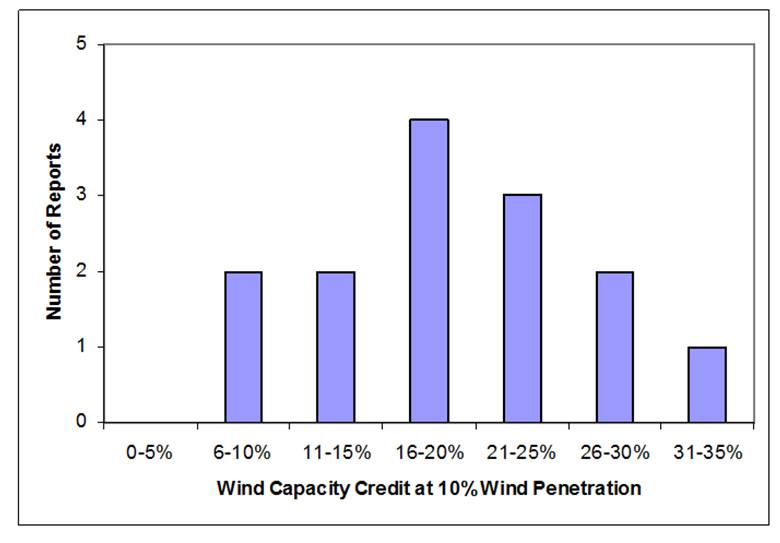
The low number of actual studies in each classification (range of 1 to 4) indicates the low value that can be placed on the results as the removal of one or two could significantly change the convenient distribution shown.
Even this distorts the results as the first interval has 6 class frequencies (0,1,2,3,4,5) and the remainder 5, (6,7,8,9,10 for example). Correcting this to show 5 class frequencies for all intervals changes the upper limit for each as shown in Figure 3.
Figure 3 – A Better Representation of the Gross Study Results #2
(With consistent intervals)
This looks less like a “normal” probability distribution than Figures 1 and 2, and raises the possibility that more than one group of reports with different characteristics may be represented. The following examines this in more detail.
One of the interesting details of the Gross results is the number of reports that predate the turn of the century, when there was relatively little wind power deployed world-wide compared to 2007. Table 3 shows this information
Table 3 – Installed Wind Capacity in Megawatts (MW)
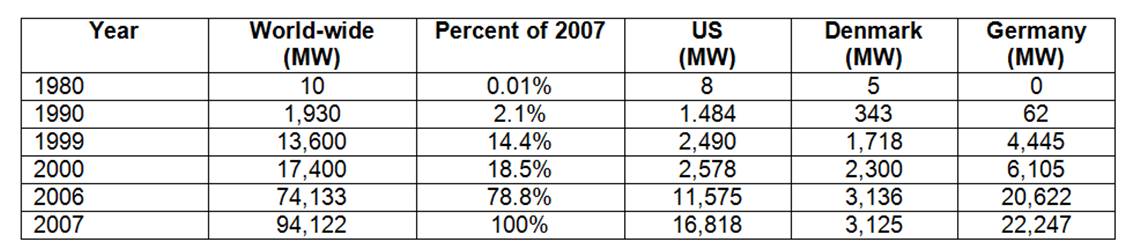
Source: Earth Policy Institute
The earliest dated report in this group is 1983, at which time only just over 200 MW was installed world-wide. As can be seen, more than 80 per cent of the total wind capacity world-wide has been installed since the year 2000, the turn of the century. It seems reasonable to conclude that real experience in wind power before that time would not be as realistic as experience since 2000. Since 2000, Germany has had more experience than any other country, especially with both large wind implementations and high wind penetrations. What would Gross’ Figure 3.4 (Figure 1 here) look like if the studies that pre-dated the turn of the century were eliminated? Figure 4 shows this result.
Figure 4 – Gross Results Eliminating the Studies Dated Before 2000
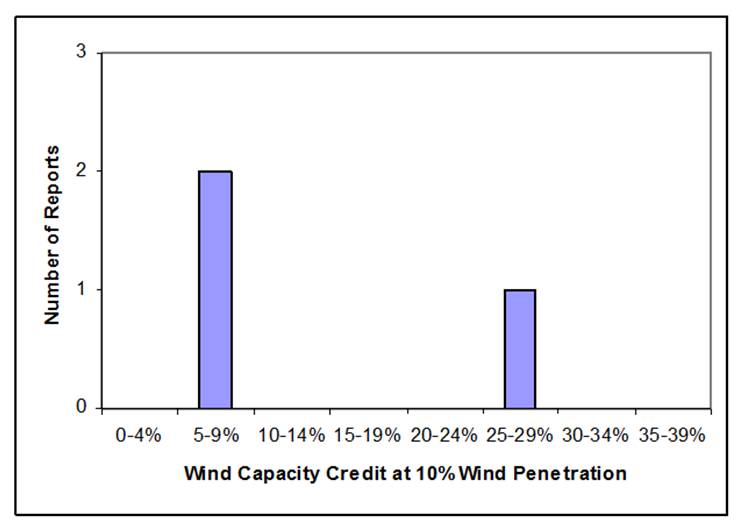
The two studies in the 6-10 per cent class were both German and dated 2005. The one in the 26-30 per cent class is English, dated 2003, and is a literature review based on many of the studies eliminated. It comes closer to being viewed as an “outlier” than the German studies that Gross classifies as such.
The next question is: what do the Gross results look like when the pre-2000 reports are excluded and at 5 per cent wind penetration? As 5 per cent penetration is a realistic maximum that an electricity system can withstand based on real, practical experience, this is perhaps the most meaningful of all. See Figure 5 for this.
Figure 5 – Figure 4 Results at 5% Wind Penetration
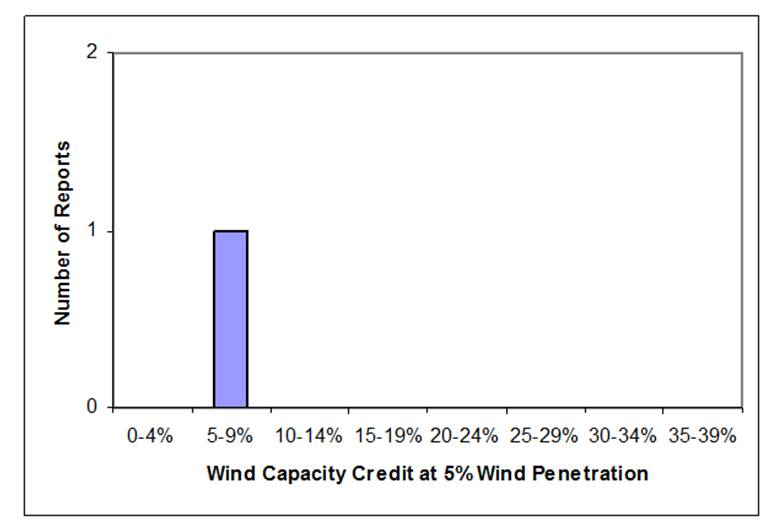
The one report that remains is the E.ON Netz report.
An argument that this is now based on only one report and therefore hardly significant is valid. Within the context of the Gross study, it can be countered with the consideration that one report of a recent nature from the most experienced jurisdiction can arguably outweigh a number of reports from a time when there was little extensive, practical experience world-wide and from jurisdictions with minimal levels of wind.
In any event, the purpose here is not to argue the veracity of the E.ON Netz report by itself, but to illustrate the need to carefully analyze the Gross report, amongst others, on this subject.
[i]I have been informed that PJM has since changed this to 13% based on actual experience and continues to monitor this consideration.
[ii] European Wind Energy Association, Large Scale Integration of Wind Energy in the European Power Supply, 2005, pages 123-124, http://www.ewea.org/fileadmin/ewea_documents/documents/publications/grid/051215_Grid_report.pdf
[iii] European Wind Energy Association
[iv] E.ON Netz, Wind Report 2005, page 9. http://www.eon-netz.com/Ressources/downloads/EON_Netz_Windreport2005_eng.pdf
Thanks for this outstanding analysis. The image of wind as an out of control basketball player serving as backup for the quarterback is a good one. I’ve sometimes used football imagery to characterize the wind mess, imaging a Continental Football League, where one of the teams was wind “powered.” One could never be sure whether the wind team would show up at the scheduled time , or if it did, how many players it would have, or, even if it had enough players and showed up
on time, whether the game they sought to play was football or field hockey.
Wind has no capacity value. So easy to see, just look at the wind generation charts from Ireland.
http://www.eirgrid.com/operations/systemperformancedata/windgeneration/
The maximum generation is about 1150 MW, equal to almost 600 2 MW turbines. That output is achieved for much of the day on 4/5/10. But the previous day, on 4/4, only 40 MW is generated at one point, only 2.5% of the maximum. It is ludicrous to state that these turbines have capacity value of 20% when less than a week ago their output was less than 3% of their maximum rated capacity. Keep clicking the back button and you can see that almost every third day the total output is less than 100 MW or less than 8% of maximum.
To state that these turbines, quite typical, can be counted on to produce 20% of their rated maximum output is either a LIE or an example of COMPLETE STUPIDITY.
Here is Bonneville Power in Oregon where there are even more turbines than in Ireland, with a maximum output of over 2000 MW.
http://www.transmission.bpa.gov/business/operations/Wind/baltwg.aspx
4/4 and 4/7 the output again drops below 5%.
The same results are found for Ontario wind.
http://www.sygration.com/gendata/Generator%20Report%202010-04-07.html
Just a few days ago, the output dropped to below 100 MW or about 10% of maximum.
My elderly mother has electric heat and has difficulty paying her electric bill now? Most citizens have no idea that the goal of the wind lobby is to double our electric bills using this mode of electricity generation that decades ago was found to be inadequate for commercial use. It’s only use is to enrich the wind lobby (a very broad group, not just the developers) by crippling our economy.
Mr Hawkins, thank you. I doubt a more informed, unbiased study and analysis could be accomplished.
I blogged short excerpts with links from both “Case Study on Methods of Industrial-scale Wind Power Analysis” and “Wind Integration: Incremental Emissions from Back-Up Generation Cycling”.
Here: Wind energy increases CO2 emissions – more=more
http://my.telegraph.co.uk/clothcap2/blog/2010/04/09/wind_energy_increases_co2_emissions_-_more=more
I agree with other commenters that this is very well done.
I am looking forward to a real prolonged hazy, hot, humid weather system in the NE US when the forcing high pressure system also means that the wind capacity will fall to the low values you describe. Maybe that will convince more regulators that when you need the peak energy industrial wind falls short.
One can only hope.
[…] Parte I de esta parte-puesto de dos revisado la mayor parte de las consideraciones que se deben entender en la evaluación de los análisis de la energía eólica. Parte II completa este análisis, centrándose en una de las consideraciones más importantes en el debate de utilidad viento, la capacidad eólica de valor. Con este fin, se revisa un documento por Gross et al, que es invocado por Komanoff, y [. . . ] URL del artículo original http://www.masterresource.org/2010/04/case-study-on-methods-of-industrial-scale-wind-powerii/ […]