Peeling Away the Onion of Denmark Wind (Part II – Details of Exports and Imports)
By Kent Hawkins -- October 27, 2010[Editor’s note: Part I explained the unique character of the Denmark electricity situation as background to a more detailed look at Danish exports/imports of electricity and CO2 emissions. This post and Part III will focus on exports/imports to show the larger role that wind is having in exports. Part IV will then address CO2 emissions, providing the conclusion to this series.]
There is a range of views on the amount of Denmark wind-generated electricity that is exported. Any that rely on annual net exports should be very suspect. Table 1 provides a summary of notable analyses, all of which at least use hourly net exports. All must be read for any comprehensive understanding.
Table 1 – Summary of Notable Analyses of the Amount of Wind-Generated Electricity Exported by Denmark.
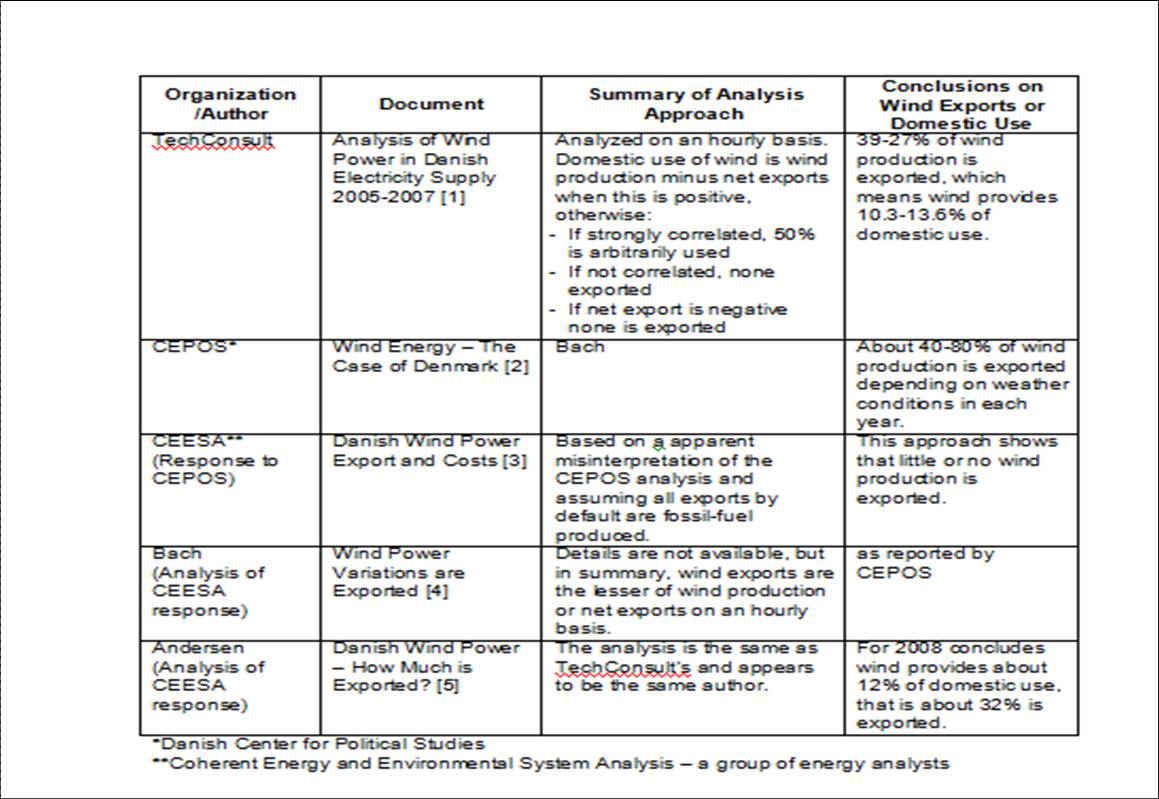
Bach and Andersen firmly dispute the CEESA critique of CEPOS, and both show substantial wind exports. Bach makes an interesting comment in his paper:
“Based on these observations it could be said that Germany and Denmark together have solved the integration problems for about 7% wind energy, but only due to the common access to the regulation capabilities of the other Nordic countries, notably hydro power in Norway.”
The case is strong for substantial exports of Denmark wind production as shown by Bach and Andersen, and supported by others such as Sharman.
With respect to the Bach analysis, which is based on hourly net exports, consider the following cases:
· Net exports exceed wind – The wind production is assumed to be the amount exported. This likely overstates the case for wind exports, especially if looked at on an annual basis, but Bach’s analysis is based on hourly net exports. As Bach is reported by CEPOS as not showing 100% export of wind for any year, the summation of the hourly results used by Bach would seem to be fairly reasonable.
· Wind exceeds net exports – The net exports are assumed to be the amount exported. This likely understates the case.
· Net exports are negative (that is there are net imports) – An annual summation of hourly events would likely offset any tendency to show no wind is exported. In any event, the overall level of wind export is likely still understated.
CEESA appears to misunderstand the basis of Bach’s approach, which it characterizes as follows:
“If one presumes that all export by default is wind power (until the export exceeds the wind power production), we can replicate the same numbers as the CEPOS study, i.e. the 5 percent of electricity consumption in 2006 mentioned above. This implies that CEPOS statement of 5 percent wind power in 2006 must build on an assumption that export, when present, is by default wind power.” (emphasis in original)
Proceeding from this, CEESA’s analysis takes the approach that all export by default is fossil fuel.
Restating Bach’s approach correctly would be:
If one presumes that all wind exported by default is [net] exports (until the [net] export exceeds the wind power production and then it is wind production)… (underlined text are changes or additions)
CEPOS makes its case for wind exports using linear regression of hourly plots of wind production versus net exports over a year, but and this is important, supported by information from the actual time series of the two activities. CEESA bases its counter-argument on a comparison of this to the linear regressions of the plots for fossil fuel plants versus net exports, but ignoring the time series information, which does not support its case that fossil fuel production is equally likely. Neither is conclusive, in part because of the use of linear regression, but the Bach case is stronger.
A quick review of the Andersen approach, as described in Table 1, shows that it can be seen as likely understating the level of wind exported in all cases.
The following is first a look at overall annual exports and imports, shown separately, to illustrate the shortcomings of analysis based on net values. This is followed by a review of the individual exports and imports of Denmark electricity each of its electricity trading partners.
Why Annual Net Exports are not Meaningful
The use of net exports/imports is a common metric in tabulating a jurisdiction’s overall situation for a given year. However, some claims of Denmark performance during a year may be based on annual net imports/exports, but this conceals more than it reveals, because (1) Denmark’s unusually high traffic in each, about three times in percentage terms compared to most countries, and (2) transactions can occur at different times. To illustrate the first point, a look at the total annual exports and imports is shown in Figure 1.

Figure 1 – Electricity exports and imports for Denmark. Source: Danish Energy Association. [6]
Note the effect that high levels of both imports and exports have on net levels, resulting in some years a close balance. Not shown here is that these do not necessarily occur at the same time. The exports remain fairly consistent and growing, coincident with the increase in wind production over this period. Imports appear more erratic, and are largely driven by weather. The peaks in 2003 and 2006 were dry years in the Nordic region, and the implications will be explained later. Imports also show a growth trend with high levels in 2005, 2007 and 2008, wet years, which will also be explained.
Detailed Look at Exports and Imports Separately
The following charts show the actual annual imports and exports by country, starting with the Nordic countries. This annual information does not indicate the full implications of timing which hourly net exports tend to do. The analysis at the annual level does provide a manageable basis to facilitate understanding of many of the dynamics involved, without having to extend the mathematical work already performed by others on hourly net exports. In general:
- In wet years, the Nordic water reservoirs are full and there is less need to import to conserve water. There is a strong flow of Nordic hydro-generated electricity southward.
- In dry years, the Norway/Sweden water reservoirs are not full, and in the interests of conserving water they import electricity, and there is a strong flow of electricity northward.
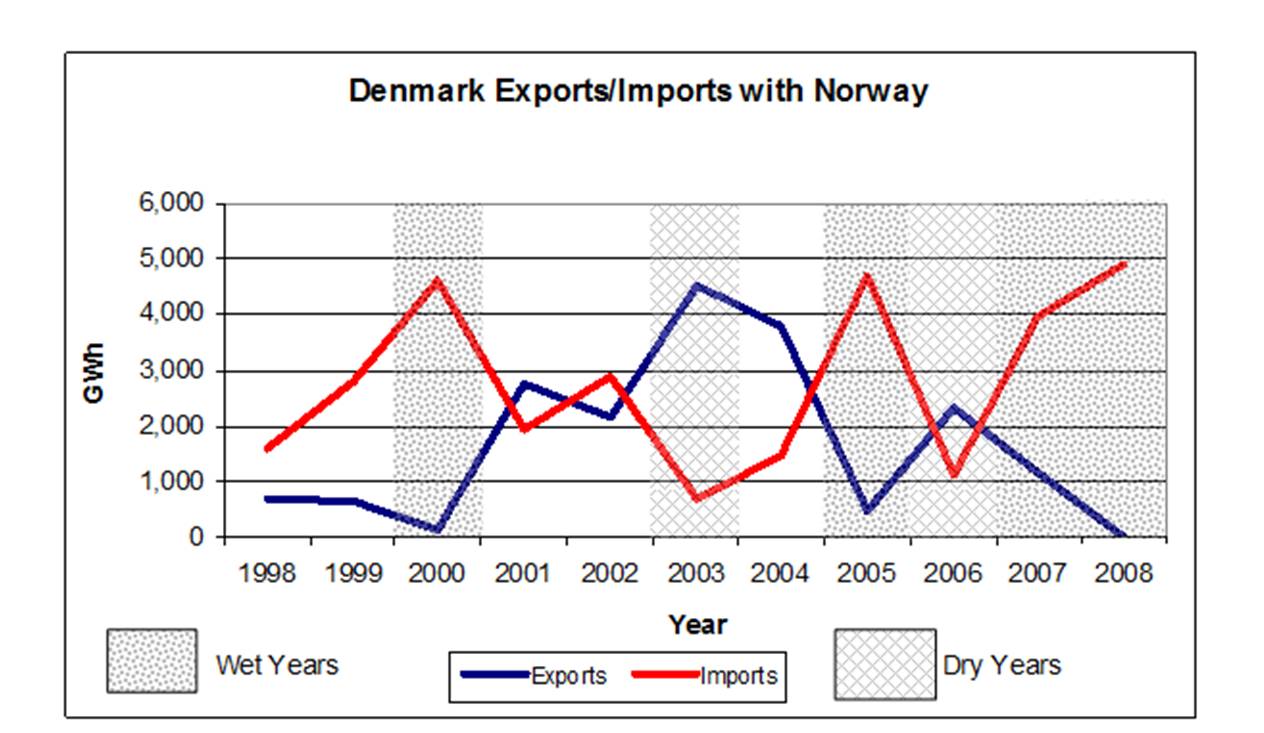
Figure 2 – Denmark’s Electricity exports and imports with Norway
Note that in wet years, when Norway’s water reservoirs are full, exports fall and imports from Norway rise. The reverse is true in dry years. The year 2003 was especially dry. Note that exports in the period 2000-2003 have risen coincident with increases in wind production in Denmark, although exports decline in wet years.
The information for Sweden follows the same pattern as that for Norway, which is to be expected. This supports the approach that the exports/imports for these two countries can be combined.
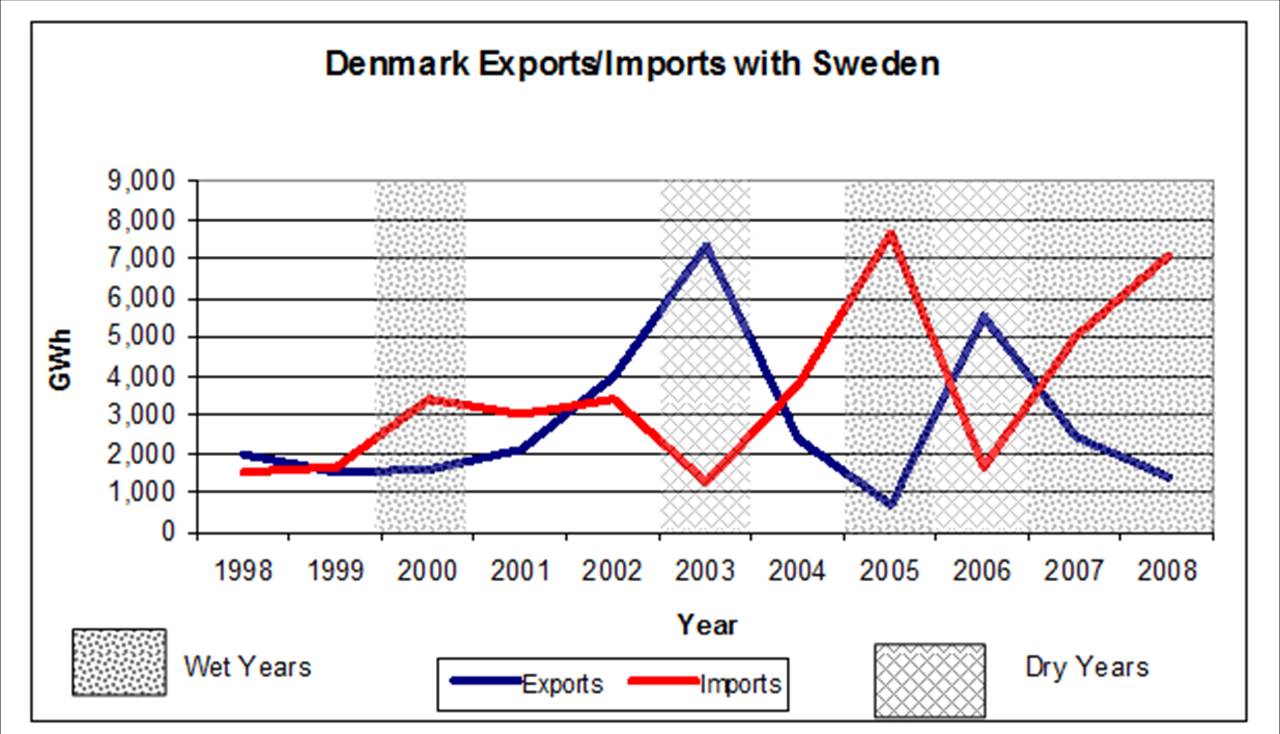
Figure 3 – Denmark’s Electricity exports and imports with Sweden
The patterns for Germany are the opposite of that for Norway and Sweden.
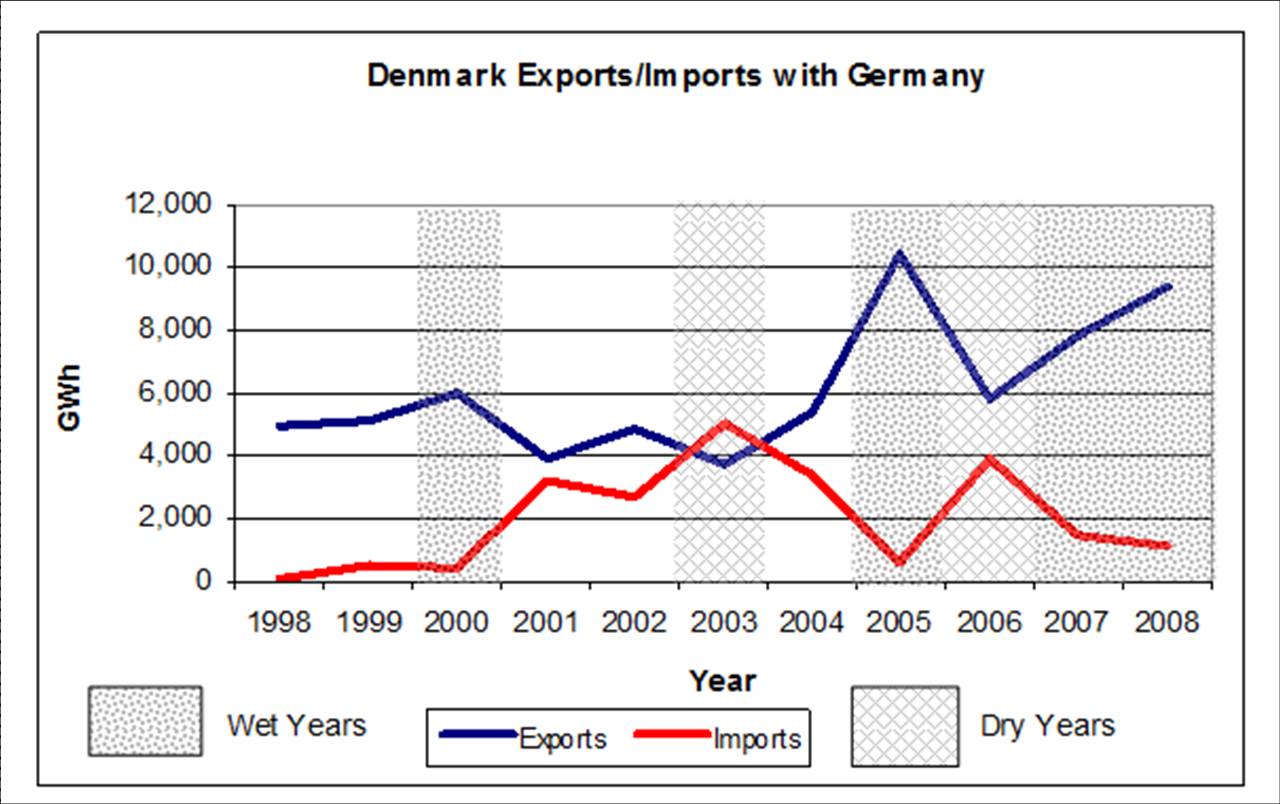
Figure 4 – Denmark’s Electricity exports and imports with Germany
As opposed to Norway/Sweden, Denmark was exporting to Germany at the end of the 1990’s when fossil-fuel electricity production was highest in Denmark, and before significant wind production. These exports were almost certainly fossil-fuel based. It looks like Denmark’s imports from Germany started relatively recently coincident with the increased implementation of Danish wind plants and peak in dry years when exports to Norway/Sweden also peak.
As well, exports to Germany have increased coincident with recent periods of wet years, supporting the view that Germany is now taking some Danish wind production, especially in wet years when exports to Norway/Sweden are low. Also wind exports to Germany may be supported by “firming” with hydro from Norway/Sweden.
Summarized View of Exports/Imports
It is useful to summarize the above, combining the Danish exports to Norway and Sweden and showing them on the same graph as exports to Germany and Danish wind production. This is shown in Figure 5.
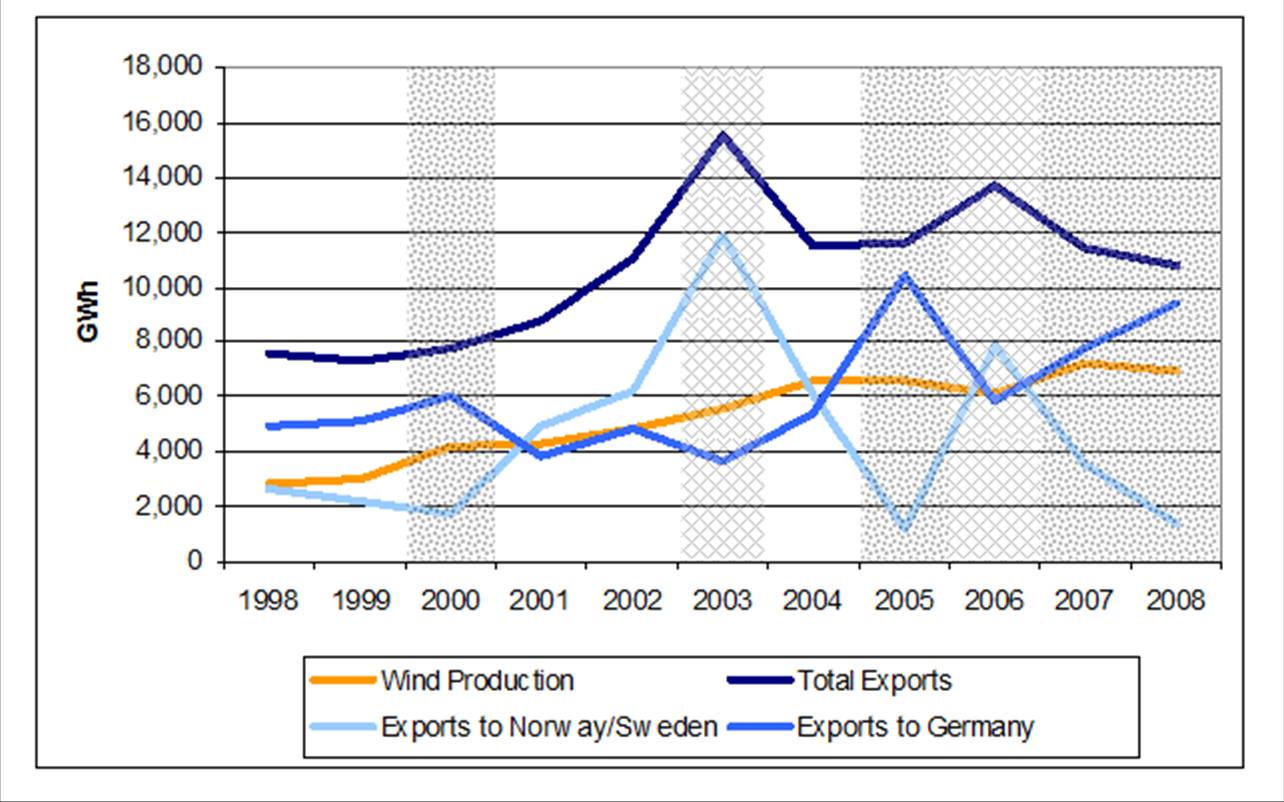
Figure 5 – Summary of wind production and exports to Norway/Sweden and Germany.
Figure 4 shows that total exports have increased coincident with wind production, especially in dry years, and 2003 was particularly dry, when the best use can be made of wind to conserve water in reservoirs. As fossil fuel electricity production in Denmark has fallen somewhat since 1998, it is more likely that wind forms part of the exported electricity versus only fossil fuel electricity production.
As previously explained, the peaks in net exports in 1996 (Part I, Figure 2) were clearly supplied by increased fossil fuel production. Information from a separate source shows exports in 1996 were very high at 19,200 GWh, with net exports of 15,400 GWh. The net amount compares favourably with DEA net exports for that year, as shown in Part I Figure 3. It is reasonable to assume that the export of fossil-fuel generation was the case for most years in that period when oil production in the North Sea was increasing. Since then it has peaked.
The electricity export/import aspects of the Denmark electricity system are complex and do not readily allow superficial analysis as some attempt.
Part III will show that wind most likely plays a major part in electricity exports for the more recent period of the first decade of the 21st century.
For ease of navigation, the other posts in this series are:
Part I – Introduction
Part II – Details of Exports and Imports (this post)
Part III – Wind Electricity Used in Denmark
Part IV – CO2 Emissions
Endnotes
[1] TechConsult (2008). “Analysis of Wind Power in Danish Electricity Supply 2005-2007” http://www.techconsult.name/analysis-danish-windpower-new.pdf
[2] Danish Center for Political Studies (Center for Politiske Studier) (2009). ”Wind Energy – The Case of Denmark” http://www.cepos.dk/fileadmin/user_upload/Arkiv/PDF/Wind_energy_-_the_case_of_Denmark.pdf
[3] Coherent Energy and Environmental system Analyis (CEESA) (2010). http://www.energyplanning.aau.dk/Publications/DanishWindPower.pdf
[4] Bach, Paul-Frederick (2010). “Wind Power Variations are Exported”. http://pfbach.dk/firma_pfb/wind_power_variations_2010_03_05.pdf . Bach was the director of systems planning in the West Denmark system operator ELTRA until 2005. He oversaw the integration of the West Danish wind carpet into the West Danish grid throughout the wind build up between 1996 and 2004, at which point the growth in wind was halted. West Denmark has 80% of the total Danish wind capacity.
[5] Andersen, Bertel Lohmann (2010).”Danish Wind Power – How Much is Exported?” http://www.reo.dk/data/archive/Rapporter/danish-wind-power-exported.pdf
[6] Danish Energy Association (2009). http://www.danishenergyassociation.com/Statistics.aspx. This document provides some information in a graph on imports/exports by country for 2008. A previous online publication of a time series of this seems to have been discontinued. Previous data started at 1998.
[…] Peeling away the onion of Denmark wind energy – Master […]
When wind speeds across Denmark increase, do they not reduce fossil burn accordingly? If they do not, what is wind generation for?
Increased wind production will result in decreases in electricity generation by other energy sources somewhere, unless of course the wind output is curtailed, which is not an uncommon practice. This does not translate into corresponding less fuel consumed as: (1) in the case of fossil fuel plants these operate much less efficiently balancing wind’s volatile output and fuel required per watt-hour of electricity increases, and (2) in the case of hydro being used to balance wind (often the case in Denmark where the wind is absorbed by hydro in Norway and Sweden) not fossil fuel plant production is involved.
Your question of what is wind generation for is a good one.
In Denmark’s case the associated emissions are dealt with in Part IV.