Wind Integration Realities: The Netherlands Study (Part II)
By Kent Hawkins -- May 24, 2010[Editor’s note: This is the second part in a four-part series on two new studies examining the negation of windpower emissions savings from fossil-fuel firming. The Netherlands study below, which is found to be consistent to Mr. Hawkins’s calculator approach, indicates a total negation of emissions savings from fossil-fuel fill-in.]
Windpower has traditionally been considered a substitute for carbon-based energy and thus a strategy for reducing related emissions, including that of carbon dioxide (CO2). However, reality is more complicated. Either natural gas-fired or coal-fired power must rescue wind from its intermittency problem, a role that creates incremental fuel usage and emissions compared to a situation where the conventional capacity could operate on a steadier basis.
Previous studies have highlighted this unsettling tradeoff for proponents of windpower. And a new study by C. le Pair and K. de Groot based on actual experience in the Netherlands finds:
The use of wind energy for electricity generation in combination with the requirement for fossil fuel powered stations to compensate for wind fluctuations can easily lead to loss of the expected saving in fuel use and CO2 emission. In addition, the conventional stations will be subject to accelerated wear and tear.
It is recommended to get an accurate and quantitative insight into these extra effects before society sets out to apply wind energy on a large scale. All producers must be required to publish data on the efficiency effects and fuel use when wind energy is added on.
This post reviews their study and compares its results with that produced by my fossil fuel and CO2 emissionscalculator, both of which show how quickly any claimed saving from wind can become negative given the reality of fossil-fuel backup to firm-up intermittent power.
Le Pair and de Groot analyze the published information on fossil fuel consumption and produced electricity for the generation plants in the Netherlands to determine the associated decrease in efficiency of fossil fuel plants in a wind mirroring role–and hence its effect on claimed reductions on CO2 emissions. However, their mathematical model is also generally applicable and will be used in subsequent parts of this series for actual experience with wind power in Colorado and Texas.
Technical Analysis
In the absence of specific information on the efficiency loss of individual fossil-fuel plants operating in a wind balancing role, they determine the effect in the efficiency loss in the total fossil-fuel fleet for the amount of wind generation present in the Netherlands in 2007. These calculations are possible due to the availability of published data on fuel input and electricity output for the total amounts of the various types of the power stations. The logic and associated algebra are challenging, but it is possible to reproduce their results.
Their analysis determines that the overall efficiency loss of the power station fleet due to the presence of wind plants at ?F=0 is: [note that ? means delta or “change in”. It appears WordPress does not recognize the Greek letter delta]
?R = (Ew / E) x R
Where:
?R = the overall efficiency loss due to the presence of wind plants of the power station fleet
Ew = the electricity production of the wind plants
E = The total electricity production of the wind plants and the power plant fleet
R = The efficiency of the these power plants without wind present
R is not known. The observed efficiencies in their Table 1 are the effect of the presence of wind plants and reported as Ri. This is solved by substituting (Ri + ?R) for R.
The resulting efficiency loss for the Netherlands central fossil fuel fleet is 2.11% as is shown in their Table 2. Policy makers take note that this corresponds to a wind penetration in terms of electricity produced of about only 3% and this results in no fossil fuel or C02 emissions savings.
The underlying assumptions are that (1) there is efficiency loss due to the presence of wind, and (2) the losses since the introduction of wind in the Netherlands are attributable to wind. These are reasonable because:
- There are sufficient indications of loss of efficiency from many studies including those provided in their paper and those listed here. Many fossil fuel and CO2 emissions saving projected by wind proponents ignore this essential consideration.
- The factors affecting fleet plant efficiency over time will be: deterioration with age, offset by effective maintenance and upgrades; replacement of plants with more efficient types; and parasitic loads of pollution reduction technologies. A study by the National Petroleum Council indicates that the overall trend is to improved efficiencies and a level efficiency profile for existing plants.
Translating this into the efficiency loss for the fossil fuel plants that are operating in the wind balancing role requires the determination of the electricity that must be produced by these, as all fossil-fuel plants are not being cycled to balance wind. Assuming le Pair and de Groot’s capacity factor for wind of 25%, the amount of electricity generation that is needed for wind mirroring can be calculated as 100%-25% or 75%. This is what must be produced on average over, say one year, to accommodate wind variations from 0-100% of wind capacity (which has an annual average of 25% of capacity). The efficiency loss for the fossil-fuel plants in the wind mirroring role can then be calculated by attributing the total loss to this subset. The results are shown in le Pair and de Groot’s Table 3, which is reproduced here as Table 1. In this case they have chosen to start from an assumed efficiency in normal operations of 45%.
Table 1 – Le Pair and de Groot’s Table 3 Showing Efficiency Loss of Fossil Fuel Plants
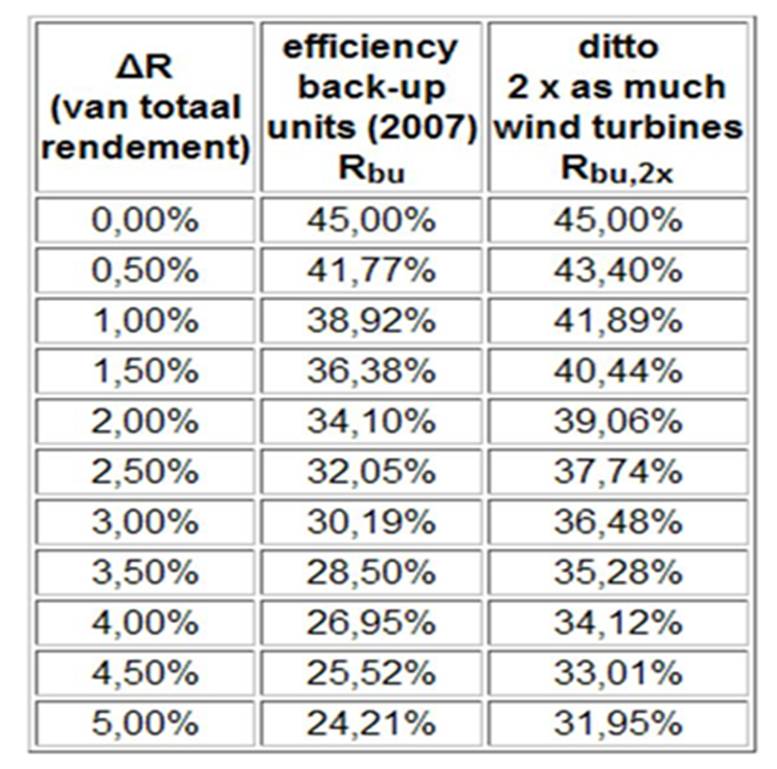
In Table 1, column one is the effect on the fossil-fuel fleet as a whole as wind production is increased from zero. Column two (Rbu) shows the resulting efficiency of the backup (wind mirroring) plants. Column three provides the equivalent values for twice the wind presence, which shows that for a wind mirroring plant efficiency loss of 34.12%, the expected efficiency reduction across the fossil-fuel fleet would be about 4%.
Le Pair and de Groot calculate that the threshold for no savings in fossil fuel consumed at the wind penetration rate for the Netherlands of 3.2% is about 2% (?R) for the central fleet of fossil fuel plants, or about their calculated actual value of 2.11%. The associated percentage reduction in the efficiency (heat rate penalty) of backup plants is calculated as follows from Table 1:
Backup plant efficiency is derived from the interpolated value between a ?R of 2.00% and 2.50% for 0.11 percentage points, or (0.11/0.5) x (34.10-32.05) = 0.45
Subtracting the interpolated value for ?R yields a backup plant efficiency of 34.10-0.45 (percentage points) = 33.65%
This means there is an efficiency loss (heat rate penalty) of (45.00-33.65)/45.00 = 25.2%. Changing the starting point of 45.0 does not affect the percentage calculation.
Comparison to Calculator Results
Table 2 shows the calculator results, setting the wind input at the Netherlands production of 0.39 GWy, their assumed 25% wind capacity factor and using the heat rate penalty of 25.2%. This calculator run assumes gas plants alone are used for wind balancing (shown with and without the need for OCGT) and Table 3 assumes that the proportion of gas and coal used for wind balancing is that of the overall installed mix.
Table 2 – Calculator Results for Wind Balancing Plants (Gas Alone) in the Netherlands
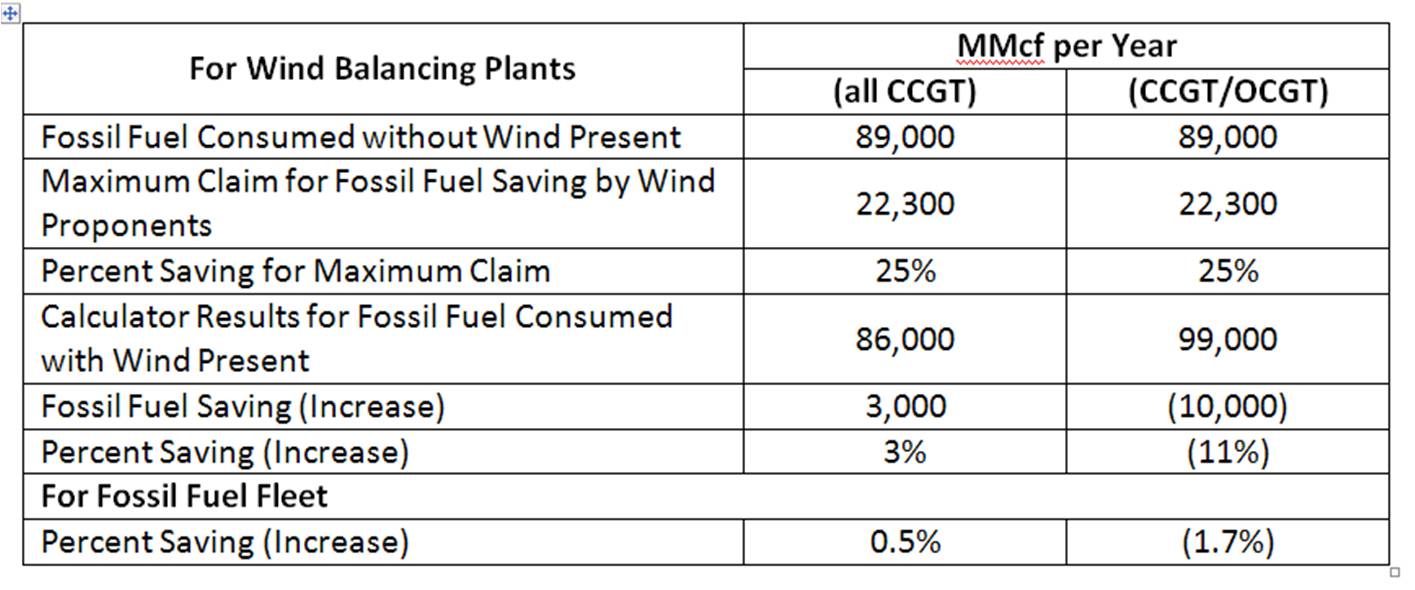
Wind proponents will typically assume the saving in fossil fuel will be the same as the wind capacity factor (in this case a wind capacity of 25% is used by le Pair and de Groot). This ignores the effects of wind on the efficiency of the fossil fuel plants in the wind mirroring role. When this efficiency loss is taken into account the calculator shows between 0.5% saving and 1.7% increase in fossil fuel consumption across the total fossil fuel fleet compared to the le Pair and de Groot level of 0%. Note also that the CO2 emissions are in proportion to fossil fuel consumption.
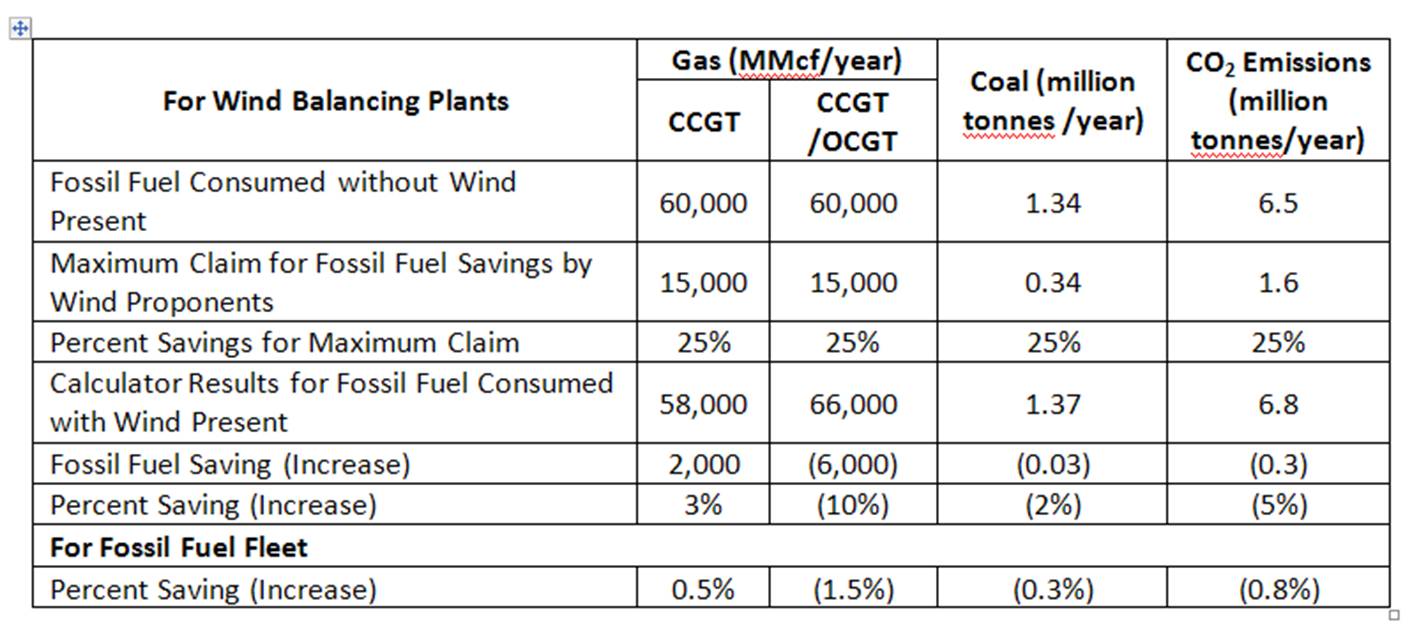
A second calculator run, now including coal plants in the wind mirroring role, was performed assuming that the fossil fuel plants in wind backup are in proportion to the overall ratio. A proxy for the combination, CO2 emissions, is shown.
Table 3 – Calculator Results for Wind Balancing Plants (Using Gas and Coal) in the Netherlands
Conclusion
The study under review found that 100 percent of the claimed emissions savings from windpower was negated by fossil fuel backup to firm up wind’s intermittency. The calculator finds roughly similar results to that of le Pair and de Groot for the level of wind penetration in the Netherlands.
[Part III tomorrow will examine the results of the Bentek study starting with Colorado.]
Nice work, Kent. Thanks for clarifying the way that Le Pair/De Groot calculated gross efficiency losses/heat rate penalties across the range of Dutch thermal generators. Rather ingenuous methodology. Given the nature of the problem, it seems reasonable that, when all of the Dutch thermal plants are properly accounted for, the Dutch results will become more refined, in the process becoming more congruent with your calculations.
A correction to the text has been made. The formula from the Netherlands study for ΔR is valid at the point that the fossil fuel savings become zero (ΔF=0).
[…] of Colorado and Texas by BENTEK Energy, LLC, in addition to a study of the Netherlands, found the coercion of utilities to accept wind power means they must suddenly turn on coal and […]
Russia vs Turkey : The Geopolitics of the South & the Turk Stream Pipelines
https://iakal.wordpress.com/2015/05/29/russia-vs-turkey-the-geopolitics-of-tuth-the-turk-stream-pipelines/