Where Wind Studies Go Wrong: Cullen in AEJ (Part II)
By Kent Hawkins -- February 14, 2014“The level of emissions savings provided by wind plants has never been conclusively determined, taking into account all the factors.”
Part I yesterday questioned the analysis and robustness of Joseph Cullen’s study, “Measuring the Environmental Benefits of Wind-Generated Electricity”. [1] Part II completes the commentary on this paper, covering:
- Questionable data, which seriously inhibits any analysis of wind performance
- Interstate trade in electricity, an often overlooked, but important, consideration in understanding impacts on emissions
- A summary of the acknowledged shortcomings of this paper
- Questionable opinions/claims made
Questionable Data
The level of emissions savings provided by wind plants has never been conclusively determined, taking into account all the factors. Further, there is no published accurate, minute-by-minute, actual fuel consumption or emissions by individual plant, especially for systems with notable levels of wind present. Note the limitations in the Katzenstein and Apt paper looked to by Cullen for corroboration as discussed in Part I.
In general, government reported emissions are estimates based on calculations using assumptions and relatively simple algorithms. In some cases, actual measurements are taken but are no better than those calculated as reported by the International Energy Agency (see page 35).
“Commercial instrumentation is available for monitoring CO2 concentration and flue gas volume flows. Given the limitations of such instrumentation, the accuracy of directly measured CO2 release is probably no better than that derived by indirect calculation.” (emphasis added)
A report by The Sustainable Energy Authority in Ireland, “Renewable Energy in Ireland”, in Appendix 1 also refreshingly recognizes the limitations to existing reporting methods.
“The assumption underpinning this approach is that the renewable plant is displacing the last plants to be dispatched to meet electricity demand, i.e. the marginal oil and gas plants. There are clear limitations in this analysis but it does provide useful indicative results.” (emphasis added for “indicative”, which is taken to mean “suggestive”)
“The limitations and caveats associated with this methodology include that it ignores any plant used to meet the associated reserve requirements of renewables. These open cycle plants will typically have lower efficiency and generate increased CO2 and NOx emissions compared with CCGT and these emissions should be incorporated into the analysis. The purpose of presenting a simplified analysis here is to provide initial insights into the amount of fossil fuels that are displaced by renewables and the amount of emissions thereby avoided.” (emphasis added)
The issue raised in the last quote speaks to the comments made in the Robustness section in Part I.
The above comments point out some of the typical shortcomings of many current approaches in determining reported emissions offsets for wind. At best, such results are useful only as some indication and for rough comparison purposes, for example between jurisdictions and time periods, and not reliable for absolute levels.
The Cullen article admits that the modelling approach used, “…relies only on publicly available generator output and characteristics“. Emphasis has been added to the quote because there is no adequate, publicly available information on the constant cycling required of other generation plants mirroring wind plants’ highly random output on a short-term basis, as indicated in Katzenstein and Apt’s paper in Part I.
Cullen somewhat distances his results from the EPA system CEMS on the basis that CEMS reporting includes less than two-thirds of the generators in the ERCOT system, a notable comment in itself.
“As a robustness check, I estimate the same model with hourly emissions data from the EPA’s Continuous Emissions Monitoring System (CEMS) as the dependent variable. Using CEMS data may be able to account for the changes in the emissions rate due to efficiency changes, though it may exacerbate ramping effects.”
The latter part of this quote needs elaboration. Cullen shows that using the CEMS data in his model results in 4% lower CO2 emissions offsets for wind. He concludes that this indicates relative robustness, but the CEMS data “may” exacerbate ramping effects. This implies that Cullen has in fact captured the ramping effects, which is very questionable as already described.
However, CEMS reporting is subject to question as indicated above. Also note that the CEMS data is hourly based, which likely masks ramping effects on much shorter time intervals in which electricity system balancing must operate to ensure system reliability. In summary the CEMS information more likely understates the ramping effect.
So questionable or incomplete data is a problem in the determination of complete and accurate results, and any corroboration claimed by Cullen is questionable.
Interstate Trade in Electricity
This is a factor that is almost always overlooked in analyses of wind performance, and is not taken fully into account in the modelling here. The general reason for this is that electricity exports to or imports from another jurisdiction are a somewhat complicated matter, and unfortunately often are taken to be relatively inconsequential, which they usually are not.
When Cullen is talking about electricity imports, it is presumed he is talking about net interstate trade, as opposed to import/export of electricity in connection with another country. For simplicity here, the terms “interstate trade” and “exports/imports” will be used to refer to interstate trade only. Further it is important to be clear whether or not any reference to this is a net number of exports/imports as is often the case in reported values.
Cullen also says that he observes the flows of electricity over connection lines in neighboring grids in 15 minute intervals and claims that less than 1 percent of daily generation is exchanged with other grids, while wind accounts for approximately 2%, which allows him to restrict his analysis to within the Texas system. However, this does not agree with EIA reports, [2] as summarized in Table 1.
Table 1 – Wind Production and Net Interstate Trade as Percent of Total Texas Electricity Production.
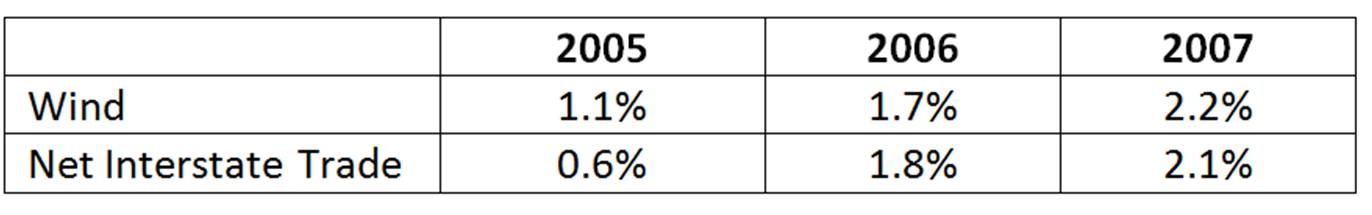
Note that total wind production is at the same level as net interstate trade for two of the three years that Cullen analyzed, but the net of the interstate trade and could conceal larger amounts of export and import levels over the same period.
Further, Cullen talks in terms of imports, but in the three years analyzed, Texas was a net exporter of electricity. Note the balancing of Supply and Disposition in the reference shown for Table 1. Some clarification of this by Cullen would have been helpful.
In summary, notwithstanding the relative isolation of the Texas electricity system, interstate trade in electricity cannot be ignored in the analysis, and exports/imports even on a net basis could just as easily account for much of the reductions in fossil fuel plant emissions as wind.
To further examine misunderstandings in connection with inter-jurisdiction trade in electricity, in footnote 30 for imports, Cullen suggests that if it was assumed that the emissions offset profile of imports to be the same as in the models, this would change the results found.
It is preferable to assume imports carry no emissions, as it would be very difficult to identify the specific source of the electricity generation profile behind the exported electricity. For the purposes of simplicity in explaining this, assume that such distinction can be made in a couple of simple cases.
Case 1
The exporting jurisdiction is exporting electricity associated with emissions. For the importing jurisdiction to also be charged with these emissions would be double accounting, unless the exporter took a balancing credit. Imagine the complex negotiation associated with this arrangement.
Case 2
In the case of exporting electricity from non-emissions producing generation there is no need to associate emissions with either the export or import as well. However there is an example where this is not done. Denmark reports emissions in two ways: (1) as produced, and (2) after taking credit to reduce its actual emissions based on the amount of exported wind production.
The latter view is often cited in error. See Peeling away Onion of Danish Wind for more details. Here as above, this works if the receiving jurisdiction takes a balancing increase in reported emissions, which is unlikely, resulting in a double accounting for emissions reductions, an undesirable outcome.
Admittedly inter-jurisdiction trade in electricity is somewhat complicated, and the above descriptions are simplifications to illustrate the need to view associated emissions as staying within the electricity generating jurisdiction. Imports/exports from and to another jurisdiction should be treated as emissions free.
Perhaps the most important matter is that in most cases, even in Texas, imports and exports of electricity must be fully taken into account when analyzing the emissions impact of wind presence.
Acknowledged Shortcomings
The paper contains appropriate caveats including:
- Limitations with respect to transferring results to different wind penetrations or electricity systems.
- No consideration is given to electricity system reliability.
- It is not a comprehensive cost benefit analysis of wind power.
- It does not address the different nature of future generation plant type investments induced by wind.
- Note 32 says the paper does not “…disentangle how the variability of wind power affects the emissions offset.”
These properly acknowledged limitations reduce the value of the paper in providing useful insights and reliable conclusions about the effects of deployment of wind power.
Questionable Opinions/Claims
There are a number these, which further reduce the value of this paper.
The statement, “In fact, nearly all costs associated with wind power production are incurred during the construction and installation phase of a wind farm.” is not correct. Substantial additional costs are incurred by the presence of wind in (1) otherwise not needed, dispatchable capacity to balance wind’s persistently, erratic behavior within short periods of time (minutes or less) and unreliability on a longer term basis of hours and days, and (2) in substantial increases to the grid unique to wind to gather wind’s dispersed generation, transmit it to typically distant demand centers and support demand management in distribution systems. See the series on “Wind Consequences” for more information.
A modern 1 MW (not 1 MWh) wind turbine does not require only “roughly $1 million” to install. Overnight implementation costs are over twice this amount according to the EIA.
Cullen assumes a Wind turbine life of 20 years and that any change in operating efficiency over its lifetime is negligible. This is contrary to experience that shows substantial reductions in performance measured by load factor (aka capacity factor). Figure 2 shows experience in Denmark and the UK. [3]
Figure 2 – Performance Degradation of Wind Turbines in Denmark and the UK
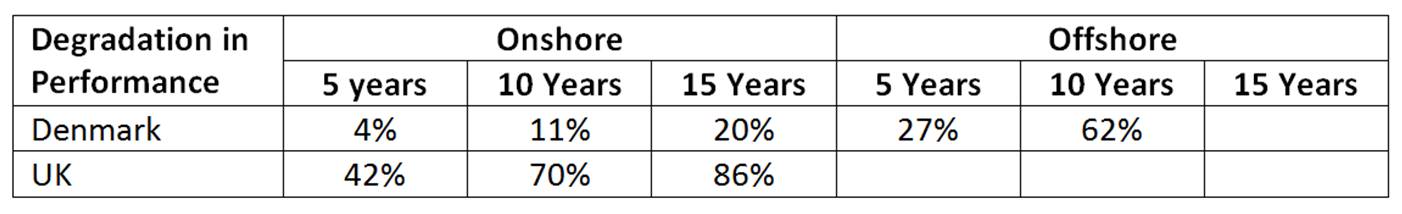
The values shown here are weighted by capacity, because this better captures the effect of the most numerous wind turbine sizes, and produces more typical results than simple averaging. The years with no values are because of little or no experience. Outages due to mechanical failure are included in these statistics.
Most of today’s wind turbine installations have occurred since 2000. These are typically 1-3 MW and much larger than their predecessors. These larger wind turbines have a 100 ton [4] blade assembly and nacelle enclosing the generator on top of a 200 foot, or more, tower. They are reported to be the largest rotating structures in the world. A possible explanation of Denmark’s slower degradation experience may be because most were installed before 2000 and the majority are of a much smaller size.
There are many considerations behind these numbers, but a strong case is made for concern about considerably shorter than generally expected life times for wind turbines, as indicated by the quote from this paper:
“With such low levels of performance it seems very unlikely that large wind farms will continue in operation beyond 10 years of age, with a strong likelihood of re-powering at that point. The consequence is that large scale reliance upon wind power seems likely to involve a regular – and costly – commitment to upgrading major components of the wind turbines.”
There are other reports on frequent, major component failures requiring substantial costs in the order those for the initial implementation. [5]
On page 112, Cullen refers to a paper by Holland and Mansur, which describes how real time retail pricing would shape demand by reducing peaks and shifting load to low cost periods at night. Holland and Mansur explain that this can have an impact on emissions, but whether the impact is positive or negative depends on the generation plant profile of the jurisdiction. Cullen claims that wind plants likewise reshape demand, which is not obvious at all. Apart from the fact that there is no mention by Cullen of the necessary attendant real-time retail pricing, wind usually has higher production at night, and it thus tends to shape low cost production base load generation (not demand) in this period. Further he states that this re-shaping of demand necessarily leads to emissions offsets, which is different from Holland and Mansur’s conclusions which allows for the possibility of increased emissions as well.
As described above in the Analysis Approach section, a major effect of wind is its impact on short term residual demand variances, a totally different type of demand shaping. This shapes the residual demand in a non-beneficial way and arguably increases emissions overall.
Cullen states, “However, for both economic and environmental reasons, hydro facilities are unlikely to spill water over dams without generating electricity.” This is clearly an inappropriate assumption and demonstrates his emphasis on market participants determining electricity system operations. The Bonneville Power Administration (BPA) in the Pacific Northwest provides an instructive case study of system operational issues and associated contortions required here and here.
Another related comment by Cullen is, “Both nuclear and aggregate hydropower production will be largely unaffected by the roll out of wind farms.” The use of “largely” is acknowledged, but the statement can be read to suggest non-problematic impacts. The BPA experience above speaks to the hydro aspects. Admittedly nuclear is an unlikely form of electricity generation to be offset by wind, but it does happen as discussed here.
A final very questionable claim is, “First, technology advancements in wind turbines have reduced the cost of wind power by 80 percent over the past 30 years (Wiser and Bolinger 2007).” I could not find confirmation of this claim in the referenced paper. A chart on page 21 does show project costs per kW reducing by about 65% between 1982 to 2000 and then increasing thereafter. This has a related comment in footnote 35, ” Limited sample size early on – particularly in the 1980s – makes it difficult to pin down this number with a high degree of confidence.”
Further to claim technology advancements have been the cause is questionable. The cost per kW of a wind turbine has been largely influenced by simple mechanical considerations, primarily the size of the blades and height of the tower, both of which have increased dramatically over this period.
Summary
Given the very large portion of national wealth (multiples of $trillions) necessary for the contemplated extensive deployment of wind plants, and the associated longer term risks to electricity system viability and reliability, we simply have to do better at complete and conclusive analysis of the impact of wind plants with much improved public availability of operational data on generation plants, including real time fuel consumption and accurate emissions. Fuel consumption may be the only realistic way to assess emissions.
It is questionable that sophisticated econometric modelling is appropriate for this task.
[1] As indicated in Part I, there is an earlier version which may be accessed at http://www.u.arizona.edu/~jcullen/Documents/measuringwind.pdf , but no attempt has been made to confirm that it is an identical document.
[2] EIA (2012). http://www.eia.gov/electricity/state/texas/ For interstate trade see table 10. for Wind data, http://www.eia.gov/electricity/state/texas/
[3] Hughes, Gordon (2012). “The Performance of Wind Farms in the United Kingdom and Denmark” http://www.ref.org.uk/attachments/article/280/ref.hughes.19.12.12.pdf Chart is based on calculations from Figure 2.
[4] AWEA http://www.aweo.org/faq.html
[5] This is not widely reported, and some links to sites previously dealing with this topic appear to have removed the documents in question. Here are some currently available reports relating to this matter.
http://billothewisp.blogspot.co.uk/2013/12/wind-turbines-ghost-in-gearbox.html
Kent, per usual, nearly every claim you made in this post is incorrect:
1. You claim EPA’s Continuous Emissions Monitors measure emissions on an hourly basis, and you claim that they likely understate true cycling-related emissions as a result. In reality, CEMS take measurements at least every 15 minutes, and those are averaged to arrive at the hourly number. http://www.epa.gov/airmarkets/emissions/continuous-factsheet.html
Regardless, there is no reason to think that the interval of measurement would bias the result in either direction. Attacking the validity of CEMS data is a sure sign of desperation. What more could you want than measurements of the actual emissions going out the power plant stack on a 15-minute basis?
By the way, it is hilarious that at the end of your piece you say fuel consumption data is the only valid way to measure emissions, as I previously made that exact point while your fossil fuel industry parent company IER [editor: see RLB response below] got tangled up in Medieval alchemy trying to argue that fuel consumption data was not a valid proxy for emissions. I guess now that CEMS data also refutes your arguments you have fallen back on using fuel use data, which still shows that wind produces the expected benefits. You can follow IERs circuitous argument in the comment section here:
http://www.instituteforenergyresearch.org/2010/06/23/wind-integration-does-it-reduce-pollution-and-greenhouse-gas-emissions/
The bottom line is that NREL’s analysis did everything you ask for and found that wind energy saves 1190 lbs CO2/MWh, with the impact of cycling a negligible 0.2%.
2. You claim Cullen’s analysis is flawed because he didn’t look at electricity imports and exports for Texas. The problem for you is that Cullen’s analysis looked at ERCOT, not Texas, and those are very electrically. ERCOT exists in almost total electrical isolation, aside from weak (a few hundred MW) AC-DC-AC ties with its neighbors. Ask any Texas electricity regulator if ERCOT engages in interstate commerce in electricity and you’ll get a forceful rebuttal to your claim. In contrast, some northern, eastern, and western parts of Texas are not part of ERCOT but are parts of the Eastern and Western Interconnections. These are the areas that exchange large amounts of electricity across state lines and are picked up in the EIA data, but they are not relevant for Cullen’s analysis as he only looked at ERCOT.
3. The fossil fuel industry myth that wind plant performance drops off has been rebutted here, here, and here:
http://www.powerengineeringint.com/articles/2014/02/research-backs-resilience-of-wind-turbines.html
http://www.aweablog.org/blog/post/fact-check-oops-wind-farm-performance-stays-strong_1
http://www.ewea.org/blog/2012/12/study-on-turbine-lifespan-just-more-anti-wind-propaganda/
Michael Goggin,
American Wind Energy Association
Please appreciate the fact that we approve your responses virtually verbatim, which is a lot more than Climate Progress and other climate/energy alarmist, government-energy-policy sites do.
This said, your gratuitous description of “fossil fuel industry parent company IER” is way off the mark. I have summarized our mission here: http://www.instituteforenergyresearch.org/2013/05/21/ieraea-a-free-market-energy-organization/
IER supports consumer-driven energy and is against crony capitalism. The wind industry is based on special government favor and is market-rejected as a dilute, intermittent energy. We both applaud and criticize energy companies depending on whether or not they are market-driven and taxpayer neutral. Kent does not receive a dollar from fossil fuel companies–you receive 100% of your salary from the wind industry or from taxpayers.
Robert, this matter can be settled very easily with a simple yes or no question. Does IER/AEA receive funding from organizations or individuals in the fossil fuel industry? I know you won’t answer, though we already know the answer is yes:
http://www.washingtonpost.com/politics/inside-the-koch-backed-political-donor-network/2014/01/05/94719296-7661-11e3-b1c5-739e63e9c9a7_graphic.html
AWEA is always clear about where our funding comes from – it’s even in our name. IER/AEA is not.
Michael:
The only purpose for asking a question when you say ‘though we already know the answer’ is to bring the argument to ad hominem. Our donations are voluntary and private. Our free market positions, furthermore, cut across firms and industries so as to make our ‘friends’ and ‘foes’ change per issue and over time. The key question is: does the individual or firm benefit from a pro-consumer, pro-taxpayer perspective. If so, I’d say they ‘support us.’ If they are cronies, dependent on special government favor, I’d say they are less likely to ‘support us.’ Does this help?
Here is a simple yes or no for you: do you believe that Kent or me hold our position on wind power because of our donors, or that we hold our position because we believe it to be true initially?
I should remind you that your organization, AWEA, is supported by the likes of me (and other MasterResource bloggers) because I am (we are) a taxpayer(s), whereas you do not support IER involuntarily. (We would be delighted to add you to our donor list as a private citizen! You can proudly tell folks–we will not per our policy.)
I will also inform you that AWEA worked with Enron Wind Corp. to try to get me fired from Enron back in the late 1990s–a reason that would make a lot of folks very upset.
(See here: http://www.politicalcapitalism.org/enron/060898.pdf) As it is, I try to keep my emotion out of it.
It seems to me that the wrong answers are being questioned WRT Kent’s piece. Wouldn’t a better question be: “What is the least expensive means of reducing criteria emissions in a region, starting with the fuel and heat rate mix and examining various means of mitigating the emissions?”
A re-running of the chronological dispatch order under various “cleaner” scenarios might be a fair starting point, with cycling and part load heat rate penalties considered based at least on manufacturers’ published data sets.
And in addition to these considerations, we must attempt to answer the question of capital cost and system capacity. We should start with an understanding of the intended use of “capacity credit” and capacity value” – which is to determine how much firm capacity a system requires in order to meet peak demand (whenever it occurs across peak hours of the year) plus some reserve margin of 15% or so, with an LOLE standard of one incident every ten years.
This becomes important as we understand that RTOs have historically overstated the metric for wind, often by using a capacity factor across peak hours. That method sets wind up to fall below its CV/CC 50% of the time! Potomac Economics, the IMM for MISO, in their 2012 state of the market report of MISO, suggested the prCV/CC for wind should be 2.7% of nameplate.
Essentially, based on that figure, since wind replaces only about 1 30th of a MW of firm capacity from thermal units per nameplate MW of wind, we can say that “wind replaces some fuel but almost no dispatchable plants. (Michael, please go on and tell us that AWEA has gotten the term “dispatchable” redefined using taxpayer dollars. Thanks!)
If wind cannot replace plants, then its value is only what it can replace – the fuel, which is worth between $10 (nuclear) and about $35 NG consumed in CT) per MWH. Then we have to consider the ratepayer cost (albeit not an immediate or direct affect) of forced under utilization of [high capacity value bearing] generation assets. Here you will want to tell us from one side of your mouth that “so far” wind has had only a small affect on the CF of the rest of the fleet, while from the other side of your mouth telling the world it won’t be a problem for wind to someday reach 20 to 30% of the generation mix. We are all well aware of the shell games you use to maintain access to our tax dollars and foist mandates at (so far) the state level.
In PJM, where as you know I live, we are 70% coal today with the federal EPA forcing a large percentage of that fleet to retire. What are our options to replace that lost guaranteed continuous minimum contribution across all peak hours of the year in PJM?
nuclear
CCGT
CT
clean coal (unproven)
wind/gas hybrid
wind/clean coal hybrid (unproven)
Then how much emissions mitigation occurs per dollar spent replacing the coal fleet?
CCGT as a base-load or shoulder solution is the cheapest at $65 – $90 per MWH using EIA LCOE tables and derating CF for shoulder use.
Adding new wind to new CCGT (assuming this can be done without also adding some CT use which has 50% higher emissions than CCGT) according to the ‘Hidden Costs’ report (Taylor/Tanton, 2012) would cost about $150/MWH and save an additional 30% of emissions beyond the 60% saved using CCGT alone. So 2 1/2 times the cost to save 1/3 more emissions. I believe the takeaway is that until we have replaced all retiring coal plants with CCGT, adding wind to CCGT is not a cost effective option.
It is hilarious to see Michael Goggin throw the “fossil-funding” card around…again.
Has he forgotten AWEA’s year-long membership with the “dark money” ALEC? (Have you finished washing that PM 2.5 out of your leisure suit yet Mike?)
http://thehill.com/blogs/e2-wire/e2-wire/280161-green-energy-groups-dump-alec-membership
And has Michael rushed to let AWEA’s board members AEP, FPL and Iberdrola know that they are “fossil-fueled evil doers” as well? I am sure you remember the good Senator Seitz’s stinging rebuke for your duplicity on this very issue. Shall I post the photo again? 🙂
And was Denise Bode’s $5k donation to WindPAC from her AWEA salary? Or was it leftover filthy fossil lucre from her days in oil and gas?
BTW: Nice to see FPL (or “Filthy Polluting Looter” as us enviros call them 😉 )putting money into both AWEA and WindPAC.
http://www.electionfund.org/Committee/American-Wind-Energy-Association-Windpac
Just wondering: what does FPL say to you when you tell them they are nothing more than fossil-filth hell-bent upon subjugating the huddled masses in the godless pursuit of ill-gotten booty? I mean, will they even eat lunch with you?
And really Michael. Must you start every single post with some condescending statement such as “Kent, per usual, nearly every claim you made in this post is incorrect… ” I mean, there is nothing worse than a man that condescends from a lower position.
Truthfully, the correct response to your paid-lobbyist song and dance is “as usual, every statement Michael Goggin makes is in exchange for a paycheck from his wealthy corporate benefactors (1%’ers all) and is designed to extract the maximum market share for his industrial monopolist utility masters.”
Consider:
Michael loves to play in the sand box of “wind reduces emissions/no it does not…na na na na boo boo!” as if AWEA and CanWEA have any real interest in emissions avoidance as anything other than a marketing gimmick.
In fact the CanWEA example is apt. AWEA’s “Canadian Twinky-twin” markets wind as a cure for a much different specter: “foul” nuclear energy.
Chris Forrest, vice-president of communications and public affairs for CanWEA pitches wind+gas as a replacement for nuclear, saying: “…..we, in Ontario, will soon be forced to make a choice with respect to future electricity investment: renewable power partnered with natural gas, or new and refurbished nuclear power. ”
(Note to Chris: wind generation makes energy, not power. Just sayin’. I should probably throw in a low class ad hominem here about “misinformation” or “liar liar pants on fire” a la “MG” but it is unbecoming.) 🙂
http://www.thespec.com/opinion-story/2226895-wind-energy-is-a-better-deal-for-ontario-than-new-nuclear/
Quiz for Mike: What happens to emissions in the CanWEA “gas+ wind-slays-evil-nuclear” scenario Mike? They go up or down?
Let me help you…nuclear has no emissions. Gas has some. Net effect? More emissions. I don’t need to run any dispatch models to verify that. Neither do I need a check from Beinecke, Soros or Steyer. Or Buffet or Koch or that old perennial bogeyman, Richard Melon-Scaife. Whatever happened to him? Is “Evil Koch Brothers” easier to pronounce?
But where does Chris Forrest’s “Wind+gas instead of terrifying Fukushima-horrific-death-nukes” leave AWEA and CanWEA with respect to the other demon du jour, hydraulic fracturing?
Well, let’s see…
Ontario has roughly 13,000 MW of nuclear online.
To replace that would be simple: 13,000 MW of CCGT/CT plus another 13,000 MW of wind. Or put differently, $13 billion in new gas gen + $26 billion in wind.
But 13,0000 MW of new gas generation that is being interrupted mainly in winter and at night by 13,000 MW of 25%CF wind still nets 9,000 MW of annualized new gas-fired generation in addition to the 9,000 MW of gas generation currently online in Ontario today.
That’s a lot of new natural gas consumption. I mean REALLY a lot!
Only one way to find that much gas these days: frack, baby, frack!
But won’t your friends at “The Sierra Club Public Relations/Shameless Green Marketing/John Muir Memorial Dance Society” object to that much fracking?
I think we know the answer to that. They do object. But only now that the $26 million their former President Carl Pope took from those “nasty fossil pigs” Chesapeake Energy ran out. They thought gas was great til then. And they just may again if I ever get really rich.
Bottom line for today’s article?
It is rather pointless to argue with a man whose paycheck depends upon not knowing the right answer.
Michael can never concede he is wrong. To do so would leave him unemployed.
But judging by his “now-even-more-snarky” demeanor, I think it is safe to assume his semantic war chest has grown as thin as the chances Dave Camp will jump back on the PTC wagon.
I will let you know more after my meeting with him.
Until then, try and stand down wind from me, Michael. Your coal emissions aggravate my asthma.
Kisses!
Kevon Martis
Volunteer Director
http://www.iiccusa.org
“Fossil fuel free since 2011!”
Kevon, any substantive response to the points I made in my comment? For someone who accuses others of ad hominem, you sure spew a lot of it. Also, speaking of people who never concede they are wrong, how long do you plan to avoid answering the simple question I posed to you here?
http://theenergycollective.com/rodadams/306636/limitations-unreliable-energy-sources-aka-renewables#comment-99511
[…] my 2014 post Where Wind Studies Go Wrong: Cullen in AEJ (Part II) , Michael Goggin of the Amercian Wind Energy Association (AWEA) made a comment that recently came […]
I was unaware of the comments on this post until August 2016. Goggin’s first comment has now been responded to at http://www.masterresource.org/american-wind-energy-association-awea/wind-studies-go-wrong-response-michael-goggin-awea.
[…] IER Funding I did not respond to Appell’s repeated calls for me to talk about IER’s funding sources. At an exchange at MasterResource two weeks ago, I responded to the American Wind Energy Association’s Michael Goggin statement: […]