Natural Gas Wins the (Frigid) Day(s)
By Allen Brooks -- January 27, 2026Ed. note: CNN’s January 22, 2026, headline–“Extreme winter storm threat sparks historic natural gas spike”–begs for the proverbial rest of the story, presented below by Allen Brooks at Energy Musings.
“For those of us who lived through Uri and are still paying for its cost, the uproar over last week’s gas price jump is somewhat laughable. Yes, gas prices jumped to a high of $5.28/Mcf. However, during Uri, spot gas prices soared to $23/Mcf, while power prices were capped at $9,000 per megawatt-hour (MWh).”
Yes, natural gas futures prices rose from $2.70 per thousand cubic feet (Mcf) on Monday to close the week at $5.28, a jump of 96%. Just between the close of trading on Thursday and Friday’s close, the gas price rose by over 47%. It was clear that natural gas traders were caught on the wrong side of their bets, forcing them to scramble to cover their positions.
A little research showed that gas prices had risen in the first part of December amid a cold snap. However, it was predicted to be short-lived, with warm weather expected to last through the end of January. Traders were happy to sell gas futures contracts in December, with the intention to repurchase them at the end of January.
Mother Nature and the Jet Stream combined to unleash a Polar Vortex across the central United States, extending as far south as the Gulf Coast. The bitter cold followed, with some temperatures well below freezing and even lower wind chills. The Polar Vortex collided with a wet weather front expected to move from the Texas/Mexico border across the southern U.S. and into the Mid-Atlantic and New England regions, delivering heavy snow and sleet.
Storm Fern vs. Storm Uri (2021)
On Friday, CNBC anchors hyped the natural gas price story. Now, we do not know exactly which natural gas price data series the various news organizations are looking at. To put the current natural gas price jump story into perspective, we compared the futures price from December 29, 2025, to January 23, 2026, with the spot prices for February 2021, when Winter Storm Uri nearly destroyed the Texas power grid.
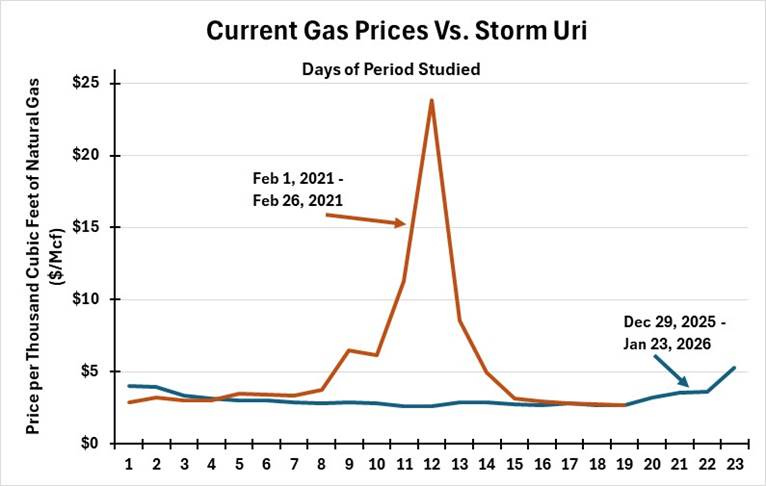
For those of us who lived through Uri and are still paying for its cost, the uproar over last week’s gas price jump is somewhat laughable. Yes, gas prices jumped to a high of $5.28/Mcf. However, during Uri, spot gas prices soared to $23/Mcf, while power prices were capped at $9,000 per megawatt-hour (MWh).
Natural Gas Price Reporting
Since the crude oil market has become boring for analysts and business reporters, more attention is being paid to the gyrations of the natural gas market. Some of that attention is related to the role that U.S. liquefied natural gas (LNG) is playing in meeting Europe’s winter heating and electricity needs. Between September and mid-November, European Union natural gas prices fluctuated around the €32/MWh ($38). This was while EU gas storage facilities were being rebuilt for the upcoming winter.
When warm rather than cold weather impacted Europe in November, gas prices collapsed, dropping to €27/MWh ($32) before slowly climbing to €28/MWh ($33). However, Arctic air descended on Europe, and natural gas storage supplies were rapidly drawn down, prompting buyers to race to secure additional supplies. This pushed up gas prices. The increase was further bolstered by fears that U.S. LNG would be used as a weapon amid growing U.S./EU tensions over Greenland. European natural gas prices jumped by 12% over two days, eventually reaching €39/MWh ($46).
Natural gas is drawing significant attention both here at home and internationally. The U.S., which came to Europe’s rescue in 2022 after Russia invaded Ukraine and the continent lost access to Russian pipeline gas. U.S. LNG shipments surged, followed by additional supplies from Qatar, the world’s two largest natural gas exporters.
Currently, U.S. LNG is the primary gas supplier to Europe, as Qatar has balked at supplying gas due to the recently enacted EU carbon border tax scheme.
Given the increasing attention being paid to the natural gas market, primarily because of its role in keeping the power on in the U.S., we thought we would examine the market. Not many people are familiar with how the gas market works or what changes may be in store for it if the push to transition our energy system away from fossil fuels toward renewable power continues.
Gas Storage: The Real Balancer (not batteries)
Natural gas plays a significant role in heating homes during winter, so there must be an adequate supply when cold temperatures arrive. Therefore, many analysts focus on the level of national gas storage and how it is being depleted, since the pace of restocking will impact gas prices. The Energy Information Administration (EIA) publishes weekly data on gas storage levels.
Gas storage volumes appear adequate for this winter.
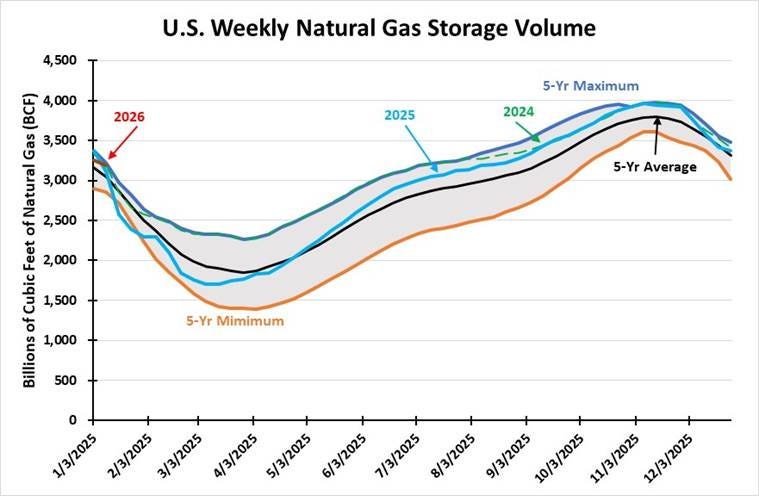
The chart, which shows the first two weeks of 2026 storage data compared with 2025, notes that current volumes are in line with those at the start of 2025. We anticipate that next week’s EIA storage data release will show a sharp drawdown as was experienced in 2025. It will be interesting to see whether storage volumes dip below the 5-year minimum volume. Such a scenario would likely sustain or push gas prices higher.
Gas Price Signaling
Another aspect of the natural gas market is price. The focus on the jump in natural gas futures prices due to bitter cold weather stems from natural gas prices being low for so long. Prices always rise during the winter, as consumers worry about a lack of supply should winter weather prove colder and last longer than forecast. However, gas prices have been depressed by rapidly growing supply, especially the increase in associated gas from crude oil shale wells. The following chart shows the entire data series for daily spot natural gas prices available on the EIA website. It covers from the beginning of 1997 to January 20, 2026.
Interestingly, the January 20 spot price was $4.00/Mcf compared to the February gas futures price of $3.23/Mcf. That difference reflects the willingness of gas buyers to pay more for immediately available gas supplies, rather than for gas to be delivered in the future.
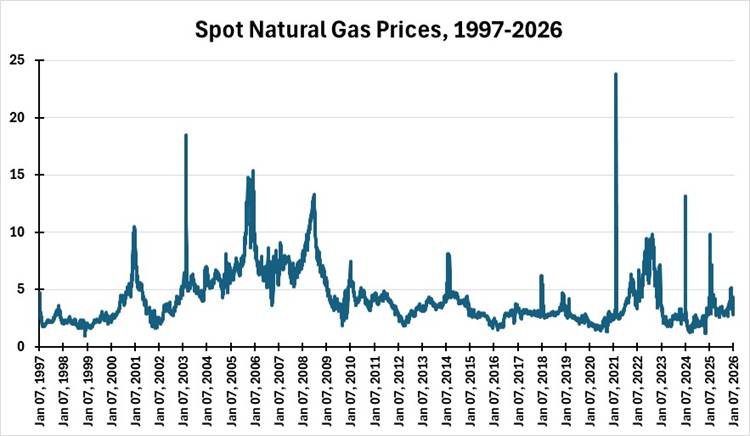
You will notice that natural gas spot prices have spiked numerous times. Most are associated with winter events, although several reflect the impact on gas markets from hurricane disruptions and damage at other times of the year. We examine several of these spikes later.
Gas Affordability, Usage Gains
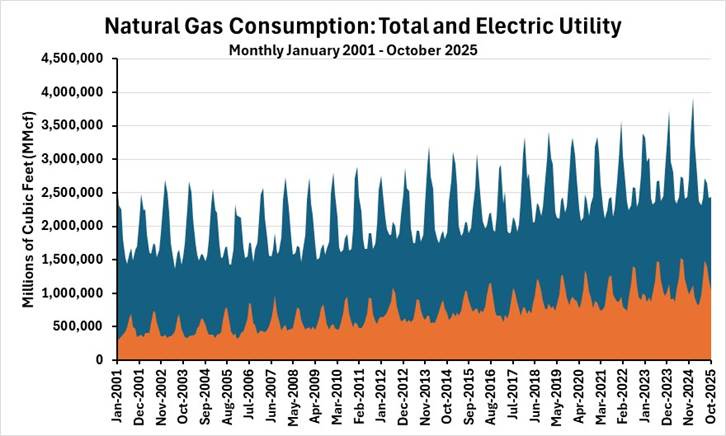
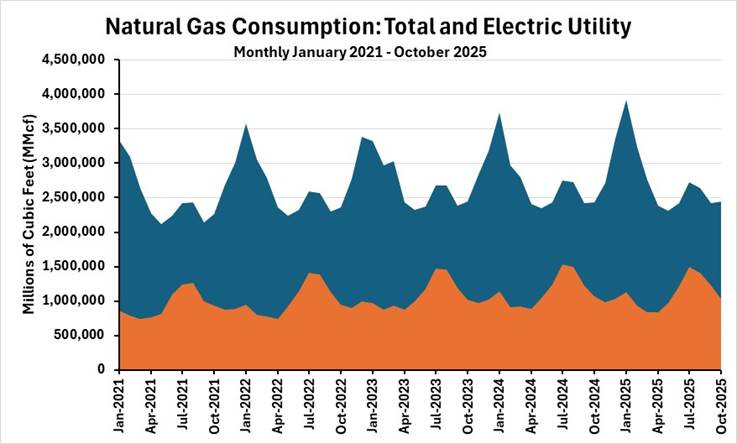
Significantly, natural gas consumption has increased over the past 25 years, helped by the growth in output from the gas and shale revolution. This chart shows both the increase in total natural U.S. gas consumption and the growth in gas volumes used to generate electricity. This consumption growth has been supported by the switch from coal-fired to gas-fired generation, which has driven the decline in U.S. carbon emissions.
Air Conditioning Demand
A key driver of natural gas utility consumption is growth in air conditioning demand. Examining a shorter time span for total gas and utility gas consumption shows how utility use peaks during the summer. The winter gas consumption peaks reflect its use in home heating.
Importantly, the push to “electrify everything” in net-zero emissions scenarios will result in winter rather than summer electricity demand peaks. The switch to a winter peak will create challenges for the electricity grid, as the risk of blackouts could result in greater human suffering and deaths than a blackout during the summer peak demand period.
To return to natural gas price volatility, the following chart shows three winter peak demand episodes. While the percentage changes may have been less than during last week’s price spike, the magnitude of the price changes was significant.
Gas Price Volatility Working
Winter natural-gas price volatility is routine.
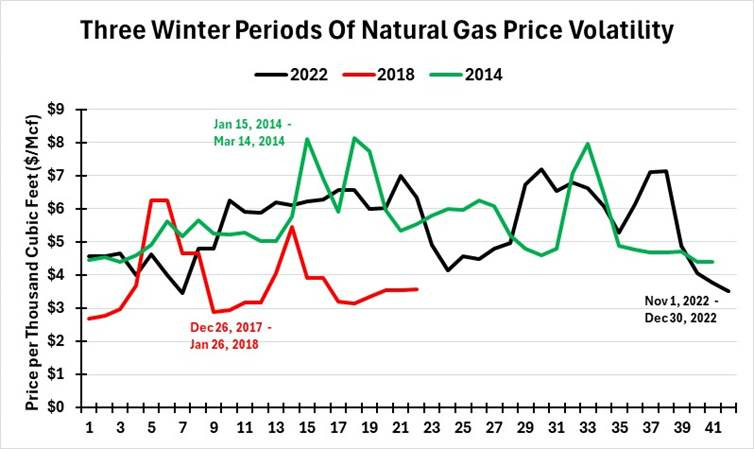
Over the two months of November and December 2022, natural gas prices began at about $4.50/Mcf and ended close to $3.50. In the interim, the gas prices touched $7/Mcf three times. Likewise, the two-month span from mid-January to mid-March 2014 saw prices swing from $4.50 to $8/Mcf three times before settling back to where they started.
The last episode was a winter period similar to our most recent. Prices soared from under $3/Mcf to over $6, then back to $3, then back to $5.50, before ending at $3.50. That price journey spanned three weeks.
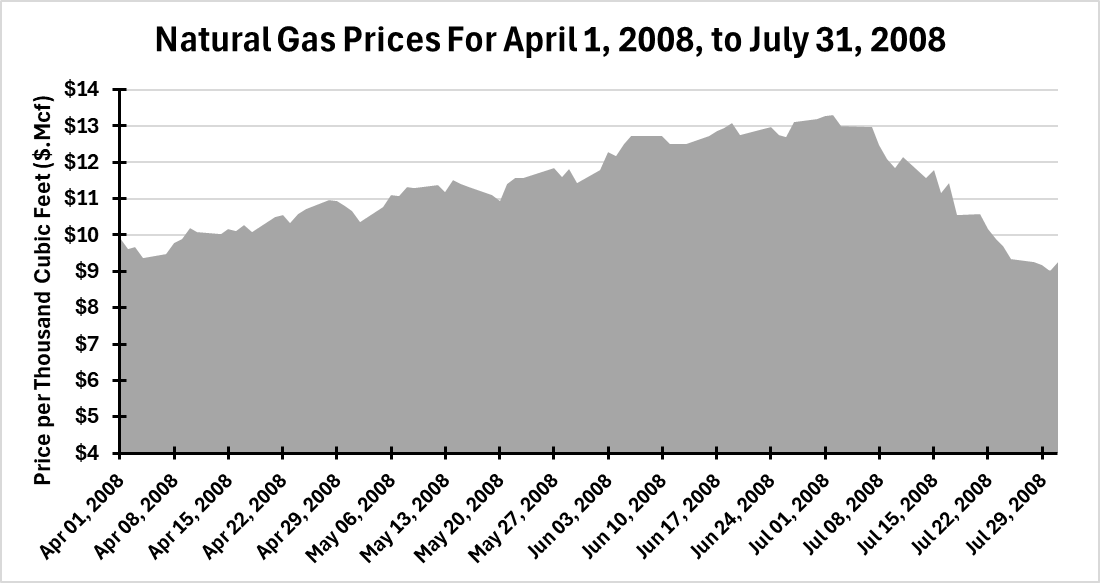
Our final natural gas price chart covers the spring through early summer of 2008, which was before the shale revolution delivered significant volumes of gas. That was a hot spring and early summer, and the ongoing financial crisis was also impacting the gas market. Prices climbed steadily over the months, peaking in early July. Note the price levels of $10-$13/Mcf. Today, the media is freaking out over natural gas prices that are about half what they were in 2008.
Conclusion
The business media is always looking for a topical story that offers hyperbole. And recently, the natural gas market experienced price volatility because marginal trading and extreme winter weather.
Still, macro results from micro market-reliance demonstrate low overall prices and excellent operational performance, from upstream to midstream to downstream. The revived domestic oil and gas industry from deregulation (for the most part) is bearing fruit. This should continue, though prices may not retreat to the lows of recent years due to the twin pressures of rising utility consumption and increased LNG exports.
Readers should also be aware that, thanks to the efficiencies enabled by the technological advances of horizontal drilling and fracking, U.S. natural gas supply is being adequately maintained with 10-20% (~125 rigs) of the 500 to 1200+ rigs that were once required.
https://www.eia.gov/dnav/ng/hist/e_ertrrg_xr0_nus_ca.htm
I couldn’t tell what spot price was being quoted. We saw up to $28 for SE Tx. We saw $50+ for Henry. We heard of $30+ with curtailments in north Texas. I didn’t look at anything in the NE US. Many issuances of OFOs and OBOs throughout, which impacts prices as well. On the downside of the event with demand subsiding prices remained elevated in double digits. February gas settled at $7.50. There’s lots of moving parts including the speculative aspect to this stuff. Uri gas prices in Texas basically met the cap on power prices… $9000/22 Heat rate = ~$400/mmbtu. Had Uri not been as bad as it was and the scrutiny that followed, a repeat of Uri prices any time for deep cold in the region would probably have been likely.