How the Federal Reserve Affects the Gold-Oil Relationship
By Vance Ginn -- August 24, 2012After oil and gasoline prices continued their relentless march up earlier this year, it was nice to have some relief at the pump in May and June. However, since the end of June, prices of WTI crude oil is up over 15%, Brent crude oil is up about 25%, and retail gasoline is up over 7%. Oil and gasoline prices reached three-month highs last week and the Energy Information Administration (EIA) increased their 2012 forecasts of these prices.
There is no doubt that these higher prices will grab the attention of news outlets, policy makers, and the public. With this increased attention, political rhetoric regarding fantasies of governmental regulations and market manipulations will likely reemerge as catalysts to lower these prices.
The less likely scenario is increased awareness on the impacts that central banks, particularly the Federal Reserve, have on these petroleum prices by changes in the money supply. Over the period of this substantial rise in petroleum prices, central banks around the world have taken action from the dismal economic outlook in many global regions.
The U.S. GDP growth rate of only 1.5% in the 2nd quarter of 2012 and unemployment rate of 8.3% in July concern the Fed about economic stability, and several Fed governors recently called for additional quantitative easing measures—purchase of long-term bonds by printing more money. Although the Dallas Federal Reserve Bank President Richard Fisher opposes these additional measures (there are few marginal benefits versus costs), I examine the costs of monetary easing policy based on the relationship between gold and oil prices.
One measure of aggregate money supply, M1—includes currency and demand deposits, increased by 4% since late June. In addition, petroleum prices increased (see above) and the price of gold is up by 2.7% over this period. If there was a direct relationship between the prices of gold and oil, commodity traders, entrepreneurs, and the Fed could benefit from knowing this relationship to forecast the future spot price of oil. A recent article in the Washington Times outlines a direct relationship between these commodity prices and provides a simple calculation to forecast the price of oil with the price of gold.
Here is the statistical relationship found by the author of the article:
“Downloading daily gold and West Texas oil price data from readily available sources, one can perform a calculation to estimate the price of oil based on the price of gold. For example, if the price of gold for the given day is $326.30, multiply that number by .0602 ounces of gold to get a value of $19.643 per barrel…On a sample of daily interval data from January 2, 1986 to March 3, 2012 (6,457 matching intervals), using basic statistics, a 2-sample t test was performed and the results are eye-opening…We can say that .0602 ounces of gold times the price of gold produces the price of a barrel of oil, with a standard error of just .421%, or an average difference of just $6.10 dollars between the calculated price and the actual price since 1986. For the last 26 years, the price of gold dictated the price of oil with 99.579 percent accuracy.”
Although historically there have been periods when this may be true, Figure 1 illustrates that there are many periods since 1986 when the movements of these prices diverged and were not positively correlated.
Figure 1: Gold and Oil Prices Historical Relationship
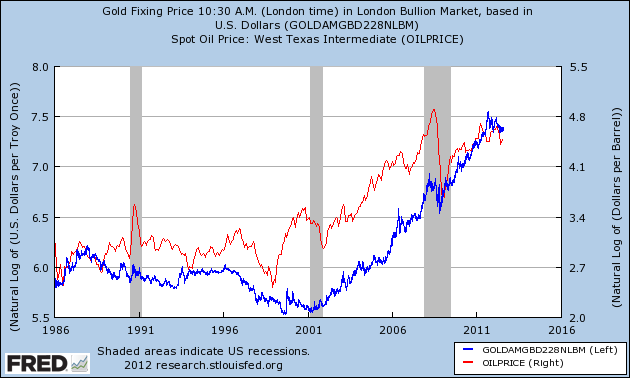
Source: Fed FRED
Since these values in Figure 1 are in logs, the change between two periods is the percentage change. If no other market fundamentals affected these prices except for the value of the dollar, considering that both commodities are priced in dollars, then these two should fluctuate closely together. Clearly, these prices do not always move in tandem. Moreover, correlation does not prove causation, as the author of the article seems to suggest. In other words, it is possible that the price of oil causes movements in the price of gold. The data indicate there is a relationship between the two, but there are many times when this link is not as strong. Since these prices are measured in dollars and in the long run, however long that may be, they should revert to an average relationship. The article notes this relationship to be “.0602 ounces of gold times the price of gold produces the price of a barrel of oil”.
Using this simple calculation with the price of gold closing at $1,623 per ounce last Friday, then multiplying this price by .0602 provides an oil price of $97.70 per barrel. However, oil closed at $93.39 per barrel that day. This $4.31 difference between the projected and actual oil prices indicates that there are other oil market fundamentals at work.
Economic research indicates that the fundamentals of supply and demand in the oil market are important to understand for short run and long run fluctuations. In particular, these fundamental changes allow more pricing information for entrepreneurs to decide which investments are profitable. Moreover, the primary source of oil price fluctuations are not from financial speculation but from oil supply, oil demand, or precautionary oil demand—expected oil supply disruptions, such as the concern about a disturbance in Iran’s oil production—can lead to significantly different economic effects.
Oil supply constraints from the bottlenecks in Cushing, OK, have certainly had an impact on the Brent and WTI prices of oil. Furthermore, this divergence between these two oil prices since early 2011 appears to have changed the relationship with these oil prices and the price of gasoline as well. Before 2011 when these oil prices typically moved lockstep with one another, either of these oil prices could be used to fairly predict the future gasoline price. However, the Brent oil price has been the better indicator of the gas price since last spring, which is around the time of the Arab Spring and supply constraints in Cushing began. With this change, Economist James Hamilton provides a simple forecasting model to predict the price of retail gasoline from the Brent price, which using Friday’s closing price of $113.03 forecasts the national average price of gas of $3.66 compared with Friday’s actual average of $3.675. In my research, the ability of spot and futures prices of oil prices to forecast the gas price has not predicted the future gasoline price better than the gas futures price during different periods of gas price volatility. However, my research did not include the Brent oil price and this is a key research that should be explored.
Although historically there are several oil price spikes from oil supply disturbances, these disruptions are typically short-lived because of production changes around the globe to profit from price changes. However, aggregate demand shocks, such as from China and India during the 2000s, last longer. In my research, I find that a global demand for oil shock, represented by a real global economic activity measure that reflects global demand for commodities, has significantly greater U.S. economic effects on the unemployment rate, real GDP growth, and the inflation rate than other oil market disturbances.
These caveats bring me back to my main point of what impact the Fed has on commodity prices because other central banks tend to follow the Fed’s actions and these actions impact the global demand for oil. In particular, this synchronization of monetary policies would affect the value of the dollar—reflected by the price of gold—and change relative prices, which change U.S. economic variables that are not reflected by only oil price fluctuations. Simply, the price of oil does not matter much. The sources of oil price movements are what matters. In addition, the Fed’s contribution to these underlying causes from its impact on gold, the U.S. dollar, and global demand for oil also change the macroeconomic effects of an oil price shock.
As noted in the Washington Times article above, the author’s simple gold-oil price calculation was wildly off over time. Nominal commodity prices, like all nominal prices, are subject to wild swings that are dependent on a number of variables. What we should focus on are real prices. Therefore, the price of gold gives a valuation of the value of the dollar and provides an indication of the price of oil, all else constant, but it is not perfect. Oil market fundamentals are helpful in determining what is driving the price of oil.
However, these underlying causes of oil price fluctuations may be determined by Fed policies from flows of newly printed dollars into different investments. The Fed distorts interest rates when their policies do not reflect market fundamentals in the loanable funds market. Specifically, the Fed’s discretionary policies of purchasing government bonds and creating artificial bond prices that do not reflect supply and demand in the loanable funds market distort the allocation of resources to different maturating assets. This creates malinvestments along the production process. When we think about how government policies impact gold and oil prices, we must consider those from the Federal Reserve. I look forward to your comments.
There is a typo in paragraph “These caveats bring me”- specifically “-reflected reflected by the price of gold-”
On topic, is the delay between when the fed changes interest rates and the price of oil and gas change what you’d expect from a change in investment or is the delay shorter suggesting the change in the money supply itself is the cause?
I believe it was Mises who said that a mathematical relationship between two variables in economics could be a description of history, but not a predictive model for the future. I immeadiately thought of that when I heard someone talking about regression coefficient (or something like it) to convert the price of oil to gold and vice versa.
Well, anyway:
“Nominal commodity prices, like all nominal prices, are subject to wild swings that are dependent on a number of variables. What we should focus on are real prices.”
The tricky thing with calculating the “real” prices of things is what indicator of inflation (or deflation) to use to back out “value of the dollar effects” out of prices. This can be used and abused. For instance, notorious leftist Robert Reich likes to claim that inflation adjusted wages have been flat for decades. This, however, is a claim that is dependent on using one measure of inflation over the period-if other indices are used the claim just vanishes. Personally, I think there is a lot more information to be gained by asking questions about individual hypothetical “trades” at every point in time (with the dollar as the “middle man” of course). In such and such year, how many barrels of oil could I purchase for the money I’d get selling some number of ounces of gold, or bushels of grain etc. and it would be interesting to look at these “commodity ratios” one at a time. Of course, that would still only inform about the historical, relative behavior of the markets for any pair of commodities, but it would be interesting.
It appears that in recent history, the price of oil has been “volatile” relative to gold, which supports, I think, the belief that gold is more of an indicator of confidence in the dollar and/or it’s value while oil is, of course, subject to changes in demand that do not directly depend on the same.
Following many years of net annual sales in the 400 to 500 tonne range, central banks, under weighted in gold and overweight in dollars and euros, became net buyers of gold in 2009 – in 2002 central banks sold 545 tonnes of gold, in 2011 they bought 440 tonnes.
“Central banks continued to buy gold; net purchases recorded during the first quarter, 2012 amounted to 80.8 tonnes, accounting for around 7% of global gold demand. Central banks from a diverse group of countries added to the overall holdings of the official sector, with a number of banks making sizable purchases.
After having already purchased ten tonnes of gold so far this year, the National Bank of Kazakhstan said it plans to purchase an additional fifteen tonnes this year and as much as seventy tonnes per year in 2013 and beyond.
“Nineteen fifty-eight marked the first year in which foreign central banks exercised their convertibility rights in significant amounts and returned their dollars for gold. US gold reserves fell 10% from 20,312 metric tons to 18,290 that year. The US made it abundantly clear stopping the drain of its gold reserves, and the depreciation of its currency against gold, was a huge priority. Ultimately ir removed the right to exchange dollars for Gold
Since 1913 the US dollar has lost over 95% of its purchasing power while gold has gone from US$20 an ounce to currently over US$1600.00 per ounce in the same time frame When people catch onto the fact that all government statistics are so massaged as to be useless, and actually start to think about how much more they are paying today over yesterday for the necessary everyday items they need to get by, than they will start to understand why gold is so important to a sound monetary system Continuing low interest rates, combined with higher inflation rates will equal low to negative real rates of return causing continued demand for gold which is being bought with dollars. The world’s continues to dispose of dollars and buy gold. China has imported more gold in six months than Portugal’s entire gold reserves
China continues to do one thing. Buy. Because while earlier today we were wondering (rhetorically, of course) what China is doing with all that excess trade surplus if it is not recycling it back into Treasury’s, now we once again find out that instead of purchasing US paper, Beijing continues to buy non-US gold, in the form of 68 tons in imports from Hong Kong in the month of June. The year to date total (6 months)? 383 tons. In other words, in half a year China, whose official total tally is still a massively underrepresented 1054 tons, has imported more gold than the official gold reserves of Portugal, Venezuela, Saudi Arabia, the UK, and so on, and whose YTD imports alone make it the 14th largest holder of gold in the world. Realistically, by now China, which hasn’t provided an honest gold reserve holdings update to the IMF in years, most certainly has more gold than the IMF, and its 2814 tons, itself. Of course, the moment the PBOC does announce its official updated gold stash, a gold price in the mid-$1000 range will be a long gone memory.
Here is the latest breakdown of gold reserves by Top 20 countries via the WGC:
World Offical Gold Holding
1 United States ( down from 18,290 mtins in 1958) to 8,135.5 tonnes
2 German 3,395.5
4 Italy 2,814.0
5 China 1,054.1
6Switzerland 1,040.1
7 Russia 918.0
9 Japan 765.2
10 Netherlands 612.5
11 India 557.7
12 ECB 502.1
13 Taiwan 422.7
14 Portugal 382.5
15 Venezuela 365.8
16 Saudi Arabia 322.9
17 United Kingdom 310.3
18 Lebanon 286.8
19 Spain 281.6
20 Austria 280.0
The traditional unit of weight for precious metals and gems.
1 troy ounce = 480 grains
1 troy ounce = 24 scruples
1 troy ounce = 20 pennyweights (North American jewelery trade)
1 troy ounce = 1.097 ordinary ounce
1 troy ounce = 8 drams
1 troy ounce = 31.1034768 grams.
1 troy ounce = 120 carats
1 troy ounce = 155.52 metric carats (diamonds / precious stones).
3.75 troy ounces = 10 tolas (Indian sub-continent)
6.02 troy ounces = 5 taels (Hong Kong)
12 troy ounce=1 troy pound
14.583 troy ounce =16 avoirdupois ounce (1Pound)
32.15 troy ounces = 1 kilogramme (Kilo)
32,150 troy ounces = 1 metric ton (1,000 kilos)
Ar prsent gold prices each ton is worth about 19 billion dollars
total gold value $152 billion total debt in2010 of US $202 Trillion value of current dolars to exchange for gold backd dollars , One new gold dollar for every206 excisting Fed Fderal reserve notes
The world continues to sell Dollars and convert them into gold to escape the inflation caused by QE
If Congress won’t abolish the Fed. The world might abolish the dollar