Peeling Away the Onion of Denmark Wind (Part IV – CO2 Emissions)
By Kent Hawkins -- October 29, 2010[Editor’s note: Parts I-III provided insight into the complexities involved in any analysis of the Danish electricity system, showing (1) how unique the Denmark situation is, (2) that the details of electricity exports and imports must be understood for each of Denmark’s trading partners, (3) the likelihood that most of Denmark’s wind production is exported, and (4) an indication that the upper limit for manageable wind penetration is in the mid-single digits as a percent of domestic demand. Part IV now looks at the impact on CO2 emissions.]
Figure 1 is a simple look at CO2 emissions and wind electricity production, which explains the claims made by wind proponents based on a superficial examination of the information. Figure 1 shows what the Danish Energy Agency (DEA) reports based on an “adjustment” of actual CO2 emissions. 2007 was a windy year and 2006 was a notably low wind year.
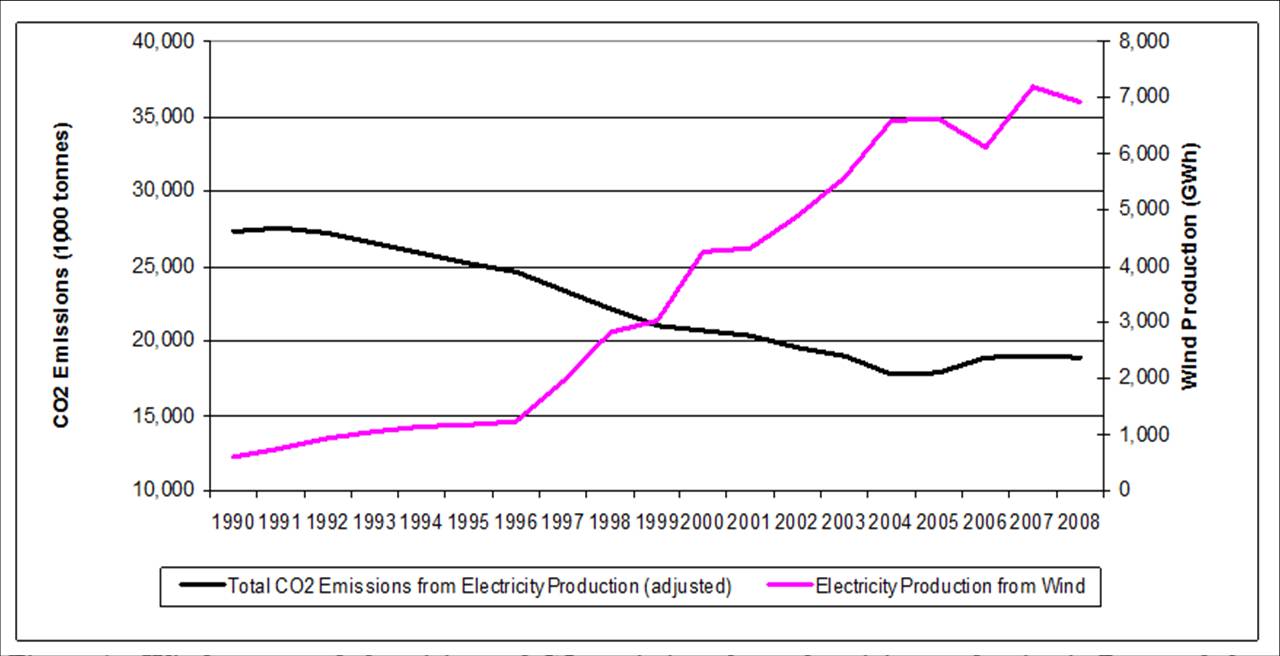
Figure 1 – Wind-generated electricity and CO2 emissions from electricity production in Denmark for the period 1990-2008. 1990 is the base year for Kyoto performance measurement. CO2 emissions are adjusted based on net exports of electricity.
This looks convincing on the surface, but is not substantiated by closer examination. There are many reasons not to look to the relationship between wind electricity production, or any electricity production, and CO2 emissions as evidence of cause and effect, and these will be covered later.
But first, it is important to understand what the actual (or “observed” using the DEA terminology) CO2 emissions in Denmark are before “adjustment”. Even in this case, it must be remembered that emissions are not actually measured but are calculated using algorithms based on assumptions. Keep this in mind in connection with other considerations covered below.
The point is that Figure 1 does not show the actual CO2 emissions from electricity generation within Denmark because the DEA takes credit for net exports of electricity.[1] Figure 2 is Figure 1 restated using actual CO2 emissions.
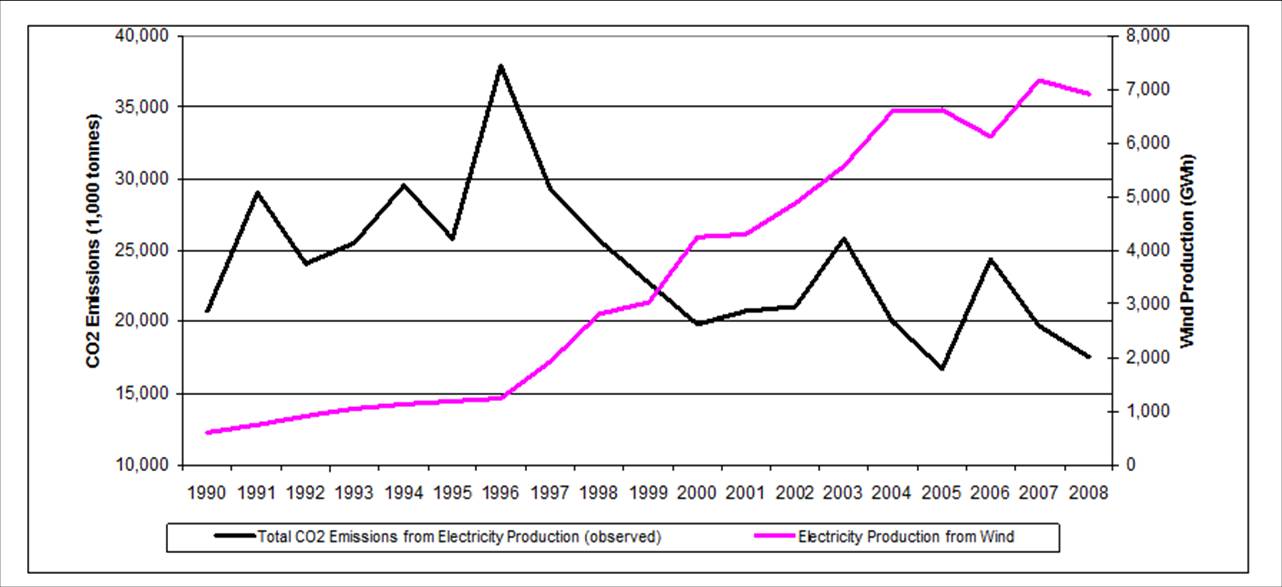
Figure 2 –Actual CO2 emissions from electricity generation and wind electricity generation. This removes the adjustment to CO2 emissions for the net exports of electricity.
There is still a downward trend in CO2 emissions, but less consistent and dramatic than shown in Figure 1. The reduction from the peak in 1996 was due to the significant reduction in fossil-fuel generated electricity exports, as shown in Part I, Figure 3. So, choosing any specific year as the basis of comparison to 1990 (Kyoto reference point) could be used to show different performance levels. For example look at 2006 (18% increase) and 2007 (5% decrease) in Figure 2. Also note the significantly higher “adjusted” base year (1990) levels in Figure 1. The percentage reduction in 2008 over 1990 is 31% for the “adjusted” emissions, and 15% for the observed emissions. Significant reductions occurred over the period 1996 to 2008, breaking an upward trend, with the greater use of natural gas as shown in Part I Figure 2. As well, Denmark has a strong energy efficiency record.
Actual emissions show significant year-over-year variations, and are not strongly correlated with wind generation. Figure 3 further illustrates this by looking at the year-over-year changes in wind generation of electricity and CO2 emissions. Although wind may have made some contribution with the availability of significant hydro resources for balancing, there are other, likely greater factors involved in the annual CO2 emissions levels, for example (some of which may overlap):
- Changes in imports and exports
- Changes in fuel types used each year, such as more or less gas versus coal
- Changes in plant use due to maintenance or dispatch experience
- Changes in plants, such as upgrades, or introduction of new plants
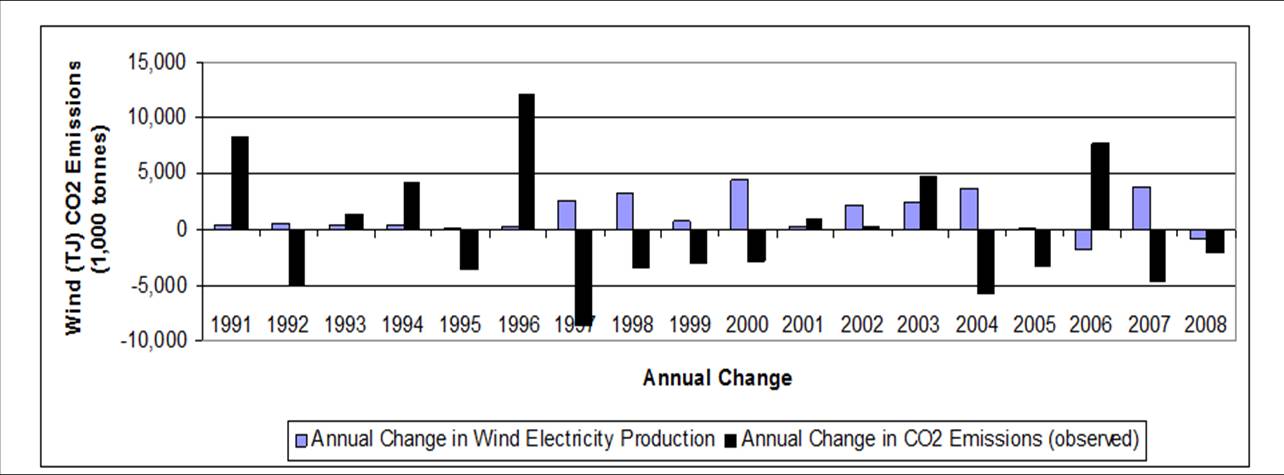
Figure 3 – Annual changes in wind electricity production and CO2 emissions. Note the absence of correlation.
For 8 of the 18 years, CO2 emissions do not change in opposition to changes in wind production. In the years that they did, the relative amounts varied considerably.
Why Adjustments to CO2 Emissions are Inappropriate
The DEA adjusts CO2 emissions depending on net exports/imports of electricity. In years of net exports, exported electricity is considered the export of CO2 emissions (fossil fuel produced) or CO2 emissions savings (wind produced). In years of net imports it is considered to be the import of CO2 emissions (fossil fuel).
The DEA does state that the adjusted CO2 emissions are not to be taken into account, except for some limited purposes.[2] However the reporting of adjusted numbers, which are quite prominently used throughout the report, compared to the above referenced clarification note, can be used mistakenly to attribute better performance than is real. The following illustrates the limited applicability of adjusted numbers for Denmark:
- The export of fossil fuel generation, and associated CO2 emissions, will not likely be taken as an upward adjustment by the receiving country, so the CO2 emissions that occurred on the production side will be “lost” in the total accounting.
- With the export of wind-generated electricity, and presumed reduction in CO2 emissions, the receiving country already has reduced some other electricity production, and the effect on CO2 emissions has already been taken into account. Further complicating this is the effect of wind production on any balancing needed by fossil fuel generation in either country that is not properly accounted for in their calculations of CO2 emissions.
- The exported wind-generated electricity to Norway/Sweden is displacing hydro and there are no CO2 emissions to be saved as a result.
- If it is assumed that the electricity exported to Norway/Sweden is fossil-fuel generated, it is displacing non-CO2 producing hydro.
The Balancing of Wind Consumed in Denmark
The other consideration is the effect of the wind that is consumed within Denmark. There seems to be the opinion that this is balanced by Norway/Sweden hydro. I suspect that this is only partially true, because balancing energy must fill the gaps in wind production over most of the range of wind capacity. This means about 3 times the wind production is required for wind balancing to provide “firm” supply. The sample years in Part III showed, based on hydro imports, this to be the most possible in wet years (2000, 2005, 2007 and 2008) and least possible in dry years (2003 and 2006).
Figure 4 shows the fossil fuel plant fleet efficiencies versus electricity CO2 emissions. Note that in the dry years the coal plant efficiencies fell, particularly in 2003, an especially dry year, and CO2 emissions spiked up. This is less obvious in 2006 from a plant efficiency point of view, but the continuation of the downtrend into 2007 (a wet year) can be explained by follow-on effects from 2006 conditions. Note also the general downward trend in coal plant fleet efficiency since the steady increase in wind production started in the latter part of the 1990’s.
Gas plants seem less affected, but the gas fleet efficiency tends to fall in wet years, when wind exports to Norway/Sweden are lowest. A possible explanation is that “firmed” wind is exported to Germany. Firming can be provided by hydro, but with the relatively high levels of internal consumption of wind, gas plants may be called upon to a greater degree than otherwise for this purpose. The gas plant fleet efficiency peaks noticeably in 2006, a dry year, which could be explained by a number of considerations: the end of new plant implementations, more prolonged periods of use, including participating in fossil fuel electricity exports to Germany as suggested in Part III.
Le Pair and de Groot show that small reductions in fossil-fuel plant fleet efficiencies represent notable efficiency losses in those performing wind balancing.
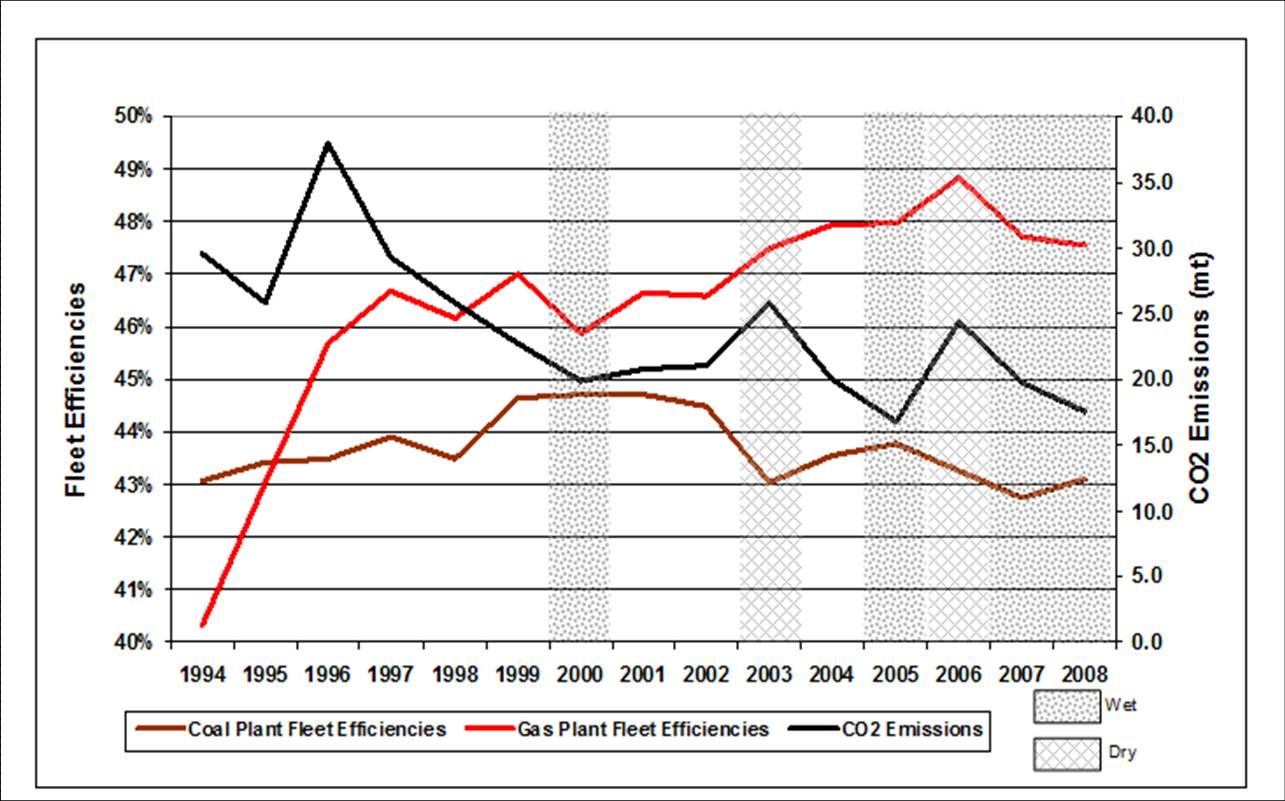
Figure 4 – Fossil fuel plant fleet efficiencies versus CO2 emissions from electricity production.
As explained in Part I, more than 50% of the CHP plant production is not heat and electricity combined, but electricity alone. It looks like coal plants are involved in some wind balancing within Denmark. In this case, the increases will offset the gains at the point of wind plant production. The downward trend in coal plant fleet efficiencies could be showing the impact of wind balancing in all years but to a lesser degree than in dry years. This means, in the absence of balancing hydro from Norway/Sweden, that the actual CO2 emissions for Denmark would be in the range of the 2003 and 2006 peaks, which could be about 25 million tonnes in 2008, versus about 21 million tonnes in 1990.
CO2 Emissions Savings from Wind
The best case for CO2 emissions savings as the result of wind production actually used in Denmark is if this is totally balanced by hydro from Norway/Sweden. This appears not to be the case, but the actual amount is not easily determined because of the many considerations involved, including the amount of wind used in Denmark, the split between Denmark and Germany of hydro from Norway/Sweden and the split within Denmark between hydro- and fossil-fuel balancing of wind.
CEPOS calculates the cost of using wind power to save CO2 emissions to be $124 (€ 87) per tonne, presumably depending primarily on hydro balancing, which is expensive compared to the value of emissions allowances traded on the European emissions trading scheme (ETS) which varied from € 1 to € 30 per tonne of CO2. Factoring in increased CO2 emissions from any fossil fuel plants used for wind balancing could add to these costs.
Is there a better way for Denmark to reduce CO2 emissions?
Do Norway and Sweden Provide Storage for Danish Wind?
Wind proponents claim that Denmark exports wind-generated electricity to Norway and Sweden and later imports this when needed. In effect Nordic water reservoirs provide storage, which is true. However in this exchange, Denmark receives little value for its exported wind, pays market prices for imports, and incurs transmission losses in both directions. Add to this imbalance that Denmark has paid heavily for its wind plants and the conclusion is easily reached that Denmark would have been better off financially, and operationally, not implementing wind plants and importing Nordic hydro-electricity when needed.
The savings in CO2 emissions would have been the same, and only because of the presence of the large hydro-generation plants in Norway and Sweden.
The lesson for other countries is that Denmark’s unique circumstances allow (1) the high level of wind production in Denmark, (2) wind used domestically within Denmark, at about 5% of total electricity consumption, to make some small contribution to CO2 emissions reduction. Otherwise, with just fossil-fuel balancing resources, there is likely no emissions savings, and (3) Denmark does not enjoy any long term benefits in any other category.
For ease of navigation, the other posts in this series are:
Part I – Introduction
Part II – Details of Exports and Imports
Part III – Wind Electricity Used in Denmark
Part IV – CO2 Emissions (this post)
Endnotes
[1] Danish Energy Agency (DEA) (2008). “Energy Statistics 2008” http://www.ens.dk/en-US/Info/FactsAndFigures/Energy_statistics_and_indicators/Annual%20Statistics/Documents/Energy%20Statistics%202008.pdf. Page 38.
[2] Danish Energy Agency (DEA) (2008). “Energy Statistics 2008” http://www.ens.dk/en-US/Info/FactsAndFigures/Energy_statistics_and_indicators/Annual%20Statistics/Documents/Energy%20Statistics%202008.pdf. Page 39.
[…] Peeling Away the Onion of Denmark Wind (Part IV – CO2 Emissions) – MasterResource […]
Kent Hawkins continues his assault on the bastions of industrial wind technology, in this instance exposing wind’s sanctum sanctorum, Denmark, as a minor European electricity switching station between Scandinavia and Germany, with hydro dominating the scene. Here, Hawkins relies on the methods of science as a means of assessing the shibboleth that Danish wind has been so successful in reducing fossil fuel use and greenhouse gas emissions that it deserves emulation around the world. In the process, he demonstrates that science is not just a hatchery for technology; rather, it is the best means of accounting for the variables sufficient for explaining the proper relationship between cause and effect.
What Hawkins makes clear is how complicated and complex the situation is–between imports and exports, weather factors, fuel mix considerations, plant efficiencies, electricity rates, economic health, among many others. Still, his larger point is correct: without the huge reservoirs of Scandinavian hydro, which dwarf supplies of Danish wind, and the sophisticated interconnections among the countries involved, Denmark could never absorb all its wind, which today accounts for about 20% of its total generation.
Consequently, Denmark’s wind situation is sui generis, and cannot be a model for others. If Denmark did not have the Scandinavian “sink” in which to dump its considerable excess wind, and if that sink did not have hydro, which produces relatively little CO2 emissions, as its principle source of power, Denmark would not only be awash in both carbon dioxide emissions AND wind turbines in the production of electricity; it would also have dysfunctional electricity.
Hawkins’ analysis shows that correlation should not be confused with causation–that reductions in fossil fuel use and CO2 emissions are not ineluctably caused by increases in wind generation. There are many other factors at work, most of which are more likely causal, particularly as they work together. Denmark has achieved about a 6% overall reduction in fossil fuel use since 1990, with a decrease in coal use because of a substantial increase in natural gas usage (-40% coal; +125% ng), combined with the building of much more efficient coal fired CHPs units. It also imports substantial Scandinavian hydro, which is used to firm at least some of the wind volatility that is used internally. At the same time, the current economic meltdown has created a temporary decline in demand, so that slightly less supply is needed.
He also makes the case that most Danish wind is exported, either to Scandinavia or Germany, with the amounts varying with weather conditions. Moreover, his speculation about how much wind is actually used for Denmark’s internal consumption seems informed, even conservative. I would hope that CEPO’s principal author, Hugh Sharman, would comment about this, along with Bach.
Another helpful point of inquiry is Hawkins’ exploration of the wind firming role of fossil-fired plants within Denmark, since hydro evidently is not doing all the work. It seems reasonable to conclude that wind volatility plays an important role in diminishing the efficiencies of both coal and natural gas units, in the process increasing heat rate penalties that unleash even more CO2 emissions. Consequently, it may be that all that Danish wind, as it affects internal electricity consumption, may be responsible for producing more greenhouse gas emissions than would be the case if there was no wind at all. Wouldn’t that be a kick, given the billions of dollars in public subsidies wrested from the public in the name of saving the planet from a surfeit of CO2!?
As Vestas, et al invade the US in a determined campaign to find a buyer for its wares, since the Danish onshore market has dried up (even with all that hydro), policy makers and their assorted wonks should read Kent Hawkins’ sobering caveat emptor.
Bertrand Russell~ Man needs for his happiness not only the enjoyment of this or that but hope and enterprise and change.
(The comment is incomplete as figures are not accepted.)
The analysis of mr Hawkins is correct about the facts and figures and especially his rejection of corrections of imports and exports is quite correct.
One wants to look at electricity production in Denmark without any further fuzz.
Still I start with a corrected graph which is often used to illustrate the success of the energy policy in Denmark .
(graph showing the CO2 in fuel and the CO2/Kwh)
At first sight the graph seems conclusive: the Danes have done the right thing as the CO2 per KWh (consumed) decreased from 920 g to 580 g/KWh.
The blue line shows the real reason for the success: In the period 1990 to 2005 coal was gradually replaced by natural gas and biofuel. Further were nearly all generating units equipped as CHP units.
The red line shows the decrease in emissions due to this this effort.
The bulk of Danish wind energy was introduced in the period 1996 to 2004.
The effect of it is contrary to the expected effect: from 1999 the red line starts to deviate upwards instead of downwards from the trend given by the fuel mix.
Looking into details of this I came also across the data of the fuel efficiencies as given by mr Hawkins in figure 4 above. My conclusions are different.
During the upheaval of the electricity supply in Denmark in the period 1990 to 2004 no noticeable change was recorded in the efficiency of the coal plants. The number can be summarized as 43,5% +/_ 0,7% in this whole period.
This number is close to the maximum one can expect from coal units, but this maximum can only be reached at full load. The production from the coal units decreased nearly 50% in this period, so one should expect an influence on the fuel efficiency.
Nothing can be seen.
In the “Environmental Report 2010 of the same agency one finds on page 12:
” Total electricity efficiency of the thermal generation system was 32.4% in 2009, while the total efficiency (electricity and heat) for the thermal generation in Denmark was 68,4%. The figures represent an average for the total fuel efficiency.”
This looks more like the truth.
My conclusion is twofold:
a. The influence of introducing massively wind energy between 1996 and 2004 did not lead to a noticeable effect on CO2 output in Denmark.
b. The numbers given in the statistical tables need some close scrutiny.
Thank you for a very fine elucidation on wind-power in Denmark.
And, to keep proportions, take a look at this site where you will find a rough comparison on energy matters between Danish wind-power and Danish shipping.
http://ralph-sylvestersen.blogspot.com/
.
Balancing/firming power should be accounted for directly and unequivocally to evaluate the full economics of wind power. It is not in the interests of wind proponents -free, clean energy – to do this. Balancing wind with hydro is the only 100% clean option. Is it possible to build enough hydro to balance all EU wind?
Let me attempt a fairly simple answer. Hydro typically is not available to balance wind. The Denmark/Norway/Sweden case is very unique because of Norway and Sweden terrain and natural hydro resources. Even so they cannot take increasing amounts of Danish wind. Read the parts of this post series on wet/dry years. In wet years when reservoirs are full they cannot take as much Danish wind as in dry years. There are many other factors regarding using hydro to balance wind. One of them (and the US Pacific Northwest encounters this is during high wind periods), excess water must be released from behind dams which upsets downstream ecosystems.
The generation source balancing wind is what wind is displacing. Why displace one non-emissions producing renewable with another at duplicate cost?
It is not easy to substantially increase hydro generation world-wide. The permitting process and environmentalist objections are major obstacles to overcome. Check out the recent efforts by China in building large hydro-electricity power plants. In terms of land use in electricity provision (e.g. that required for fuel production and transportation, transmission lines and electricity plants), the largest by far is the land occupied by water reservoirs behind dams.
The simple answer to your question is that it just is not possible, and it is not desirable anyway.
The IEA has graphs on energy use by country. Here’s Denmark:
http://www.iea.org/stats/pdf_graphs/DKTPES.pdf
As we can see, almost all the energy substitution is in natural gas and waste/biofuels. Wind barely shows up at all.
The reduction in CO2 emissions is, therefore, almost completely due to natural gas and burning trash.
That’s shocking.
Thanks for your comment. I agree with your views, but am compelled to point out that the chart you refer to is for total primary energy use in Denmark, for example its use in transportation, heating, industry etc. This post looks only at the primary energy sources used in electricity generation.