Subsidizing CO2 Emissions via Windpower: The Ultimate Irony
By Kent Hawkins -- June 10, 2010It is the irony of ironies. Taxpayer and ratepayer-forced subsidies for utility-scale windpower also subsidizes emissions of carbon dioxide (CO2). The same would be true under a national renewable portfolio standard as proposed in pending federal legislation.
Such is a vivid demonstration of the perils of unintended consequences and, to borrow a phrase, “an inconvenient truth” about wind power.
My recent four-part Wind Integration Realities reviewed two new studies, based on actual experience, that show fossil fuel consumption and CO2 emissions areincreased, not reduced, with the introduction of wind. Their results were compared as well as to those of my fossil fuel and CO2 emissions calculator for the same conditions. The brief summary in Part IV of the series is expanded upon here for clarity of this game-changing argument.
In general, the studies show that as wind penetration increases, the effect on fossil fuel and CO2 emissions worsens. Specifically, at wind penetrations of about 3% (as is the case in the Netherlands), the savings are zero. At 5-6% (as for Colorado and Texas) the “savings” become negative, that is, emissions actually increase due to the presence of wind power.
Details of the Three Jurisdictions Studied
The two studies, covering three jurisdictions, the Netherlands, Colorado and Texas, provide a good range of electricity system size and fuel mix, and wind implementation, penetration and capacity factor. In the Netherlands gas predominates, whereas in Colorado coal does. Texas shows approximately equal contribution between the two, with gas exceeding coal by about 30% when CHP (Combined Heat and Power) plants are included.
Table 1 is an expanded version of the table provided in Part IV, summarizing the important details and the results of the three analytical approaches used, which are:
· The le Pair and de Groot study for the Netherlands
· The Bentek Energy study for Colorado and Texas
· The results from my calculator for these jurisdictions
Table 1 – Summary of the Three Approaches Analyzed in this Series
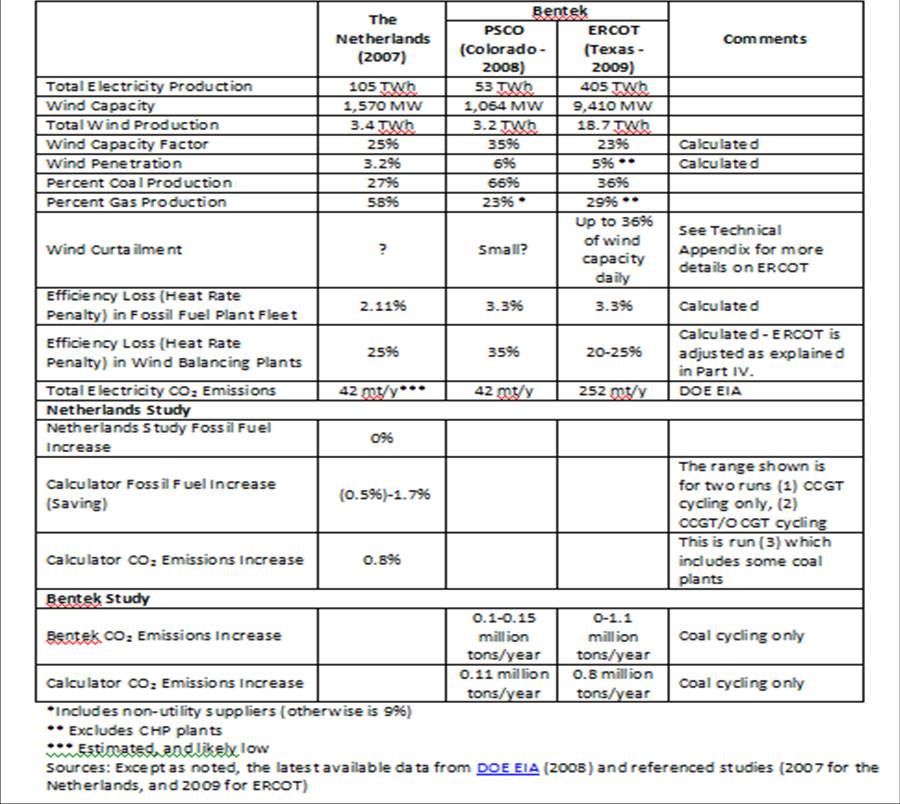
Figure 1 shows the CO2 emissions savings based on two approaches to the replacement of a portion of the coal plants in all three jurisdictions.
1. Introduce wind plants, which produce no CO2 emissions at the point of wind electricity generation.
2. Do not introduce wind and use efficient gas plants (CCGT) to replace coal production.
For comparison purposes, the wind plant capacity is used as a reference point. Wind production is based on the average wind production over a year. Production from other energy sources (coal and gas here) used in the comparison is the wind production at 100% of capacity minus the wind average over a year. This is a useful basis for comparison, because in real-time wind can vary over the full range of its capacity. The sum of these two is the coal plant production being displaced.
Figure 1 – Comparison of Results
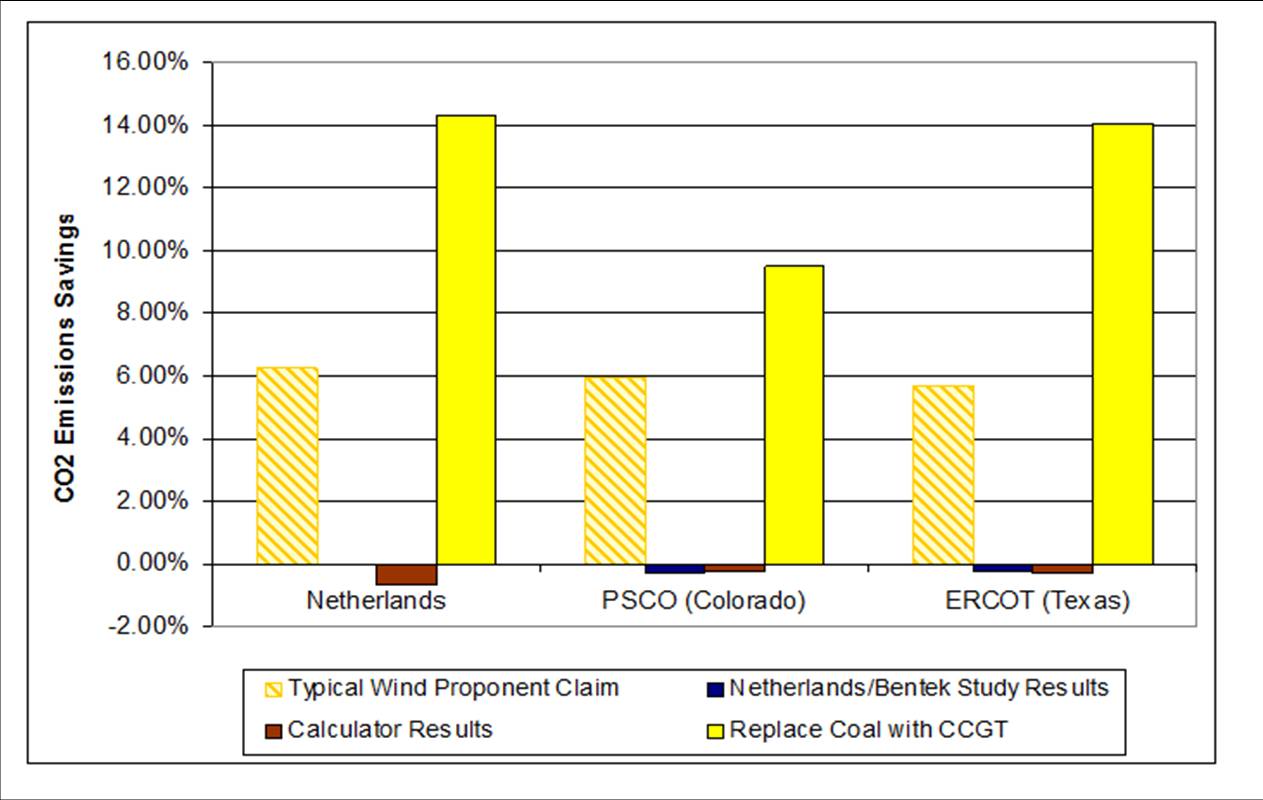
The CO2 emissions savings shown are percentages of the total emissions for the electricity system. Percentages will increase (further positively and negatively) for higher wind implementations, and in the case of replacing coal with gas for higher implementations of gas plants.
The four columns in each case represent:
· Column One – The typical wind proponent claim Their view is that the average wind production over time replaces the CO2 emissions from the same production of the coal plant(s). This view ignores the loss in efficiency (resulting in increased fossil fuel consumption and CO2 emissions) for the plants that are frequently cycled up and down to mirror wind’s highly variable, real-time production. It is purposely shown as somewhat washed out because it is not realizable. Column two shows the reality. It is coincidental that all are at about 6% of total emissions and is due to the combination of the specific wind capacity factors and the proportion of coal and wind in each jurisdiction.
· Column Two – Study results This shows the results based on actual experience in the three jurisdictions studied. The Netherlands result is zero. The mid-points of the ranges for PSCO and ERCOT were used.
· Column Three – Calculator results
· Column Four – High efficiency gas plants only This shows the result of not implementing wind and using high efficiency gas plants to replace the same coal production. The variation in percentage reductions in column four is due to the underlying proportion of coal and gas. Colorado has the highest reliance on coal and CO2 emissions are greater in proportion to the other two. As the result, the same level of reduction is less as a percentage.
No costs of CO2 mitigation are calculated because at the wind penetrations studied (greater than 3%) there is no reduction.
The two studies and calculator results demonstrate that claimed CO2 emissions are not reduced, but are increased, with the introduction of wind plants, and a straight substitution of gas for coal production is a far superior strategy. This is by no means the last word, as all three analysis approaches call for comprehensive and objective studies, based on complete information, to confirm these findings.
Technical Appendix
Point of Zero Fossil Fuel and Emissions Savings
The Netherlands study shows that the point where CO2 emissions overall become negative occurs at about 2% efficiency reduction across the fossil fuel fleet and corresponds to about 3% wind penetration. This is shown in Figure 2 which is reproduced from the Netherlands study. ?F is the change in fossil fuel consumption and ?R is the percent reduction in efficiency of the total fossil fuel fleet. [Here ? means the Greek letter delta meaning “change in”]
Figure 2 – Relationship Between Efficiency Loss (?R) and Fossil Fuel Savings (?F)
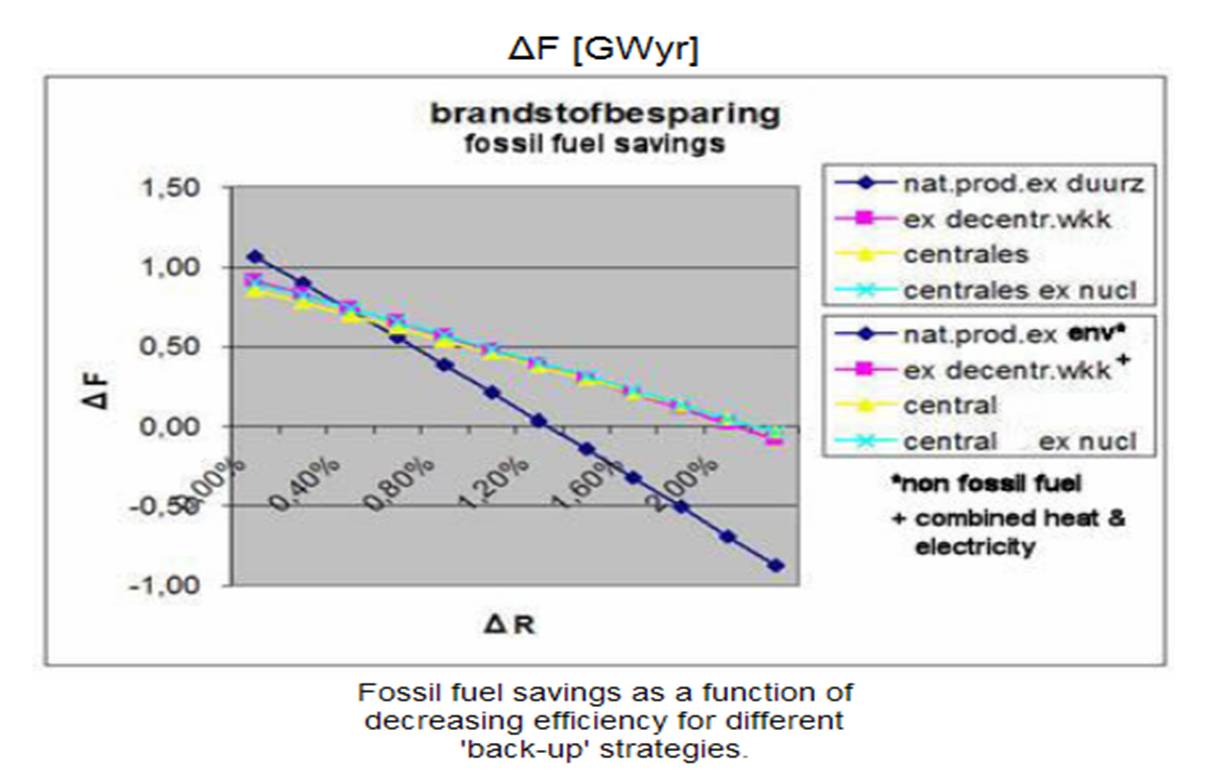
If the wind proponents are right and ?R is zero, then ?F is approximately 1.00 GWy. Therefore the fossil fuel consumption of 18.45 GWy as shown in Table 2 of the Netherlands study would be 18.45-1.00 = 17.45 GWy. That is to say, in theory the introduction of wind saves 1.00 GWy, but at ?R of 2% gives this back due to the inefficient operation of the fossil fuel plants. Therefore the typical wind proponent claim is that the 1.00 GWy would be saved and the percentage saving is about 1.00/17.45, or 5.7%. Compare this to the calculated wind proponent claim of 6.3% for the Netherlands in Figure 1.
However theoretically possible, this has been demonstrated by Colorado and Texas experience not to be the case. Further, increases in the efficiency loss for the fossil fuel fleet above 2% will result in increased fossil fuel consumption (negative ?F), and hence CO2 emissions, again as shown by the Colorado and Texas experience. Such increases in efficiency loss could be caused by:
- Increased wind penetration
- Increased wind volatility which may occur between jurisdictions and from year to year.
On the other hand decreases in efficiency loss could be caused by increased wind curtailment.
None of these considerations is supportive of the deployment of utility-scale wind plants, except in very small amounts, for whatever purpose that might serve.
ERCOT Wind Curtailment
Here is more detailed information on ERCOT wind curtailment as reported by the NREL:
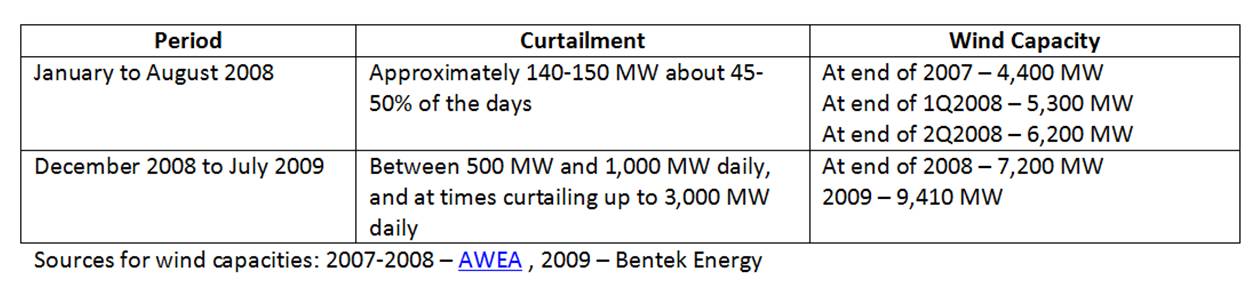
By mid-2009 (assuming the average of the year-end wind installations for 2008 and 2009) wind curtailment appears to be about 6-12% daily (500/8,420 and 1,000/8,420), and at times up to 36% daily (3,000/8,420). As wind curtailment is already widely used in Germany, and Texas has reached the same wind penetration, this is not surprising, and illustrates another “inconvenient truth” about utility-scale wind power. It is not clear why more curtailment is not reported for Colorado, given its stronger wind regime.
Again, this finding should be of paramount importance to policy makers and energy journalists. Chronological load dispatch analyses pegged at 15-minute intervals that measure the effects of wind penetration as it affects the overall thermal activity involved with wind integration should be mandatory. Indexing wind’s subsidies to actual measured reductions in CO2 emissions and fossil fuel use would put a quick end to this daffy industry.
But limited liability wind companies the world over–Denmark, Britain, Germany, The Netherlands, the USA, and Canada–hide wind performance behind claims of proprietary confidentiality. The Dragon in their Garage holds illimitable dominion over all. How convenient….
The entire CO2 debate is nonsense anyway, so whether wind power increases or decreases it is irrelevant. All of which brings us back to a common sense notion of “Let prices dictate demand and supply.” The world would make a lot more sense and we wouldn’t be wasting tax dollars at every opportunity. Yes, control for externalities (like unsightly windmills in your backyard) but let’s return to a world where we let markets work again instead of continually messing with them due to our beliefs in the latest “theories.”
[…] What?! Windpower INCREASES CO2 Emissions? […]
Rod,
The history of attempting to monetize environmental externalities reminds me of the question regarding how many angels can dance on the head of a pin.
California, at one time, had identified 3 separate externality costs for NOx: one for emissions within the LA Basin; one for emissions in the balance of the state; and, one for emissions out of state and thus largely downwind. I’ll let you guess at the relative cost levels.
How do you compare the externalities cost of a 3 MW wind turbine near your home and an extra 10 ppm of CO2 in the atmosphere? The process would produce great political theater. It would likely also produce far more heat than light.
The results in Ontario, Canada are little different.
Perhaps our “efficiency” is a little worse as the wind conditions are far from optimal.
Here is a PDF hosted on Wind Concerns Ontario:
http://windconcernsontario.wordpress.com/2010/03/22/watts-up-with-the-wind-in-ontario-2010/
It should give you a good idea of the situation here. IOW — the wind power industry is raking in subsidies and providing little or no value.
[…] […]
Thank you for an interesting read, Mr. Hawkins. I respect both your academic and employment histories.
Does your study permit predictions? Specifically , can you predict the effect (on CO2 emissions) of , say 15% , or 50%windpower generation in a market like those you cite/study?
Does your study indicate that these relations will ‘hold’ in long-term applications? I agree that the combine cycle gas cogeneration plants are the cheapest/fastest means to transition from coal … but most commenters here seem to implicitly think/feel that coal is ‘OK’.
So that wind critics are not accused of expecting adult behavior from an infant industry, Tom M suggests a necessary elaboration of the study–what of 15 or 50% windpower? Proponents who accept the negative CO2 correlation at 3% or 6% might well argue that as wind sources are more varied, reliability will increase.
A second question is whether breakthroughs in storage–fuel cells, batteries, flywheels, water, etc–would negate the effect wind power has on the efficiency of fossil fuel plants.
Tom,
You raise an interesting point. The Netherlands study reports on a jurisdiction that has 3% wind penetration (in energy terms for all electricity production) and the Bentek study, 5-6%. The calculator addresses the penetration in the range of 3-6% or more. Increased wind penetration introduces another significant variable, and I am now in the process of looking at this more closely, and this may change my results somewhat (but not in any material way). My view is that increasing wind beyond this level is not a practical possibility. Denmark has done this, but can do so because it exports the majority of its wind production to Norway/Sweden, which between them enjoys about 75% hydro-electric generation. The total generation in Denmark is tiny by comparison. This is another story and one that is not well-understood at all, although attempts (and I use the term advisedly) have been made to explain the Denmark situation.
Simply put my prediction for 15% (outside of the hard-to-duplicate Denmark/Norway/Sweden case) and 50% is that the electricity system will not withstand it, so it is an academic exercise. I will respond to Wallace’s comment separately.
To illustrate, take the Netherlands study. At 25% wind penetration, wind balancing would in combination with wind be equal to the 2007 fossil fuel fleet production. Try to imagine for one moment how this balancing act would be accomplished. At 50% wind penetration, fossil fuel production 50% greater than the 2007 level would be required. Imagine the increased fuel consumption and CO2 emissions. The reason for this is that the fossil fuel production to balance wind has to accommodate wind operating from 0-100% of its capacity. For more on this see the work of Katzenstein & Apt of Carnegie Mellon University.
I’m not sure what you mean by “…long-term applications.” I avoid picking winners in the long-term, although the world seems full of people who do. For my long-term views see http://www.masterresource.org/2010/03/integrating-renewables-have-policy-makers-faced-the-realities/ . Read the full USAEE article to which a link is provided.
Wallace,
I absolutely expect any industry to exhibit mature behaviour that makes claims that the wind industry does and, more importantly, claims to large amounts of national treasure.
The argument that more wind reduces reliability has been adequately dealt with elsewhere. It does not, except in the imaginations and pronouncements of wind proponents. Negative correlation is a rare occurrence, although correlation approaching zero (from positive values) as separation increases does happen.
There is no foreseeable breakthrough at the utility-scale in any of the categories that you mention. Given that wind plants can be implemented relatively quickly, such considerations are arguments for delay in implementing wind power.
The notion that wind technology is an infant industry is one cultivated by wind disinformation jockeys. But it does not correspond with reality. Wind has been at the public trough in the USA for over forty years–and has been a mainstay in the energy to power business for millennia.
Yes, improvements in metallurgy and civil engineering have allowed the idea to have a modern renaissance–but only because the culture has become scientifically illiterate: the basic physics hasn’t changed, not can it. A large turbine remains captive to its source of energy, and can convert energy to power as a function of the cube of the wind speed. Small changes in wind velocity result in substantial changes in wind energy yield. And it’s effects of the relentless wind variability that Kent Hawkins’ calculator is really measuring.
[…] 1: Wind power does not reduce CO2 emissions: http://www.masterresource.org/2010/06/subsidizing-co2-emissions/ This entry was posted in Renewable energy. Bookmark the permalink. ← Electric refueling: […]
Interesting analysis, Kent. I’d argue, however, that the problem in part isour reliance on 1950s style fossil fuel power plants that are ill-equiped to accommodate wind energy effectively. It is my understanding than newer natural gas plants are able to better match wind. In addition, pumped storage facilities are being installed near wind farms to allow them to provide a constant load. Finally, I wonder if part of this problem is due to antiquated grid systems; a grid with ample wind, if spread out over a large area, certainly would average out to be a more reliable source of power than a single wind farm in an isolated area…thoughts?
Noah,
If you are referring to coal plants (or even CCGT gas plants) being ill-equipped to balance wind you have a point. Nevertheless they may be forced to do so, as is the case in Colorado and Texas because of current circumstances. If you are arguing for generation plants that are better equipped, for example OCGT gas plants, then we have a large re-equipping of the fossil fuel fleet to face up to if we continue on the path of substantially increasing wind implementation. This is an argument for not proceeding with wind for the foreseeable future.
Further OCGT gas plants are less efficient than CCGT and consume more fuel and produce more emissions per MWh. So there is a price to pay for the flexibility that they provide. This is a major contributor to the increases in fuel and emissions when used to balance wind.
You might also be referring to the use of natural gas-fueled reciprocating engines, which was addressed in an earlier post at http://www.masterresource.org/2009/12/wind-integration-incremental-emissions-from-back-up-generation-cycling-part-iv-further-reflections/ .
Pumped storage has limited application and depends upon impounded hydro facilities or suitable ground formations. In this case consider the scale needed.
As far as the grid is concerned, improvements may be necessary, but upgrades in capacity and connections just to handle large-scale intermittent sources are unlikely to be on the right path of needed grid evolution. In addition to having questionable value, it is also a very costly venture. The “smart grid” is still in its infancy and will take decades to evolve properly. The installation of smart meters and associated demand management (again to supposedly accommodate intermittent electricity sources) is an overly emphasized (and arguable premature) element of smart grid. There are broader architectural and technology issues to be resolved (again “simple” capacity upgrades today are not necessarily part of this and could easily become “sunk costs” when important and relevant future improvements are contemplated).
Does geographic dispersion “certainly” (?) “average out” wind production? Unfortunately for your argument it does not. See some coverage of this in an earlier post http://www.masterresource.org/2009/12/wind-integration-incremental-emissions-from-back-up-generation-cycling-part-iii-response-to-comments/ . The general case seems to be that, with increased geographic dispersion, positive correlation does decrease from high values and approaches zero. For the element of reliability that you are envisaging, significant and persistent negative correlation would have to occur. Even at zero correlation the result would be random with a greater range in variation to be managed.
There is the concept of an eventual global grid system to allow the distribution of intermittent sources more widely. This is obviously a very distant possibility (think many decades) and may have more relevance for solar than wind. Again such a thought argues for withholding substantial implementations of wind. It is putting the cart before the horse.
[…] time. The Bentek study is supported by the work of engineers like Kent Hawkins in Canada (here and here), Peter Lang in Australia (here and here), Bryan Leyland in New Zealand, Jim Oswald in Britain, C. […]
[…] http://www.masterresource.org/2010/06/subsidizing-co2-emissions/ […]
[…] Original article: http://www.masterresource.org/2010/06/subsidizing-co2-emissions/ […]