The Ethanol Tax Credit – It’s Worse Than You Think
By Harry de Gorter and Jerry Taylor -- August 6, 2010[Editor note: Harry de Gorter is Professor in the Department of Applied Economics and Management at Cornell University; Jerry Taylor is a senior fellow at the Cato Institute specializing in energy and environmental policy.]
The nonpartisan Congressional Budget Office (CBO) recently issued a report on how the corn-ethanol tax credit costs $1.78 to reduce one gallon of gasoline consumption and $754 to reduce one ton of greenhouse gases. The Wall Street Journal immediately noted that “to put that [latter] number in perspective, the budget gnomes estimate that the price for a ton of carbon under the cap-and-tax program that the House passed last summer would be about $26 in 2019”.
While this study is being used by critics of the tax credit – which will cost about $30 billion over the next five years and is up for reauthorization this year – the CBO nonetheless severely underestimates the true costs of the ethanol tax credit in their calculations because:
(1) It ignores the existence of the ethanol consumption mandate (the Renewable Fuel Standard);
(2) It assumes each (energy equivalent) gallon of ethanol produced due to the tax credit replaces a gallon of gasoline;
(3) It ignores the fact that with an ethanol consumption mandate, the ethanol tax credit subsidizes gasoline consumption instead, and
(4) It erroneously suggests that the ethanol consumption mandate has not been binding in the past.
We analyze each error in turn.
(1) The mandate will kick in when the tax credit is not extended
The first error the CBO makes is that it calculates ethanol consumption to fall 32% if one removes the tax credit compared to no ethanol policy at all. But this is a purely academic exercise because we know in reality that a mandate exists and would kick in very soon if the tax credit was eliminated. In fact, ethanol consumption exceeded mandated volumes on average by 3.1% in 2008-2009 and will likely exceed mandated volumes by an average of 4.8% from 2011-2014. If ethanol consumption were to drop by only 3.1% or 4.8% – rather than 32% – as a consequence of eliminating the tax credit, the cost of eliminating a gallon of gasoline via this program increases by 7-11 times; from a meager $1.78 as reported by the CBO to a range of $12 to $18. Likewise, the cost of reducing one ton of greenhouse gases would increase from $754 to a range of $8,000 to $9,000.
The time period of analysis for the CBO’s calculations begins in 2011 yet the CBO itself predicts that ethanol consumption will equal mandated levels in the future:
In the future, the scheduled rise in mandated volumes would require the production of biofuels in amounts that are probably beyond what the market would produce even if the effects of the tax credits were included.
This means the tax credit will not increase ethanol consumption at all. Using CBO’s own (correct) formula of dividing taxpayer costs by the increase in ethanol consumption due to the tax credit, the cost of the tax credit in reducing gasoline consumption and greenhouse gas emissions is infinite, not $1.78 per gallon and $754 per ton, respectively.
(2) Ethanol does not replace gasoline gallon for gallon – there are fuel market effects
The second error the CBO makes is that it assumes each gallon of ethanol (energy equivalent) replaces a gallon of gasoline. But this ignores ‘leakage’ or indirect market effects in the fuel market. Ethanol production due to the tax credit shifts the fuel supply curve to the right, causing the market price of fuel to decline and total fuel consumption to increase. The increase in total fuel consumption is the leakage or amount of gasoline displaced. The difference between the increase in ethanol supply and the increase in total fuel consumption is the amount of gasoline replaced.
How big is leakage in the fuel market? The most comprehensive study on leakages in the fuel market due to biofuel policy is by Drabik and de Gorter which finds that one gallon (energy equivalent) of ethanol generated by tax credits is likely to replace only 0.3 of a gallon of gasoline. This means the market effect or leakage in the fuel market is 70 percent. In other words, instead of corn-ethanol costing $1.78 to replace one gallon of gasoline and $754 to reduce one ton of green house gas emissions, it costs about 3 times more even if we don’t correct those CBO estimates for the existence of the consumption mandate.
This second CBO error of assuming no leakage in the fuel market is ironic because 2.5 pages (of the total 17.5 page report) are analysis of indirect land use change due to biofuel policy. Indirect land use change is all about including a leakage, or market effect, in commodity markets. As land is diverted to biofuel production, commodity prices go up. Land is therefore converted from forests and grasslands elsewhere to take advantage of these higher commodity prices. This generates upfront green-house gas emissions and the CBO argues that these emissions must also be included as costs.
Why did the CBO discuss leakage or market effects in commodity markets and not in the market for fuel itself? Economists have estimated that greenhouse gas emissions from the leakage in commodity markets (generated by indirect land use change) is about one-third of that from leakage in the fuel market.
(3) The tax credit subsidizes gasoline consumption with a mandate
So far, the debate has been about how much the tax credit expands ethanol consumption and reduces gasoline consumption. But if the mandate is binding (i.e., determines the ethanol market price), as the CBO predicts, then the situation is even worse because the tax credit now subsidizes gasoline consumption instead. This is a recognized and accepted result amongst economists and so an explanation will not be repeated here. It has been adequately explained in the original and peer reviewed articles by de Gorter and Just (here and here), intuitive explanations in de Gorter and Just (here, here, and here), and in de Gorter. The result has been confirmed by Lapan and Moschini, Rapier (here and here) and Fischer and Preonas.
Given that the CBO report predicts mandates will bind in the future, surely the CBO had something to say as to what the tax credit would do in that case? The report did indeed comment on that situation with the following statement in two very prominent paragraphs (the last paragraph in each of the summary of the report and of the report itself):
the biofuel tax credits would no longer be increasing production, but they would still be reducing the costs borne by producers and consumers of biofuels.
The CBO’s contention that a tax credit with a binding mandate converts into a decoupled subsidy to biofuel producers and consumers defies economic logic and completely ignores the burgeoning literature on how tax credits subsidize gasoline consumption described in the previous paragraph. In reality, ethanol producers will be unaffected but biofuel consumers benefit in the form of lower fuel (ethanol and gasoline) prices. Because the mandate determines the ethanol price, this means the consumer price of gasoline declines.
(4) The ethanol consumption mandate is binding
The CBO report makes the same mistake as the earlier GAO report on biofuels by automatically concluding just because total ethanol consumption exceeded the mandated quantity in the past two years, the mandate was therefore not ‘binding’; i.e., did not determine ethanol market prices directly.
There are a multitude of reasons why the mandate is binding even if ex post ethanol consumption exceeds mandated volumes. For example, although the U.S. employs a consumption mandate requiring that a fixed amount of ethanol be used as fuel each year, it is nevertheless implemented as a blend mandate. The blend is based on a forecast of total fuel consumption for the upcoming year. If the forecast is wrong, then actual consumption does not equal observed consumption ex post. But that does not mean the mandate was not binding. Even if there is no forecast error, if the mandate binds for every day of the year but one, then observed consumption ex post is automatically going to be greater than the mandated volume. But is it then reasonable to conclude that the mandate did not bind? Moreover, firms can bank their mandated quantities (firms can use up to 20% of their RINs in the following year), automatically generating consumption levels beyond that year’s mandated volume.
How, then, might we determine whether the mandate is binding or not? The only fool proof way is to subtract the observed ethanol market price from the predicted ethanol price if the tax credit was the only policy instrument (see Figure 1). If the difference between these two variables is positive, then the mandate is binding (why otherwise would blenders pay a premium?). If the difference is negative, then there must be market disequilibrium (why otherwise would blenders forego profits?). If the difference is zero, then the tax credit determined ethanol prices and the mandate is dormant (not binding).
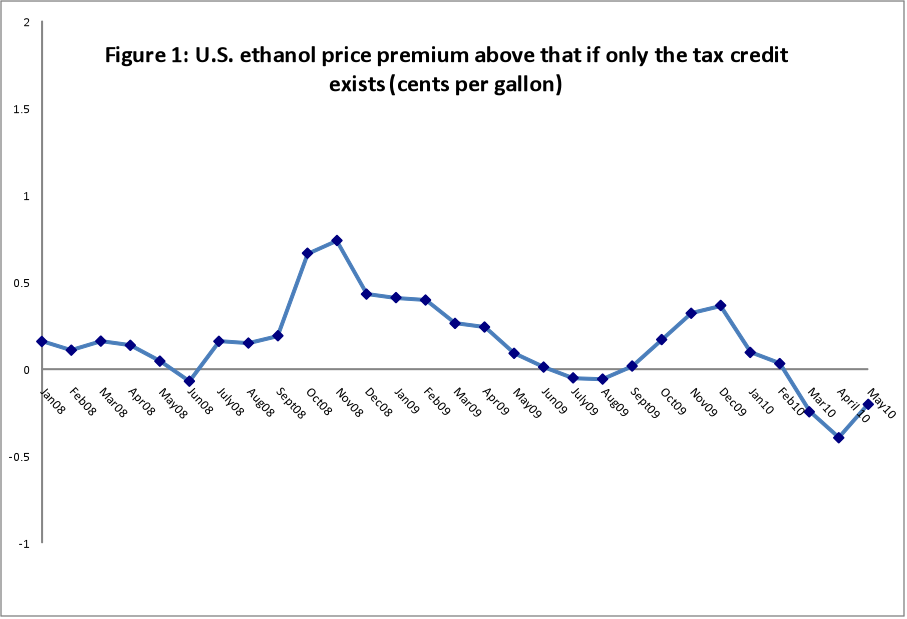
The negative values in Figure 1 arose because ethanol production increased so fast that in June of 2008, the infrastructure could not handle supplies while more recently, the “blend wall” is in effect where non-flex cars are subject to the current 10% blending limit.
The important implication is that if the tax credit determines ethanol market prices, then the mandate is dormant. Evidence in Figure 1 indicates that occurred in 4 months of the past 30 months. For 6 months, the blend wall seems to be the factor determining ethanol prices. In all the other 20 months, the mandate is determining the ethanol price.
But most importantly, if either the mandate or the blend wall is binding, then the tax credit is subsidizing gasoline or fuel (90% of which is gasoline) consumption.
A New Beginning?
After the CBO issued their report recently, Senate Energy and Natural Resources Chairman Jeff Bingaman (D., N.M), who commissioned the report, suggested that Congress “should look seriously at this expenditure rather than just reflexively extending it.” We suggest Chairman Bingaman not reflexively accept this report in its current state.
If this isn’t the worst example of rent seeking, it’s certainly in the top 10. Business people who believe in free markets should be opposed to the blatant corruption of politicians and businesses scratching each others backs. Consumer advocates should be upset that not only does the government artificially raise the price of food, but also that the sugar lobby insists on high tariffs to keep sugar cane ethanol imports at a disadvantage. Environmentalists should be equally opposed because a gallon of ethanol provides 75% of the energy of a gallon of gasoline. It is simply put, less efficient. Even the most determined Green should be willing to admit that efficient use of resources is not just cost effective but good public policy. When you think about it, something like 85% of the population is paying rent to some farmers, some sugar growers, several large processing corporations (like ADM) and a group of marginally profitable refiners. All orchestrated by a group of politicians who are not directly exposed to the costs associated with the policy but who benefit from substantial campaign contributions.
The good news is that Left and Right and consumers are pretty steamed about ethanol–this will be subject of Robert Bryce’s post on Monday.
Seems like scams are self propagating. One begats another
[…] The Ethanol Tax Credit-Even Worse Than You Think Harry de Gorter & Jerry Taylor, MasterResource.org, 6 August 2010 […]
[…] the ugly truth about the ethanol tax credit is worse than you thought. And all that money for a product that is 4 times worse than regular […]