It’s the Weather, Governor Brown (peddling climate hypochondria for political gain)
By Robert Endlich -- January 22, 2018“… environmentalists, politicians, regulators and courts have united to block tree thinning, brush removal and harvesting of dead and dying trees. The resulting conditions are perfect for devastating wildfires, which denude hillsides and forest habitats, leaving barren soils that cannot absorb the heavy rains that frequently follow the fires – leading to equally devastating mudslides.”
Abnormal, explainable weather conditions set the stage for 2017’s intense, highly destructive wildfires in California. But so did the state’s public-policy choice of au natural, where the absence of tree thinning, brush removal, and harvesting of dead and dying trees super-fueled the destruction.
But this is not the story being told by California political establishment. To them, the wine-country fires of October and the Thomas Fire in December were the result of global fossil-fuel burning and land-use changes, each increasing atmospheric concentrations of carbon dioxide (CO2) that increased temperatures and produced more severe droughts.
Background
A very bad fire year in California destroyed a record number of homes, including many of the affluent suburbs and enclaves northwest of Los Angeles and Hollywood. The Thomas Fire, the largest in modern California history, destroyed more than a thousand structures. The fires and subsequent mudslides killed more than 60 people and left many others severely burned or injured.
Predictably, California Governor Jerry Brown blamed the human influence on climate. During a December 9 visit to Ventura County, he insisted that the drought conditions were the “new normal.” While acknowledging that California has experienced “very long droughts” throughout its history, he claimed that “very bad” dry spells would be “returning more often” due to Big Oil et al.
It’s a nice attempt to deflect blame from his state’s ultra-green policies and poor forest-management practices. Governor Brown is grasping at straws as an examination of some meteorological and climate data shows. Rainfall records for California since measurements began, during the William McKinley presidency in the late 1800s, is a good place to begin.
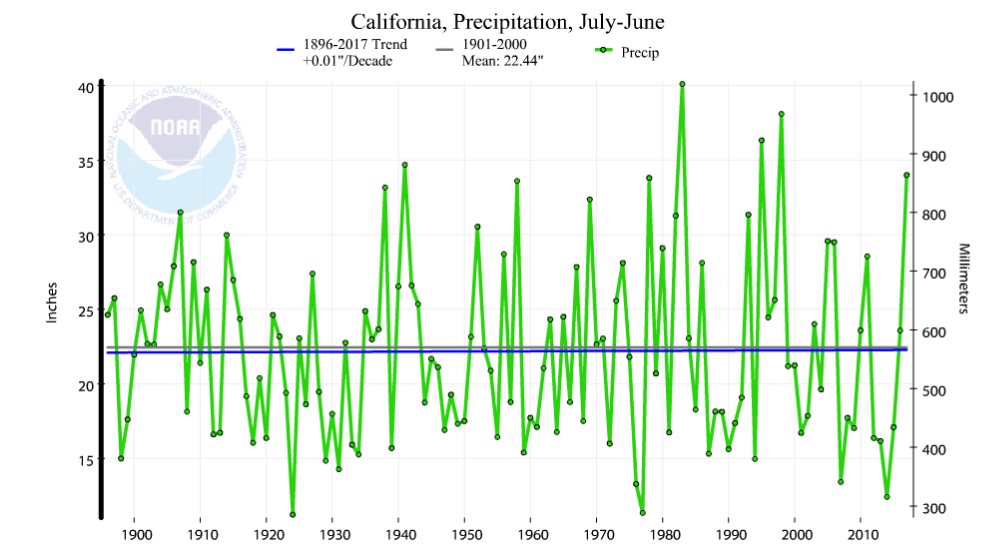
Fig. 1. Precipitation in California, from the US Government’s Climate at a Glance website. (Click to enlarge.)
California’s rainfall is mostly in the winter, so this Fig. 1 plot centers the 12-month rainfall in the winter months. It also accounts for the record rains that fell during the 2016-2017 winter, and almost resulted in the loss of the Oroville Dam, where the concrete spillway collapsed. The actual trend in the data (the blue line) shows that, contrary to Governor Brown’s contention, California rainfall and snowfall actually increased slightly over the past 125 years.
Meteorological conditions, as they develop over the course of a year, and as they develop during the multi-year El-Niño to La Niña cycles known as ENSO (El Niño Southern Oscillation), result in conditions that favor wildfires in California. Remember, fire is a part of nature, much to the consternation of those who disagree, and much to the dismay of those whose lives are disrupted by wildfire events such as these. They can be, and are, worsened and even made catastrophic by failures to manage forests properly, especially when hundreds of homes are built near forests. But fires are an essential natural process, and weather and climate cycles play important roles in that process.
Meteorological Overview
In the USA, the southern Lower 48 States from California to Florida, the “Sun Belt,” received that name because a feature of global circulation, the Hadley cell, causes descending air about 30 degrees north and south of the equator. The source? Rising air in the tropics, as can be seen in Fig. 2.
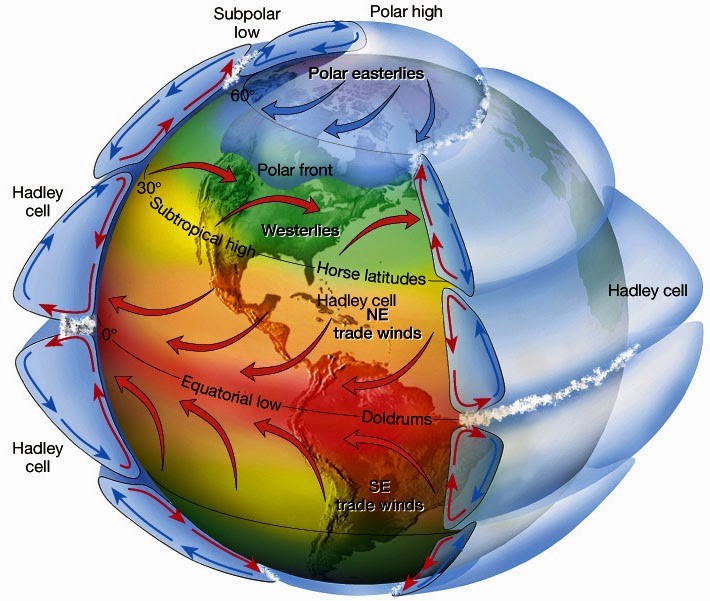
Fig. 2. Diagram of large-scale atmospheric circulation patterns, showing the subtropical high-pressure feature at the surface, 30 degrees latitude under the subsiding air of the Hadley Cell, depicted in the diagram on the left edge of the figure. (Click to enlarge.)
While the Fig. 2 diagram shows the average position of the subtropical high, what is equally important is that the position and strength of the subtropical high changes over the course of the year. The high-pressure cell gets stronger and moves further north (in the northern hemisphere) in the summer.
This feature is also called the “subtropical ridge” and, as it strengthens and moves northward during summer months, cities in the American southwest deserts (for example, in New Mexico and Arizona) experience a surface wind change from westerly to easterly, allowing moisture from the Gulf of Mexico to flow into those desert regions. This poleward movement of the subtropical ridge causes the North American Monsoon and the ensuing development of the summer thunderstorm season, the “monsoon season.”
A splendid example of this change is shown in the climatology of Tucson, Arizona, displayed in Fig. 3, where the green bars show average monthly precipitation.
Fig. 3. Climatology of Tucson, Arizona, from its official tracking website. The green bars show monthly precipitation; the dramatic increase in rainfall from June to July is evidence of the onset of the monsoon / thunderstorm season immediately after the annual maximum temperatures in June. This dramatic increase in rainfall is caused by the inflow of moist southeasterly winds from the Gulf of Mexico. (Click to enlarge.)
In California, however, the poleward migration of the subtropical ridge diverts rain-producing storm systems poleward, to the north, resulting in an almost complete loss of rainfall in the summer. This “Mediterranean” rainfall pattern is therefore almost the opposite of that found in the southwest deserts. Fig. 4 depicts a representative annual climatology of Los Angeles, California – helping to tell the story of the wildfire season in California.
Fig. 4. Climatology of Los Angeles, California, from the official tracking website. The green bars show the monthly rainfall, which peaks in winter and falls off dramatically as the subtropical ridge strengthens and moves poleward. On average, there is almost no rainfall in the summer months, because rain-producing storms are shunted to the north. (Click to enlarge.)
With this information in mind, if we think critically, we recognize that the usual situation is for vegetation to sprout in wet winter months, grow, and then dry out because of the lack of summer rainfall, resulting in the driest vegetation in the late summer and early fall.
Indeed, this is exactly the situation described in a recent article, which mentions October as the worst month for wildfires. It quotes University of California fire expert Max Moritz, who points out: “By the time you get to this season, right when you’re starting to anticipate some rain, it’s actually the most fire prone part of the year.”
California Weather Conditions: Precursor for Wildfires
The year 2017 started with an immense burst of rain in the lowlands and snow in the mountains. By some accounts, it was the wettest winter on record, which translated to abundant moisture for the grasses and plants that abound in this semi-tropical environment.
However, that’s only one part of the story. An editorial at the end of the Wine Country fires blamed several human causes for that conflagration, including: “Decades of aggressive firefighting left too much fuel on the ground,” and “another man-made initiative: building more and more homes in hilly communities adjacent to brush and woodlands.”
In recent decades, the grass and brush growth spurt brought on by the generous winter rainfall has been aided by the “plant fertilization effect” of increasing atmospheric CO2. This growth, followed by the drying that comes with the late spring, summer and early autumn months in these climates, helped set the stage for the Wine Country and Thomas Fire episodes.
Yet another factor, not mentioned in the article or most state and environmentalist discussions, is the failure or refusal of government agencies to permit the removal of dead, diseased and desiccated trees and brush from these woodlands – especially in the broad vicinity of these communities. Together, these factors all but ensure recurrent conflagrations and tragic losses of property and lives.
Autumn’s Stage
This pattern, the set-up for the autumn maximum of fire weather conditions in California, has its own set of names to describe winds that accompany these conditions.
In the Wine Country and San Francisco Bay region, the strong winds are referred to as “Diablo Winds.” In Southern California, they’re called “Santa Ana Winds.” Around the Santa Barbara area, they’re known as “Sundowner Winds.”
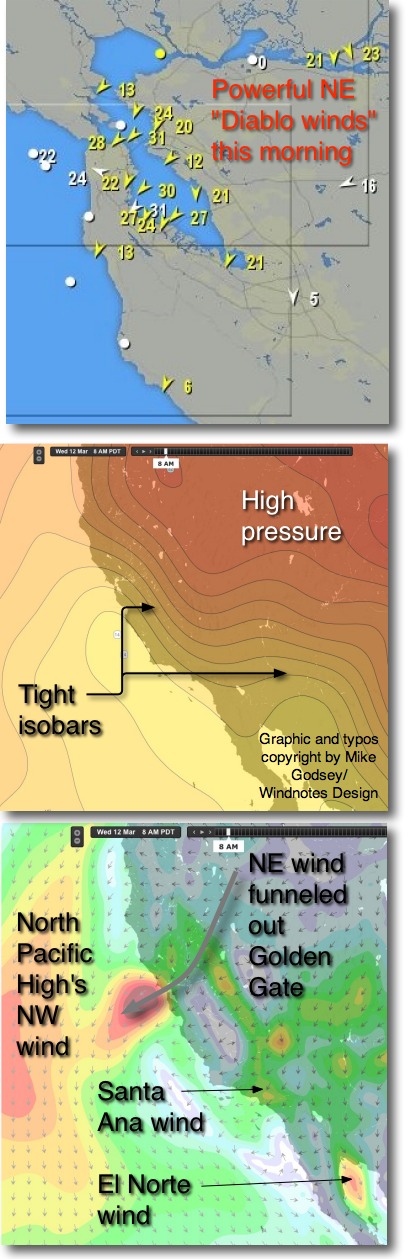
As autumn sets in, the first cold frontal passages arrive, cold air masses build into Nevada and adjacent states, and a northeasterly pressure gradient develops over California. Because of atmospheric physics, in a process called adiabatic compression, hot, dry winds develop, often quickly and dramatically. This process is shown in the next two figures, which depict surface pressure gradients associated with the onset of Diablo and Santa Ana winds (Fig. 5) and wind flow from the high country to the Pacific Coast (Fig. 6).
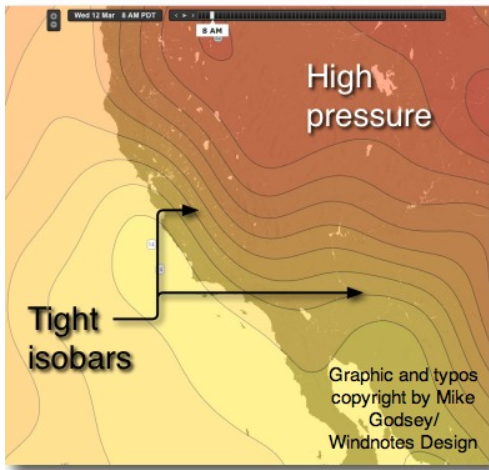
Fig. 5. This graphic shows the surface pressure gradients associated with the onset of Diablo and Santa Ana winds. (Click to enlarge.)
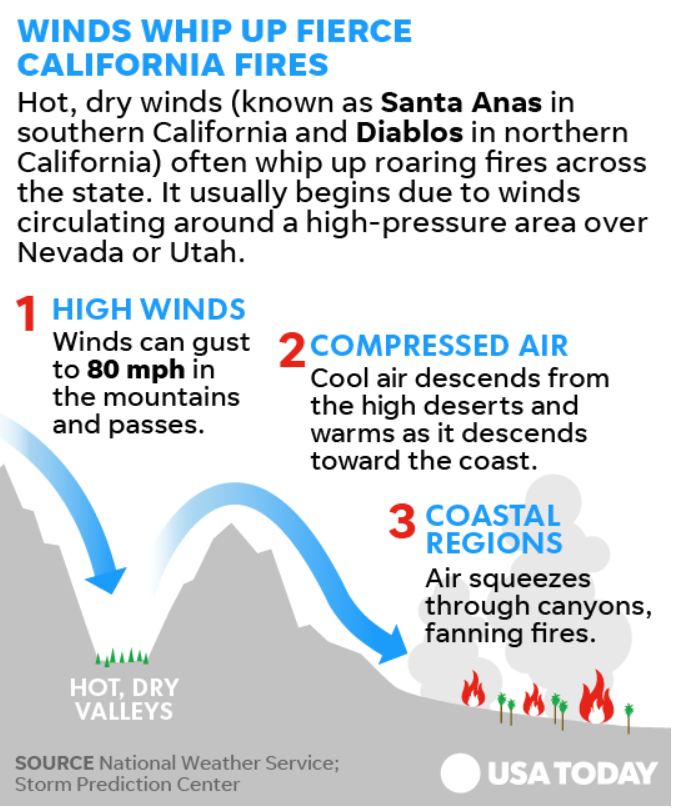
Fig. 6. This cross section from the Sierras to California’s Coasts shows the path of the winds and the adiabatic compression that causes the drying and heating of the air. (Click to enlarge.)
The situation described in Figure 6 is evident in surface weather maps and upper air charts routinely used by weather forecasters.
October 2017 Wine-country Wildfires
The next two weather charts show a “textbook example” of the meteorological conditions that were present at the onset of the Wine Country fires of October 2017. Fig. 7 presents a surface chart, showing a cold front, surface winds, and Santa Ana and Diablo Winds in California. Fig. 8 presents an upper air radiosonde graph from a weather balloon launched from Oakland International Airport:
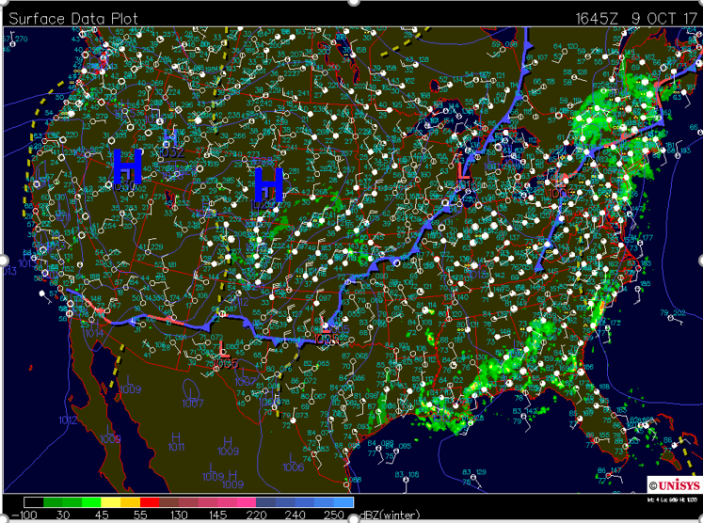
Fig. 7. Surface Chart from http://weather.unisys.com/surface/sfc_map.gif for the morning of 9 October, showing a cold front moving from north to south across the USA, and cool, high pressure, the H graphics, over Nevada and Wyoming. Wind barbs show surface winds from the north and northeast over wide areas of Nevada and California, Santa Ana Winds in southern California, and Diablo Winds in northern California. (Click to enlarge.)
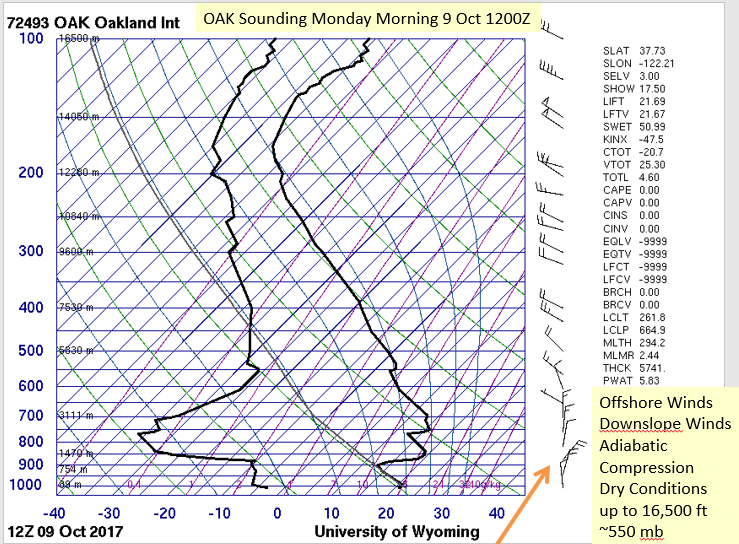
Fig. 8. Representation of the upper air conditions at Oakland International Airport from a sounding balloon launched on 9 October 2017 at 1200 GMT, or 0500 local time. This is a “Skew-T Log P” diagram with temperatures indicated along the bottom from -40 to 40C near the earth’s surface, showing blue lines of constant temperature slanting upwards and to the right (Skewed Temperatures). (Click to enlarge.)
In Fig. 8, pressures are depicted by the horizontal lines on the left axis of the chart. (1000 = 1000 millibars, the pressure near sea level; 500 = 500 millibars, the pressure at which half of the mass of the atmosphere is below, and half above, around 18,000 feet mean sea level or MSL. The arrangement of pressures in the vertical mimics the behavior of pressure in the atmosphere, “Log P.” Atmospheric temperatures measured during the balloon’s ascent is the fat line on the right extending upward, while dew point (a measure of water content) is the other fat line toward the left, also extending upward.
Wind directions and speeds in Figure 8 are plotted to the right; winds straight out of the north, at 700 millibars, around 10,000 feet, are represented by vertically-oriented wind shafts. The orange arrow shows the atmospheric levels where winds from the northeast are bringing downslope air from the Sierra Nevada Mountains to sea level, accompanied by warming and drying, the latter evidenced by the large difference between air temperature and dew point temperature. These are “classic” Diablo Wind conditions.
The Wine country fires of 2017 began suddenly during the evening of October 8, with development of the first fierce Diablo Winds of the season. Contemporary news accounts link the onset of ten fires within ninety minutes to PG&E power poles falling, many into dry trees. In one account, a Sonoma County resident said, “Trees were on fire like torches.”
The Mercury News carried a story saying that Governor Brown had vetoed a unanimously-passed in 2016 bill to fund power line safety measures. But the governor wants to spend still more money combating manmade climate change and compelling a major and rapid shift from fossil fuels to wind and solar power for electricity generation.
Pattern Change: Enhanced Drying of California Vegetation
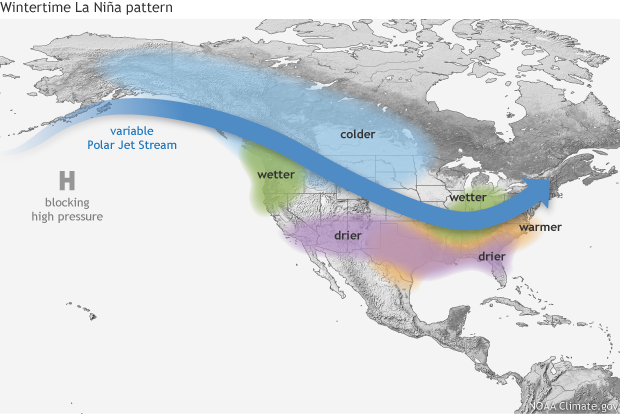
There was a significant cooling of Pacific Ocean temperatures from the peak of the 2015-16 El Niño to December 2017, such that La Niña conditions have developed in recent months. This distinct pattern shift brought distinctly drier conditions from southern California and Arizona to Florida and South Carolina, as shown in Fig. 9.
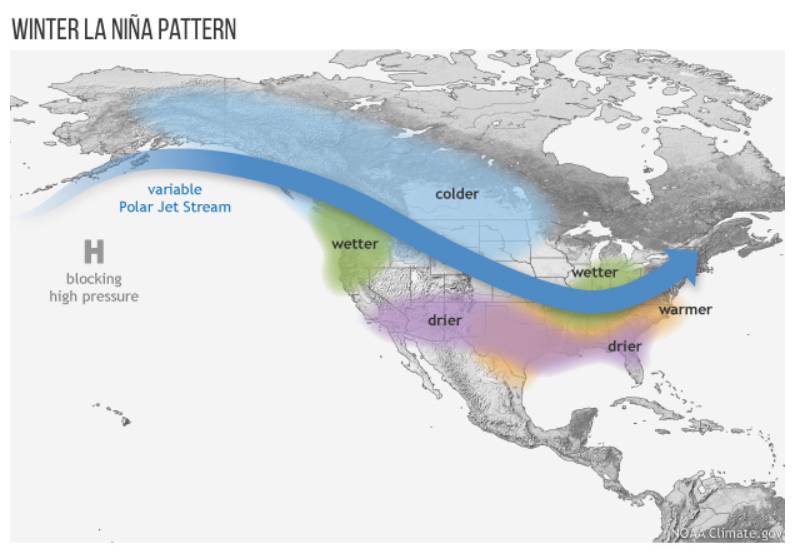
Fig. 9. Winter La Niña conditions result when strong trade winds and accompanying upwelling of cold waters at the coasts of North and South America cause drier than average conditions from southern California and Arizona to Florida and South Carolina. (Click to enlarge.)
This pattern shift is part of the evolution of temperature and precipitation enhancement areas characteristic of the ENSO sequence of events, and clearly is not the human-caused CO2-fueled global warming effects, which Governor Brown has charged.
December’s Catastrophic Fires
This brings us to the devastating Thomas Fire, which began on the evening of December 4, 2017 and still was not completely contained by New Year’s Eve, December 31. This fire’s behavior was controlled by a large in extent and long in duration Santa Ana Wind event and, like the previous Wine Country Fire, was dominated by high pressure over Nevada and persistent hot, dry, strong downslope winds which occur during such meteorological conditions.
The next two figures exemplify these Santa Ana weather conditions a week after the onset of the Thomas Fire. The surface map shows cold, high pressure over Nevada and Idaho.
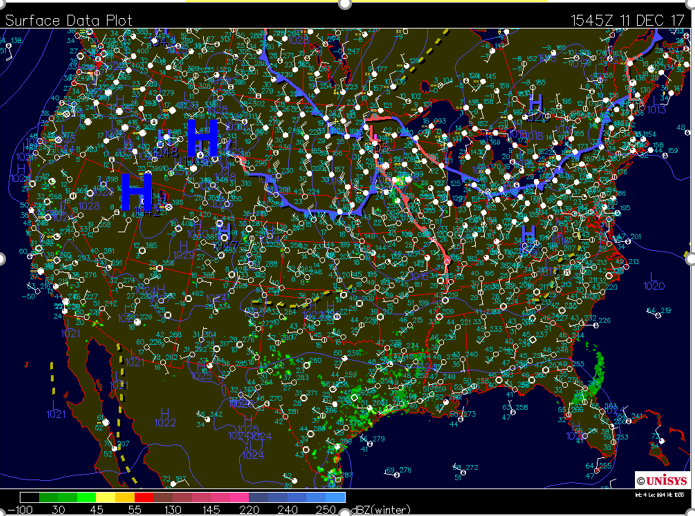
Fig.10. Surface Chart from http://weather.unisys.com/surface/sfc_map.gif for the morning of 11 December showing cold, high pressure over Nevada and Idaho. (Click to enlarge.)
The weather map in Fig. 11 is an upper air chart at 500 millibars for the lower 48 states, showing the weather situation a week into the Thomas Fire. at which time that fire was only 20% contained.
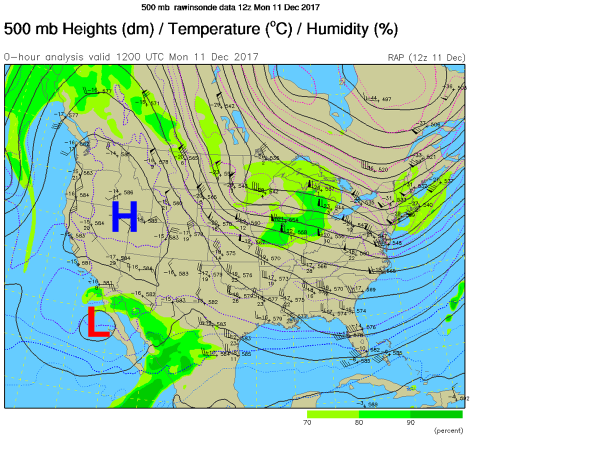
Fig. 11. Upper air map near 18,000 feet, portraying the measured height of the 500-millibar pressure surface above sea level, on the morning of Monday, December 11, when the pressure has dropped to only half of what it is at sea level. (Click to enlarge.) The H shows the high pressure aloft over the Nevada-Utah border, pushing winds from the east over wide areas of California. The weak low-pressure area off Baja California, the L on the map, accentuated this offshore flow, as indicated by strong winds from the east at San Diego (the wind shaft and barb immediately north of the L). This is the situation that brought downslope flow and accompanying hot, dry winds, which fanned the Thomas Fire to such intensity over such a wide area.
Public Policy Failure
Meteorological conditions create an environment for spreading wildfires. This year’s changeover from wet El Niño to dry La Niña conditions played a significant part in the atmospheric set-up for the 2017 fires.
In Australia, it is widely accepted that fuel-reduction actions are an accepted practice in fire management. This is not the case in the USA, where considerable debate still rages over the issue, and where environmentalists, politicians, regulators and courts have united to block tree thinning, brush removal and harvesting of dead and dying trees. The resulting conditions are perfect for devastating wildfires, which denude hillsides and forest habitats, leaving barren soils that cannot absorb the heavy rains that frequently follow the fires – leading to equally devastating mudslides.
In fact, environmental regulations associated with ill-fated attempts to help the spotted owl have eliminated logging and clearing throughout California and most of the Mountain West – with catastrophic results. Special legislation has been drafted to begin to address this problem. However, it is uncertain whether the legislation will be enacted and whether timber harvesting and/or fuel reduction strategies can be implemented in time to address the fuel excesses which exacerbate these conditions, and set the stage for yet another round of infernos and mudslides that wipe out wildlife habitats, destroy homes and communities, and leave hundreds of people dead, injured or burned horribly.
__________
Robert W. Endlich served as Weather Officer in the USAF for 21 Years. From 1984-1993, he provided toxic corridor and laser propagation support to the High Energy Laser Systems Test Facility at White Sands Missile Range. He has published in the technical literature and worked as software test engineer. He was elected to Chi Epsilon Pi, the national Meteorology Honor Society, while a Basic Meteorology student at Texas A&M University. He has a BA degree in Geology from Rutgers University and an MS in Meteorology from Pennsylvania State University.
To complement Bob Endlich’s well researched article above, the failure of California flood policy to target downstream populated areas after wild fires for mudslides should be noted. The Thomas Fire was a mudslide disaster waiting to happen, but public officials said and did nothing to put vulnerable communities on vigilant alert to evacuate immediately in the event of rainstorm.
Land use planning is another failure. Wealthy Californians want to escape to semi-rural, bucolic enclaves especially like Montecito, which is near the Pacific Ocean. Despite all the “environmental impact” reports and studies no one apparently put Montecito into the cross hairs for wildfires and future mudslides. What does California care? The monies from insurance companies will help stimulate the economy without having to raise taxes. But what if anything will be done to repeat such a disaster?
“Global warming”? As Endlich documents above, the pattern of rain – drought is cyclical not due to long term trends due to atmospheric warming.
Thank you for this excellent report. It should be required reading for all members of the Fourth Estate.
A very full explanation of what happened to precipitate these massive fires. What we are discovering is that the environmental movement are not using good science to drive their policy positions and decision making processes. This is indeed tragic, and likely led to the loss of life in the case of these devastating floods in Montecito. This situation is not improving. It seems as though the potential to glean lessons from these tragedies is being destroyed by the fallacious choices of left-wing group think. One might hope that someone living in Montecito who was actually impacted by this event would somehow wake up to the lies being told and understand that (in this case) hill-side management – reduction of vegetation so that it is less sensitive to burning and therefore loss of groundcover and thereby less impacted when subsequent heavy rains hit – is the way to go, and not allow overgrowth and then excessive fuel build-up to occur.
Is this simply asking for too much? And similar effects are happening elsewhere in the country due to these same nostrums.
Winter in Indio from Washington State. Have followed climate change for 30 years and support the conclusions about the need to manage foliage fuel. Greg Idso has shown that the value of plant growth from more carbon dioxide clearly is of great value to earthlings. We have plenty of problems to attack here and now and not worry about warming. Plastic in the ocean is just one example.
Good Analysis. Thanks for the article. We live on a mountain side on the West side of Colorado Springs, CO. We were greatly impacted by the Waldo Canyon fire several years ago which was probably set by an arsonist but was greatly aided by climatic weather conditions. Hot dry winds whipping up fire, causing it to jump in 1/2 mile leaps. Our terrain is similar to S. California in that we have lots of scrub, dry grass & dead bushes, trees, etc. For the last 20 yrs our whole community has been engaged in aggressive fire mitigation activities in reducing fuel sources near and around our property. Since I have 2 acres of brush, its alot of mitigation for a single family, let alone for all the other residents. But it has worked for us over the long run. It took about ten years to get into a position of maintenance. But mitigation is a never ending job as the brush & grasses grow back each spring season and dry out over the summer. Our local government, fire departments, etc. have been actively engaged with us in this effort & funds have been made available to support chipping activities. Overall it has been very successful for us. But we realize that living next to a national forest (Pikes Peak) & on the edge of civilization comes with a price. Be ever vigilant in mitigation activities & always factor in alternative ways of escape for an approaching fire.
Interestingly enough – ok bizarrely enough – the Los Angeles Times actually quoted an intelligent expert, Forest Service meteorologist Tom Rolinski, early on in the event.
Before that, and after that moment of reality, the paper went back to glorifying Gov Moonbeam Brown, and his understanding of man-made climate change and that these events are here to stay.
GaryH,
These L A Times comments are very close to the same content in this web post.
The cooling Pacific Ocean waters are a result of the ending of the El Nino of 2016-2017 and a return of La Nina Conditions. El Nino only lasts as long as there is a pool of warm water in the western Pacific to slosh across the entire Pacific basin and splash up against the Pacific Coasts of North and South America, a year or so. Once the trade winds resume in strength Northeast Trade Winds (off North America) and Southeast Trade Winds (off South America)they cause upwelling of cold water and cooling to the atmosphere (La Nina) where there was warming from below during the El Nino part of the cycle. This is the Pattern Shift that I mentioned, and the cause of the drought conditions from California to Florida. You might wish to read up on my class graphics for the “Weather, Climate, and Climate Change –What the Data Say” under the UTEP Class Tab at our web site; the link on ENSO is at http://casf.me/wp-content/uploads/2017/10/PDF_Climate-History-and-El-Nino_ENSO-_3_Oct_2017.pdf
ROBERT W. ENDLICH
[…] fuels – and blame these fuels and CO2 emissions for planetary warming (and cooling), rising seas, forest fires, and every major problem from malaria to rainstorms, droughts, hurricanes and […]
[…] fuels – and blame these fuels and CO2 emissions for planetary warming (and cooling), rising seas, forest fires, and every major problem from malaria to rainstorms, droughts, hurricanes and […]
[…] fuels – and blame these fuels and CO2 emissions for planetary warming (and cooling), rising seas, forest fires, and every major problem from malaria to rainstorms, droughts, hurricanes and […]
[…] fuels – and blame these fuels and CO2 emissions for planetary warming (and cooling), rising seas, forest fires, and every major problem from malaria to rainstorms, droughts, hurricanes and […]
[…] fuels—and blame these fuels and CO2 emissions for planetary warming (and cooling), rising seas, forest fires, and every major problem from malaria to rainstorms, droughts, hurricanes,and […]
[…] fuels – and blame these fuels and CO2 emissions for planetary warming (and cooling), rising seas, forest fires, and every major problem from malaria to rainstorms, droughts, hurricanes and […]
[…] fuels – and blame these fuels and CO2 emissions for planetary warming (and cooling), rising seas, forest fires, and every major problem from malaria to rainstorms, droughts, hurricanes and […]
[…] diets. The results aren’t just rising seas, warmer and colder weather, wetter and drier seasons, forest fires, nonexistent mass extinctions and the other oft-cited pseudo-cataclysms. They also include […]
[…] diets. The results aren’t just rising seas, warmer and colder weather, wetter and drier seasons, forest fires, nonexistent mass extinctions and the other oft-cited pseudo-cataclysms. They also include […]
[…] diets. The results aren’t just rising seas, warmer and colder weather, wetter and drier seasons, forest fires, nonexistent mass extinctions and the other oft-cited pseudo-cataclysms. They also include […]
[…] diets. The results aren’t just rising seas, warmer and colder weather, wetter and drier seasons, forest fires, nonexistent mass extinctions and the other oft-cited pseudo-cataclysms. They also include […]
[…] diets. The results aren’t just rising seas, warmer and colder weather, wetter and drier seasons, forest fires, nonexistent mass extinctions and the other oft-cited pseudo-cataclysms. They also […]
[…] nicht nur steigender Meeresspiegel, wärmeres und kälteres Wetter, nassere und trockenere Zeiten, Waldbrände, nicht existierendes Massenaussterben und anderen oftmals erwähnte Pseudo-Kataklysmen. Auch […]
[…] nicht nur steigender Meeresspiegel, wärmeres und kälteres Wetter, nassere und trockenere Zeiten, Waldbrände, nicht existierendes Massenaussterben und anderen oftmals erwähnte Pseudo-Kataklysmen. Auch […]
[…] diets. The results aren’t just rising seas, warmer and colder weather, wetter and drier seasons, forest fires, nonexistent mass extinctions and the other oft-cited pseudo-cataclysms. They also include […]
[…] California and the Thomas Fire near the mountainous areas above Santa Barbara. I described them here, writing and illustrating how the combination of geography, topography, Mediterranean-type of […]