Windpower Emissions: Kleekamp Critique (Part III – Cost of Wind and Nuclear Plants)
By Kent Hawkins -- January 26, 2011Parts I and II dealt with most of the issues in a recent paper by Chuck Kleekamp and showed the weaknesses of his analysis. This post addresses in detail the question of the costs of electricity generation for nuclear and wind.
Kleekamp says, “If you think wind power is expensive, wait till you have to pay for electricity from a new nuclear plant.” This suggests that nuclear plant electricity is more expensive than that of wind. This is remarkably incorrect. The costs of each according to the EIA along with my adjustments, are shown in Tables 2 and 3 below, which clearly demonstrates the high costs of wind compared to nuclear. As will be seen, the EIA costs are just starting points.
These costs are shown on separate tables for wind and nuclear because they are not really comparable. The reason for this is that nuclear plants produce power, which can be depended upon, a critical factor in the successful use of electricity, and wind plants do not.
The EIA shows capital costs and levelized costs. Levelized costs, expressed in $/MWh are important to understand, because this is the basis on which we use and pay for electricity. However, and as already stated, but repeated for emphasis, comparing the EIA reported levelized costs of wind with conventional electricity generation technologies is not an “apples to apples” comparison, because of the unreliability of wind. Stated another way to the previous paragraph, this is because wind has no capacity value, the details of capacity value are too extensive to deal with in this post. Interested readers can see more information on this important consideration here.
We will first look at actual experience with wind capacity factors in the United Kingdom (UK), an important issue in determining levelized costs, and then at an analysis of the levelized costs for nuclear and wind plants as published by the EIA. Even without consideration of the reliability factor, it will be seen that wind is substantially more expensive compared to nuclear than the EIA reports, and contrary to what Kleekamp appears to suggest.
Wind Capacity Factor
Outside of cost considerations, capacity factor is not a very meaningful measure of electricity generation plant performance, especially wind power. For most generation plants it is a measure of the degree to which the plant types are called on by systems operators. For intermittent plants, it is dependent upon the availability of the fuel (wind and sunshine).
One good source of information, particularly for offshore wind, is the UK, which has the largest fleet of offshore wind plants worldwide, but still only about 1 GW, representing about one-half of all offshore installations, which itself represents only about 1% of all wind implementations of 158 GW. The data shown in Table 1 is from the Digest of United Kingdom Energy Statistics (DUKES).
Table 1 – Wind Capacity Factors for the UK
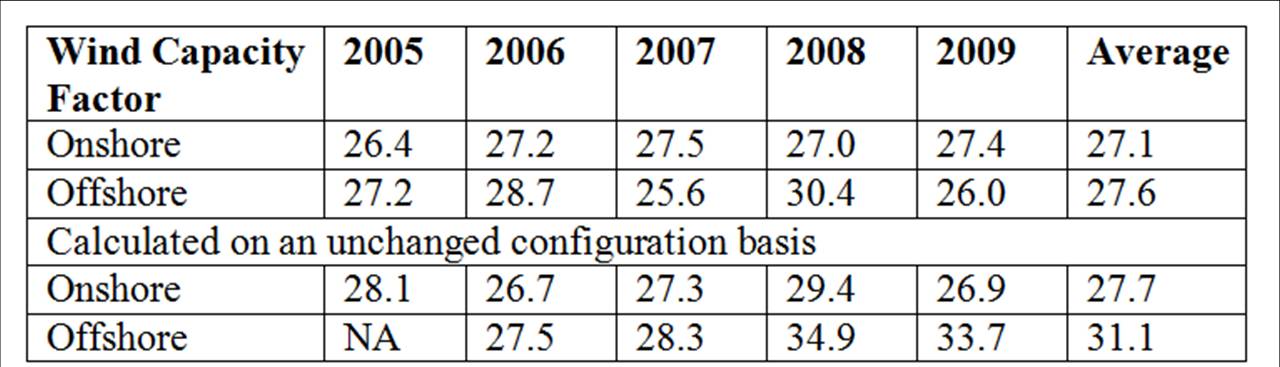
The unchanged configuration is a calculation based only on those plants installed at the beginning of the year and whose configuration has not changed during the year. Both show remarkably low capacity factors considering the general expectation for offshore wind. Due to normal wind regime variations between years, and other considerations described below, any apparent trend in the above numbers is not conclusive.
For information on U.S. capacity factor experience see this DOE presentation, slide 45, which shows that onshore wind may have topped out at about 30% on a national average basis. Note the impact of increased curtailment as shown in slide 47. This is a major issue in Germany’s low capacity factors of less than 20%. There is little reason to believe that the trend to increased curtailment will not continue in the U.S. for the following reasons:
- The effect of the best sites being taken up by the earlier wind plants
- Wear and tear of the large and rotating turbine blade structure (about 30 tons) and nacelle containing substantial equipment, including a gear assembly, generator and support devices for total of about 60 tons at the top of a tall tower
- Turbine blade pitting and contamination which affects its carefully designed and manufactured airfoil characteristics and hence performance
- In the case of offshore:
- The notably hostile environment, for example, icing conditions on the Great Lakes and salt air on the oceans
- In the event of a failure, maintenance can be delayed due to weather conditions and even a scheduling consideration of waiting for more than one to reduce the trips, and equipment deployment.
EIA Costs Analysis
The reported EIA levelized costs shown below do not include the reported small transmission investment component, which is a “basic transmission fee” that is not a complete representation of necessary extensive transmission investment, especially with respect to dispersed intermittent energy sources. Here is what the EIA has to say about their reported cost information:
“…there is significant local variation in costs based on local labor markets and the cost and availability of fuel or energy resources such as windy sites. For example, regional wind costs range from 91 $/MWh in the region with the best available resources in 2016 to 271 $/MWh in regions where the best sites have been claimed by 2016. Costs for wind may include additional costs associated with transmission upgrades needed to access remote resources, as well as other factors that markets may or may not internalize into the market price for wind power.” (Emphasis added – see effects of reduced capacity factor in Table 2)
I asked the EIA about the additional costs for wind described in the last sentence and was told that much of the difference between $91 and $271/MWh is likely related to the implied transmission component for new builds and upgrades, but it is difficult to isolate the exact amount. On the other hand, wind “firming” costs incurred by balancing generation are not included. The following is my admittedly very rough attempt to pin down the transmission investment required for wind:
Assume:
· The transmission builds and upgrades are the difference between the national average of $141 (from Table 2) and the upper range, that is 271-141 = $130/MWh, but this is easily an upper range. At this point I apply a 50% factor to this for a possible lower range value, and to be more conservative still, use this lower value in calculations.
· A capacity factor of 34.4%
· The EIA economic life period of 30 years for cost recoveries in the levelized costs
The costs are:
· For each installed MW of wind capacity expect an annual production of 1 x 34.4% x 24 x 365 = 0.344MWh x 8,760 = 3,013 MWh/year
· The cost is 130 x 0.5 x 3,013 = $196,000 per MW per year
· For 300 GW by 2030 this means roughly an average annual cost based on 150 GW, that is 150,000 MW x $196,000 = $29 billion per year
For 30 years (cost recovery period used in levelized costs) this becomes 30 x $29 billion = $870 billion, or almost $1 trillion at least. This amount is not spent over 30 years, but will be concentrated during the initial years to accommodate the projected wind implementation and is consistent with the reported expectation transmission investment for Europe of $1.6 trillion, as well as the Brattle Group projection of $880 billion for the U.S., excluding expenditures undertaken by electric cooperatives or government-owned utilities. However, as with most reports, you have to read further than the Executive Summary, and the Brattle Group study has this to say on page 33 with respect to transmission investment:
“Finally, the recent historical pattern of new generating plants built at locations needing minimal grid build-out is shifting toward new plants in more distant, resource-rich areas. [i.e. wind] This phenomenon could considerably boost transmission miles built per installed megawatt (MW) of generation capacity, though we cannot reliably predict the magnitude of this effect.”
Wind Plant Costs
The EIA levelized costs for wind have been adjusted based on two considerations.
- The EIA capacity factors for wind are generous and more realistic levels are shown for sensitivity purposes. The new levelized costs are a simple ratio of the capacity factors in the first adjustment, and then expected plant life in the second. This is not precise given the EIA’s relatively complex method of calculating, but representative.
- In the calculation of levelized costs, The EIA uses a “cost recovery period” of 30 years for all generation technologies regardless of the expected plant life for each. Reasonable numbers for plant life are 20 years for wind turbines and 40 years for nuclear plants, both likely needing refurbishment within that time period. Modern large wind turbines appear to have a life of 10-15 years, at which point considerable refurbishment is required which, could easily be in the range of the full initial capital cost. In the subsequent analysis to exclude refurbishment, nuclear is left at the 30 year value and wind is recalculated at 15 years, again using a simple ratio approach.
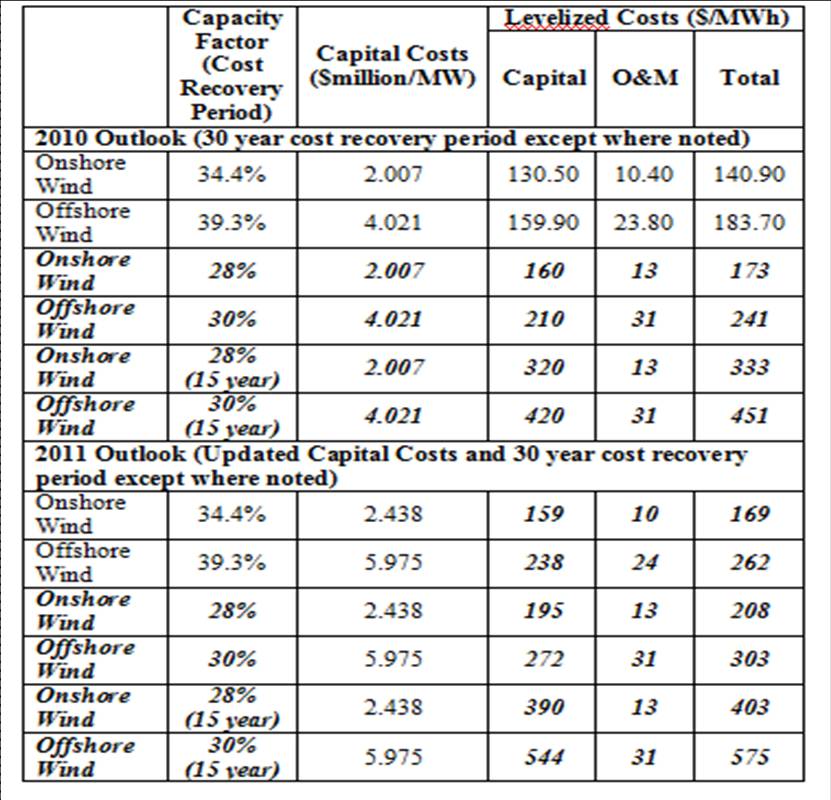
EIA reports a range of $91-$271/MWh (2010 capital costs) for onshore wind. On the same simple ratio basis as described above, I calculate this to be $111-$328 based on 2011 capital costs for wind.
Taking these considerations into account, my adjustments to the EIA national averages are provided in Tables 2 and 3 and shown in italic bold, as a sensitivity analysis of their impact. Adjusted numbers have been rounded to the nearest dollar, but still represent a higher precision than warranted. It is emphasized that these adjustments are simply calculated and approximate in nature.
It should also be emphasized that the EIA cost numbers are already complex and include factors by technology for such as project contingency, technological, learning parameters, component cost and capacity weights, regional considerations, and emissions modifications.
Table 2 – National Average Levelized Costs of Wind Plants Projected to 2016
So how do offshore wind plants make a profit if their Power Purchase Agreement pays them $.20 per kWh ($200/MWh)? The answer is a business plan based on high capacity factors that may not be realized and arguably unrealistic plant life assumptions to obtain financing (bank loans) and a combination of the PPA revenue plus tax incentives and other incentives provided by the government, such as investment tax credits, federal loan guarantees and accelerated depreciation allowances that reduce tax payments.
Nuclear Plant Costs
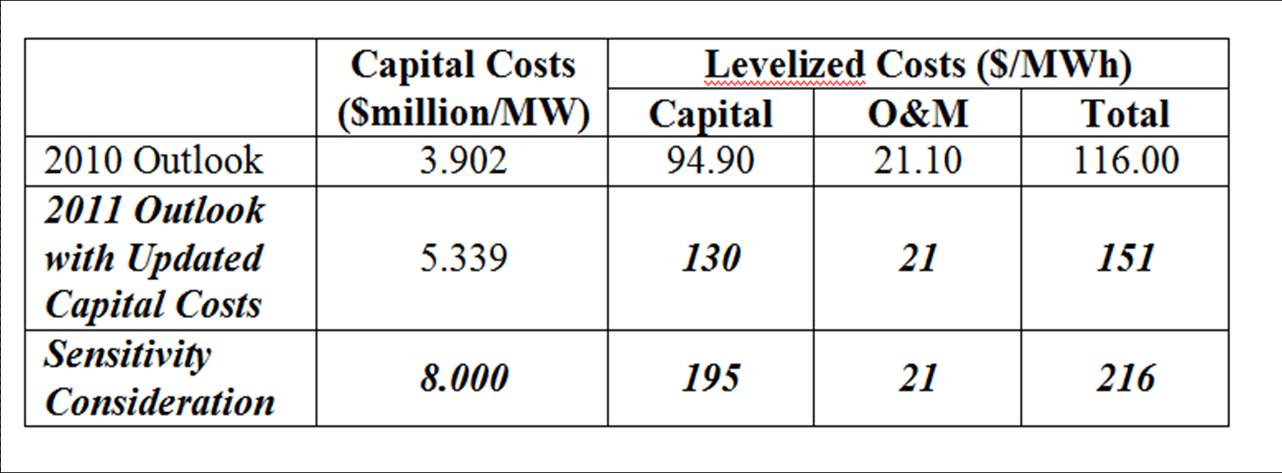
Turning to nuclear plants, the EIA numbers are as shown in Table 3. At the end of the table I have included a substantially higher number. In the January 2011 issue of Power Magazine, the 2011 Industry Outlook article shows plant capital costs and says the following for nuclear:
“No one knows what the cost of a new nuclear unit will be…. According to a recent analysis by Mark Cooper for the Vermont Law School’s Institute for Energy and the Environment “The current projected costs are all over the map, with the 2008-2009 cost estimates clustering in the $4,000 to $6,000/kW range, with estimates going as high as $10,000/kW.” Standard and Poor’s puts the average at $7,500.”
Reportedly these costs include contingencies and are not over-night capital costs (as used by the EIA) because of the long nuclear plant construction periods. However, it seems reasonable to look at the impact of higher nuclear plant capital costs in light of the above quote, in much the same way that the wind costs were adjusted for good reasons. Again for sensitivity analysis purposes, a capital cost of $8,000 was chosen as shown in Table 3.
Table 3 – Levelized Costs of Nuclear Plants Projected to 2016
Summary
Remember that about $65/MWh ($130 x 0.5 as calculated above) should be added to wind plant costs in addition to the national average of levelized costs shown in Table 2.
It is suggested that the low end numbers in Tables 2 and 3 are fairly unrealistic for all three technologies. The high end number for nuclear is a reasonable expectation, given the uncertainty that surrounds these plant implementations. The high end numbers for wind are arguably reasonable expectations as well for both capacity factor and plant life reasons.
Even at this level of cost discussion, which does not take into account the lack of reliable power from wind, nuclear is in the order of at least one-half the costs of wind implementations. This will be a major factor in increased electricity prices within the country, state or province that is unfortunate enough to have wind plants installed. Note in particular the high costs of residential electricity in Denmark and Germany and commentary on Germany, both at multiples for North America.
Kleekamp’s warning about nuclear costs is unfounded.
On a final note, all readers, and wind proponents in particular (especially Cape Wind supporters), are advised to read Jonathan Lesser’s recent article in Regulation magazine “Gresham’s Law of Green Energy”.
Chuck Kleekamp’s wind fetish has not been sliced and diced as much as it has been strangled from head to toe, crushed by Kent Hawkins’ anaconda-like critique. Wind is such a scurrilous wannabe, put forward by nefarious, trollish interests. It can never achieve the respect earned from meritorious performance.
For all the reasons Kent shows here–its desultory capacity factors propped up by a government agency using projections and data unfettered by reality; its utter lack of capacity value; its hiccuping performance that makes all around work much harder just to stay in place; and its brobdingnagian subprime costs, making it a worthy legacy out from Enron and Goldman Sachs–wind is to nuclear what a doltish schoolyard bully is to Leonardo da Vinci.
This is an especially timely interjection in the wake of Mr. Obama’s recent State of the Union message, in which he called for a national push for renewables, clearly spearheaded by wind. For a president who in his inaugural address called for the nation to put away childish things, his prattle for wind shows he’s not ready to leave the nursery.
>which shows that onshore wind may have topped out at about 30% on a national average basis.
But if you go to the EIA site, find the numbers, then divide Mhrs produced by wind by MW’s installed the result is 25% of capacity produced.
your link for the 10-15 year life of a wind turbine has no actual data. It just says “10-15” years which is an opinion not supported by any data that I have. The 2008 data set out of Denmark that has been used to show 15 year lifespans by some nuclear advocates (NNadir of dKos) is not useful. Only 10 of the 1928 decommissioned turbines is what would be considered a modern, utility scale turbine (>= 1 MW). Each of those ten are different models and seven were operable for less than 4 years. I would suggest that that clearly indicates that they were prototypes.
There are currently (as of Nov 2008) 645 >1 MW wind turbines operating in Denmark.
IEC 61400-1 outlines the design requirements for modern wind turbines and the required design life is 20 years which is the life expectancy I use in all of my analyses. Turbine manufacturers claim that 25 years is to be expected.
jam
The reference to wind turbine life expectancy was prepared by a knowledgeable wind-friendly, but realistic, energy consultant based in Denmark, so it is reasonable to take it into account. There is enough concern expressed about maintenance problems with wind turbines to suggest that 20-25 years of service is not a reasonable expectation, either onshore or offshore, but especially with respect to offshore.
You are correct that Denmark does not have a large number of the type of turbines that are currently being installed now in other countries, and there has been a hiatus in wind turbine installations there since about 2003.
The reality is that there are no wind turbines of the size and type now being installed that have been in service long enough to provide data, and 80% plus of all existing wind turbines have been installed since 2000. Design requirements are not necessarily a guarantee of performance, and I would be very reluctant to rely on manufacturers’ claims. I personally doubt that given the exposed conditions that wind turbines operate in (and the resulting blade surface pitting for example) that they will not suffer significant wear and tear within 10-15 years.
I suggest you revise your analyses to be more conservative, or at least show the impact of possible shorter wind turbine life.
Thank you, that’s good information to have. I always do uncertainty and sensitivity analyses with my reports, so no worries there. I wouldn’t worry too much about blade surface pitting, however. Degradation of the airfoil usually only causes about a 2% loss in efficiency and since they are fiber glass, they can be repaired fairly inexpensively. The Danish fleet has six (yes, six!) utility scale turbines older than 20 years and about a hundred in the 15 year range (remembering that it is a young fleet and that they have only decommissioned 4 of the more than 3300 utility scale turbines installed since 1987).
Of course, Mr. Boone will just say that I’m being a nefarious troll, so I will leave you with that. He has quite a poor view of engineers so I would keep an eye on him if I were you, Mr. Hawkins 😉
John
Please define ‘utility scale’ and the sizes of the 100 wind turbines in the 15 year range.
With respect to repairing blades – how is this done? Is it done on the blade ‘in situ’ or does it have to be disassembled? How often is it required?
I would define “utility scale” as any turbine greater than 600 kW. Micon and Vestas both came out with 600 kW turbines in 1995. Neg Micon then released a 750 kW in 1996. Single machines as high as 2 MW have been around since 1987 but megawatt machines didn’t become a mainstay until 2000-2001.
Blade inspections are done at least annually. Most damage can be repaired in situ.
John,
Thank you for this information. Of course our focus should be on the larger wind turbines (>1 MW) that are now being massively installed, and I suggest have their own unique problems because of their very large size and weight.
You have identified single 2 MW wind turbines that have been installed since 1987. Please provide any available information on these, e.g. number, manufacturer, location, time in service, maintenance experience, major overhauls including costs, which hopefully should not be difficult because of the likely limited number.
I’m sorry, I “misspoke”. Twice.
First, by “been around” I meant that the technology was invented, not that individual turbines had been installed and functioning since then.
Second, they were 1.5 MW turbines and it was 1988.
And on further review, I believe they are typos in the Danish database of wind turbines. On one, the capacity doesn’t match the model number. On the second, the model number is closer to something that would have been created in 1998, not 1988.
I deeply regret the errors.
The turbines installed in 1987 were five 750 kW Windane 40. They have averaged an anemic 12% capacity factor with a peak of 21% in 1994 and a noticeable downward trend in capacity factor over the past 10 years.
Actually, JTA Miller, I have great respect for engineers generally and for engineering ingenuity in particular. If any profession can make pigs appear to fly, it is the engineering profession. But too often they hitch their considerable skills behind the most questionable enterprise. My first sustained interaction, years ago, was with the Army Corps of Engineers, which was tasked with “mitigating” massive wetlands development that became an environmental nightmare as they sashayed from one tree swing solution to the next trying to keep ahead of the accumulating problems. Later, during a long academic career, I observed how engineers worked to cover over truly bungled planning, in the process greatly increasing cost.
On the other hand, I’ve had numerous private conversations with electrical engineers associated with both grid control and regulatory agencies who privately, because they feared for their jobs, encouraged my critique of wind “power,” even giving me greater insight into wind’s limitations.
Engineers have been instrumental in helping to fashion the best of our modernity. However, even casual inquiry reveals how some are also implicated in the worst of modernity. Mining engineers, with amazing intellectual dexterity, have made it possible to remove whole mountains to get at the coal. Engineers have also given logging outfits the means to remove whole forested ecosystems, particularly on the steepest slopes. And, now, engineers are making possible wind integration, in the process greatly increasing consumer cost and decreasing grid reliability and security–while providing none of the benefits claimed for the technology. But they’re getting the job done. Money, money, money.
I’d rather drive a truck….
[…] MASTER RESCOURCE Windpower Emissions: Kleekamp Critique (Part III – Cost of Wind and Nuclear Plants) by Kent Hawkins January 26, 2011 http://www.masterresource.org/2011/01/kleekamp-part-iii/#more-13751 […]