Technical Appendix to the Calculator: Fossil Fuel Consumption, CO2 Emissions, and Costs with Wind (Part II)
By Kent Hawkins -- November 30, 2010Part I yesterday introduced the latest version of the Calculator (14.2), which continues to illustrate the futility of wind as a means of reducing fossil fuel consumption and CO2 emissions. This post provides more detail about the approach taken by the Calculator.
As important as the subject is, there are no extensive analyses of real-time information (finely grained time intervals for long periods of time) assessing all the variables affecting electricity system behaviour as wind penetration increases. Existing analyses have some or many of the following important limiting characteristics (not necessarily an exhaustive list):
· Are based solely on annual electricity production and annual averages (even statistical averaging is suspect in terms of real-time operation) of electricity generation.
· Use unrealistically high wind capacity factors, including offshore projections, which in practice deliver at about the same capacity factor as assumed at the high end for onshore.
· Are conducted at a macro level, say for a country or even a state, ignoring lower level considerations (eg local grid considerations)
· Assume that the production from intermittent sources offsets fossil fuel consumption (and thus CO2 emissions) on a MWh basis. Some studies admit to some reduction in savings but suggest that this is small.
· May do valid, but incomplete, modelling, for example short time periods, using limited fossil fuel plant performance data and ignoring the need to change fossil fuel plant types to meet the requirements of balancing wind.
· Do not take into account the reduced capacity factor of wind-balancing fossil fuel plants
· Assume that normal reserves are available to meet continuous intermittent wind production variations regardless of wind penetration.
· Assume intermittent production is no different from short term demand changes.
· Assume geographic dispersion provides significant smoothing.
· Assume better wind forecasting will reduce the impact on wind balancing requirements.
· Ignore seasonal and year-to-year wind conditions.
· Assume grid upgrades (typically substantial capacity upgrades but sometimes disguised as “smart grid” considerations, such as smart meter implementations and demand management) will allow the introduction of extensive wind plants in a manageable manner.
· Do not provide a convincing causation link between any changes in CO2 emissions and wind implementation.
There are many studies with these limitations, and unfortunately, these are largely the accepted body of knowledge on the subject. In response, I developed the Calculator in an attempt to estimate these affects in a relatively simple way. I use the term “simple” advisedly for a number of reasons, which are evident on close examination of the Calculator. The intent is not to make the claim of complete representation of the subject but a model that will allow most (if not all) to be considered. I look forward to the comprehensive studies that settle the matter. So far, only small progress has been made due to the lack of public access to the necessary information.
Calculator Overview
The calculator attempts to handle the considerations to be taken into account, albeit in an unsophisticated and somewhat linear way. Hopefully, this makes it more accessible to a wider audience, transparent, and falsifiable. It models the relationship between a level of wind electricity production and the associated wind-balancing fossil fuel plants (hydro is a special case, and see a discussion here). Annual production numbers are used as a starting point, to which the calculator applies the short-term effects.
The basic elements are:
- A provision for seasonal variations in wind electricity production over a year.
- A provision to select the generation mix of fossil fuel plants in the wind-mirroring role, as well as the base case without wind in the electricity system
- The application of a range of heat rate penalties, and associated increases in fossil fuel consumption and CO2 emissions produced, for fossil fuel plants employed in a wind-balancing role.
- A cost model
Seasonal Variations
There are seasonal variations in wind production within a year. To accommodate this, the year is divided into two parts: a high wind period; and a low wind period. The proportion of the year for each can be changed. Between the two seasons there can be different levels relative to the annual average production. This distribution can also be changed.
Figure 1 illustrates the case of the low wind period for 50% of the year and reduced by about 50% for this period. The range of wind volatility shown is for illustrative purposes only. It also shows a possible mix of CCGT and OCGT gas plants in each case.
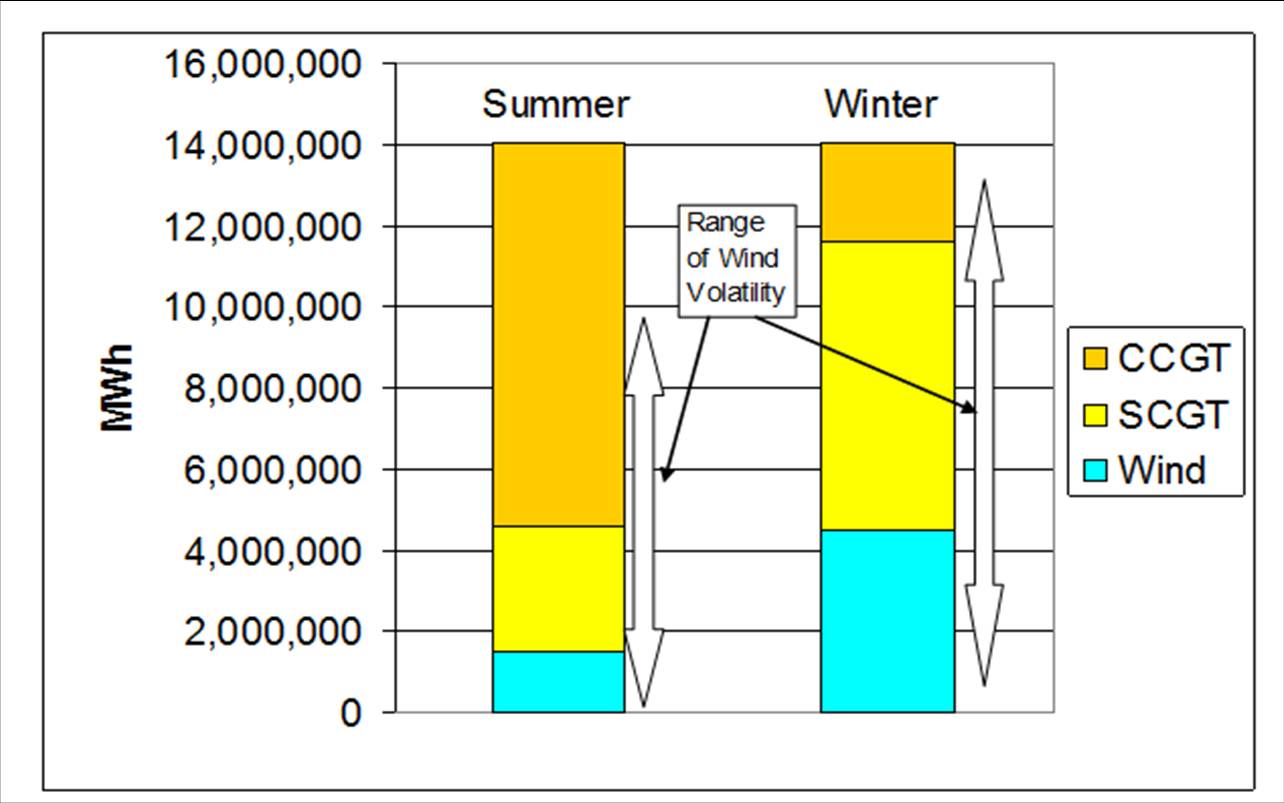
Figure 1 – Illustration of the division of a year into low wind (summer) and high wind (winter) including considerations of wind volatility and employment of gas turbine types in each period.
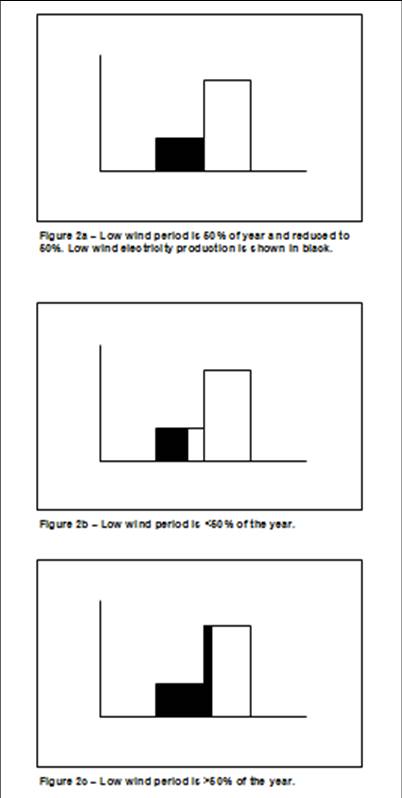
Good starting points, or nominal values, for each factor of percent of year and reduction in wind electricity production in the low wind period are 50%. Figures 2a to 2c show the current version’s approach of varying the division of the year’s wind production between low and high wind periods. The total of wind electricity production in each is calculated based on the area shown in black. The reason for so much attention to this is that one reviewer found an error in the way this was calculated in earlier versions for variations from 50% values.
Heat Rate Penalties
There is a non-linear relationship between heat rate (efficiency) and the amount of CO2 emissions, and fossil fuel consumption (which is directly related to emissions), as shown in Figure 3.
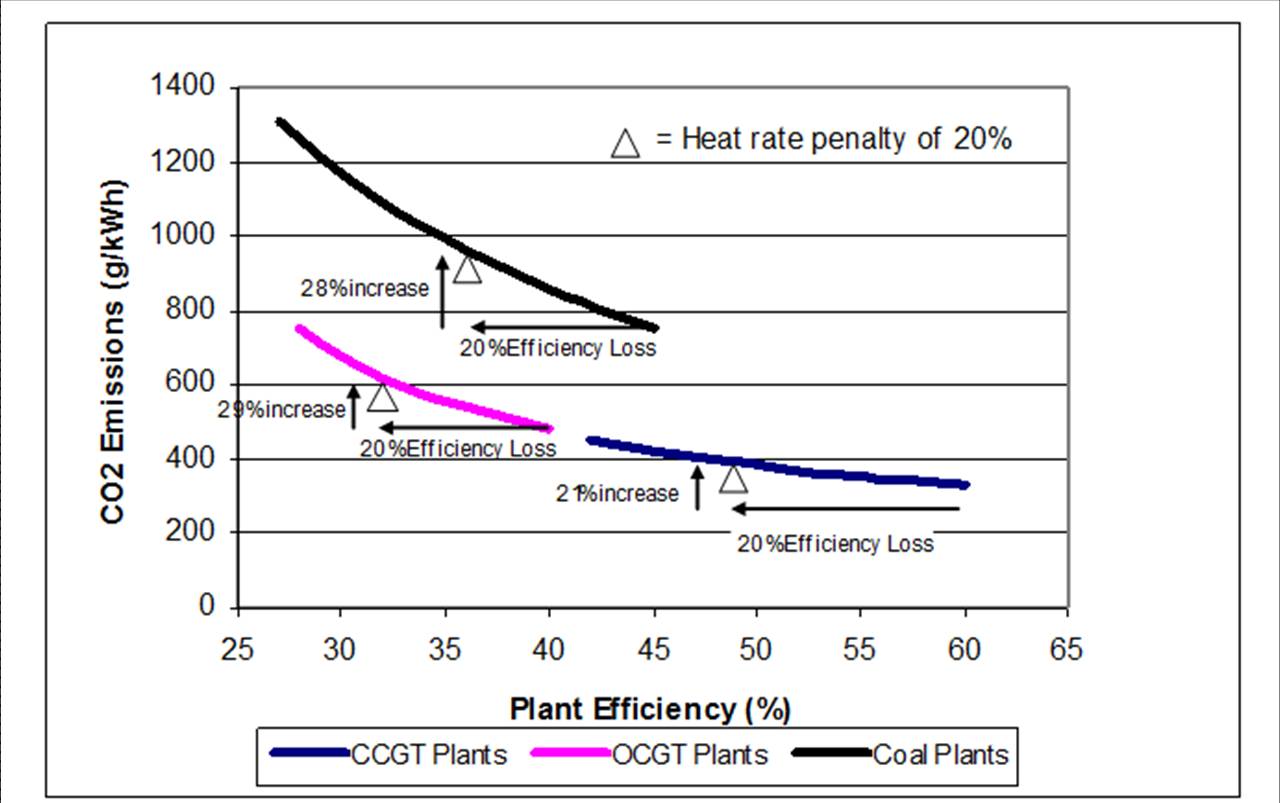
Figure 3 – Relationship between plant efficiency (heat rate penalty) and CO2 emissions. This is derived from a Siemens chart in a paper by David White, Reduction in Carbon Dioxide Emissions: Estimating the Potential Contribution from Wind Power.
Based on Figure 3, the Calculator has a chart for increased percentages of CO2 emissions and fossil fuel consumption for heat rate penalties ranging from 0-30% for CCGT, OCGT and bituminous coal plants, which can be found at the Interface Values tab. The starting points in the chart are as shown in Table 1.
Table 1 – Starting Points for Calculations of CO2 Emissions
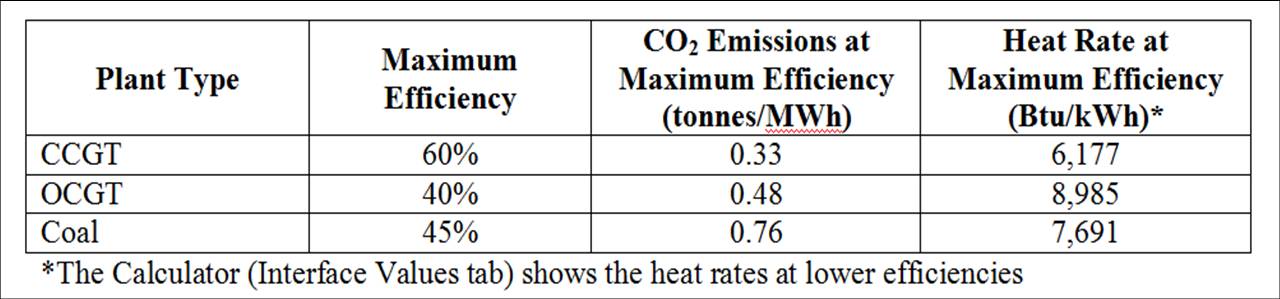
The Calculator uses these starting points for efficiencies (heat rates) to determine the per cent increase in CO2 emissions and fossil fuel consumption. As actual experience of efficiency levels in normal operations will likely be lower than these maximum values, and will vary by jurisdiction, the Calculator results will be conservative. This approach simplifies and generalizes the calculations. Specifically, the heat rates for coal plants may be the most conservative of the three but are in line with that reported by the National Petroleum Council.
A number of factors can affect the heat rate penalty, for example wind capacity factor, wind curtailment, grid connections between wind plant implementations and balancing plants, and some balancing plants may be able to operate “normally” for periods of time. To allow for these considerations, as discussed above, the heat rate penalty/percentage increase in fossil fuel consumption and CO2 emissions can be varied appropriately as shown in Part V, and is now an explicit feature of the Calculator.
The challenge in using the calculator is the correct choice of input parameters. An approach to address this is sensitivity analyses, as shown in the calculator runs in posts I-V.
It must be remembered the calculator is looking only at the wind and wind balancing portion of the system and related CO2 emissions and fossil fuel consumption. To put this in the context of the total CO2 emissions and fossil fuel consumption (savings/increases) of the electricity system, you have to manually calculate the results on that basis.
Capacity Factor
This is not the major consideration in wind performance but is used here to set the wind electricity production for a year, and the related production required from wind-balancing fossil fuel plants. If the production is known, enter the wind capacity and change the capacity factor to arrive at the correct wind production. To use the Calculator you must know two of these three factors. Even knowing production only is not sufficient because it is necessary to calculate the associated fossil fuel wind-balancing production, which is the wind production at 100% capacity minus the actual wind production. This is illustrated here at slide 6.
Wind Penetration
The Calculator makes no assumption about wind penetration, measured as a per cent of wind production to total electricity generation, except as it shows the results of increasing wind production. The effects of wind are the same at all levels. At low wind penetrations (~<2%) this might not be “noticeable” and normal system reserves may be used for wind balancing if this does not increase risk to system reliability. Because of grid topology, local conditions of higher wind penetrations can occur, and a system-wide view may not be relevant.
Baseline for Comparisons
The Calculator allows for the fossil fuel plant configurations to be set for the case of no wind in the electricity system. If coal plants are used, and gas plants employed for wind balancing, then a separate consideration is the case of CCGT plants alone to providing the same amount of electricity production as the wind/gas plant combination. This illustrates the point that wind is not necessarily displacing coal production, but is in fact replacing the wind-balancing production.
Improvements in Gas Plants and Approaches
Approaches improving the ability of gas plants, using turbine and reciprocating engines, to act in the wind-mirroring role are known.
One is to employ a greater number of smaller, natural gas fuelled reciprocating engine-generator sets working together to better match the wind ramping profile. This may not prove as feasible as the theory suggests. Further comments on this approach can be seen here.
Improvements to CCGT plants are available, with such characteristics as faster start-up times (a factor in overall efficiency) and auxiliary boilers for Heat Recovery Steam Generators (HRSG), which would facilitate increased cycling. Many of these features improve CCGT plant ability to be used more flexibly in its normal role within an electricity system – and likely only incidentally and peripherally to support wind integration.
So, the main questions remain: (1) the ability of such measures to effectively address wind’s volatility, (2) the operational considerations impacting feasibility, and (3) the full economics of such approaches to mitigating wind’s volatility. A gas plant professional consulted on this suggested that better solutions likely can be found on an electricity system basis than on a plant technology basis. For example the use of gas plants alone to facilitate the replacement of coal as a better solution than adding the unnecessarily expensive and complicating factor of wind plants.
I would like to thank those who have taken a close look at the Calculator. As a result, a few errors have been found and good suggestions been made for improvement. There are no fundamental changes. I expect this process to continue.
The Calculator should be viewed as a step in the process of better understanding the impact of adding utility-scale wind plants to an electricity system. It can be used to quickly counter claims made by wind proponents. Such counter-claims can be supported by a series of questions as to how the many factors discussed here have been taken into account in their analysis. Odds are that they will find the questions difficult to answer convincingly. Simple references to studies supporting their views are not answers as they are unlikely to take these factors into account.
The importance of Kent’s work, even as he seeks to refine it, is that it identifies many of the key variables involved with the dynamics of wind integration. Variable control, in which the performance of individual elements involved in any transaction are accounted for singly and as they interact with other elements, is the ne plus ultra of scientific analysis.
Virtually everything involved with wind integration is in motion, including the concept of capacity factor for wind, which is always in flux, unless, about ten percent of the time, it is zero. Consequently, wind reports that present static snapshots of wind performance at even hourly intervals fall far shot of controlling for all necessary variables. The issue is fraught both with complexity and complications.
Still, this is no reason to think that functional, effective measurement of wind’s effects on overall CO2 emissions cannot be achieved. Kent’s calculator is a terrific beginning.
[…] Technical Appendix to the Calculator: Fossil Fuel Consumption, CO2 Emissions, and Costs with Wind (P… – MasterResource […]
Hi where exactly can we find “the calculator”. I have been searching everywhere for a graph that graphs heat rates vs CO2 emissions for different types of coal. This is the closest I have found and one of the tables says the Interface Values tab shoes heat rates at lower efficiencies.
Mariah,
A link to a copy of the Calculator is in para 3 of Part I of this series at http://www.masterresource.org/2010/11/the-calculator-14-results-part-i/
There is a link in Part II regarding your comment on efficiencies for different types of coal, which is related to heat rate given a starting point for heat rate say at peak efficiency. The link to Peter White’s paper is in the descriptive title to Figure 3 on page 15.