Peeling Away the Onion of Denmark Wind (Part III – Wind Electricity Used in Denmark)
By Kent Hawkins -- October 28, 2010[Editor’s note: Parts I and II set the stage for the development of some conclusions about how much wind electricity Denmark exports, which will be provided in this post. The impact of wind on CO2 emissions is addressed in Part IV]
To further reduce the total amount of information to a more manageable level, the following is a look at this from the point of view of Denmark’s electricity import/export flows for the most recent “normal” year (2004), dry year, (2006), and a wet year, (2007), these conditions being the main driver of exports. This is shown graphically in Figures 1-3, starting with a normal year. In these charts numbers may not exactly balance due to rounding. Note in particular the net export levels, which are typical for each type of year.
It must be remembered that most of these activities can take place at different times during the year, month or day. For example wind generation is usually strongest at night so Norway and Sweden could be taking Danish wind at night and delivering hydro-generated electricity during the day. Alternatively, Nordic hydro-generated electricity could be being used extensively to balance the remaining large amount of Danish wind for domestic consumption within Denmark or export to Germany.
As Figure 1 shows, in normal years, the flow through Denmark is relatively balanced between imports and exports with its electricity trading partners.
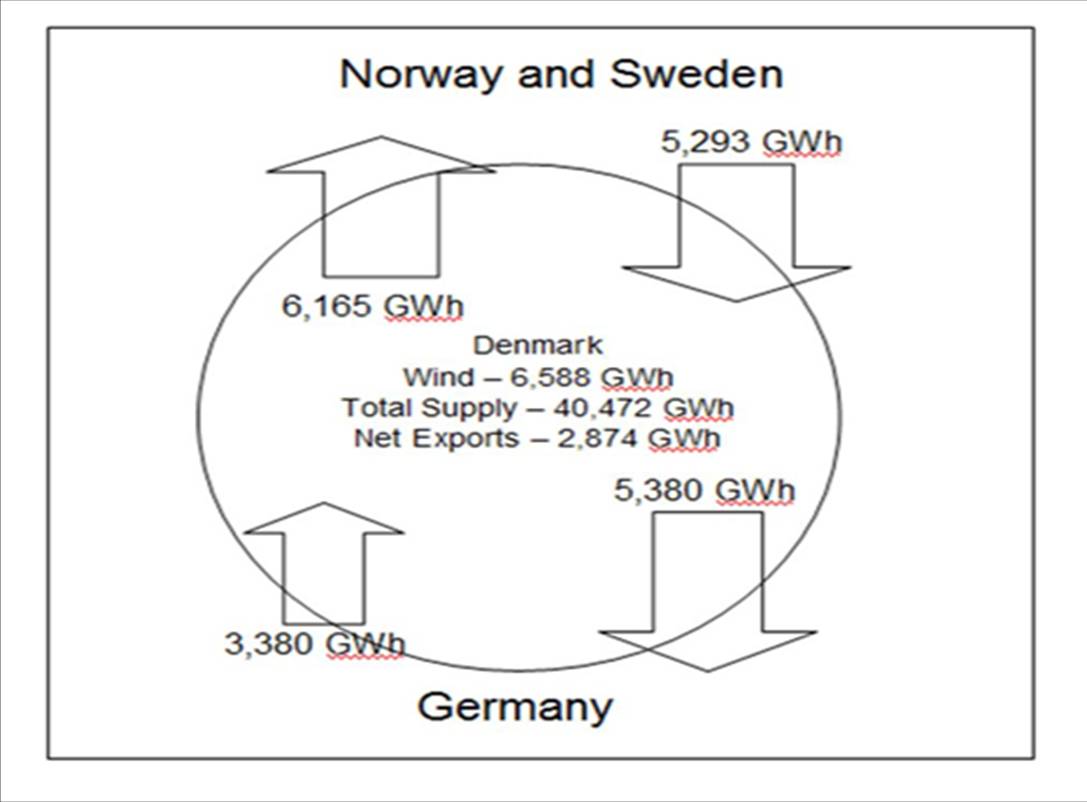
Figure 1 – Danish imports and exports of electricity in 2004, in a normal year, that is when there are not significantly wet or dry conditions in the Nordic region.
Here there is ample opportunity for the export of Danish wind to Norway/Sweden. Bach calculates that about 60% of wind from West Denmark, which has about 80% of total Danish wind capacity, is exported. Wind exports from East Denmark are typically less than that for West Denmark, and Andersen notes that there is more clearly an export of fossil fuel generation from East Denmark.
As well Nordic hydro flows to Denmark and Germany, and the opportunity exists for Danish fossil fuel electricity to be exported to Germany, and possibly some wind. Wind-generated electricity used domestically within Denmark is possibly balanced by Norway/Sweden hydro imports. Again, exports to Germany could be Danish wind “firmed” by Nordic hydro. Net export levels tend to be between those for wet and dry years.
In wet years the north to south flow of electricity is stronger, as shown in Figure 2.
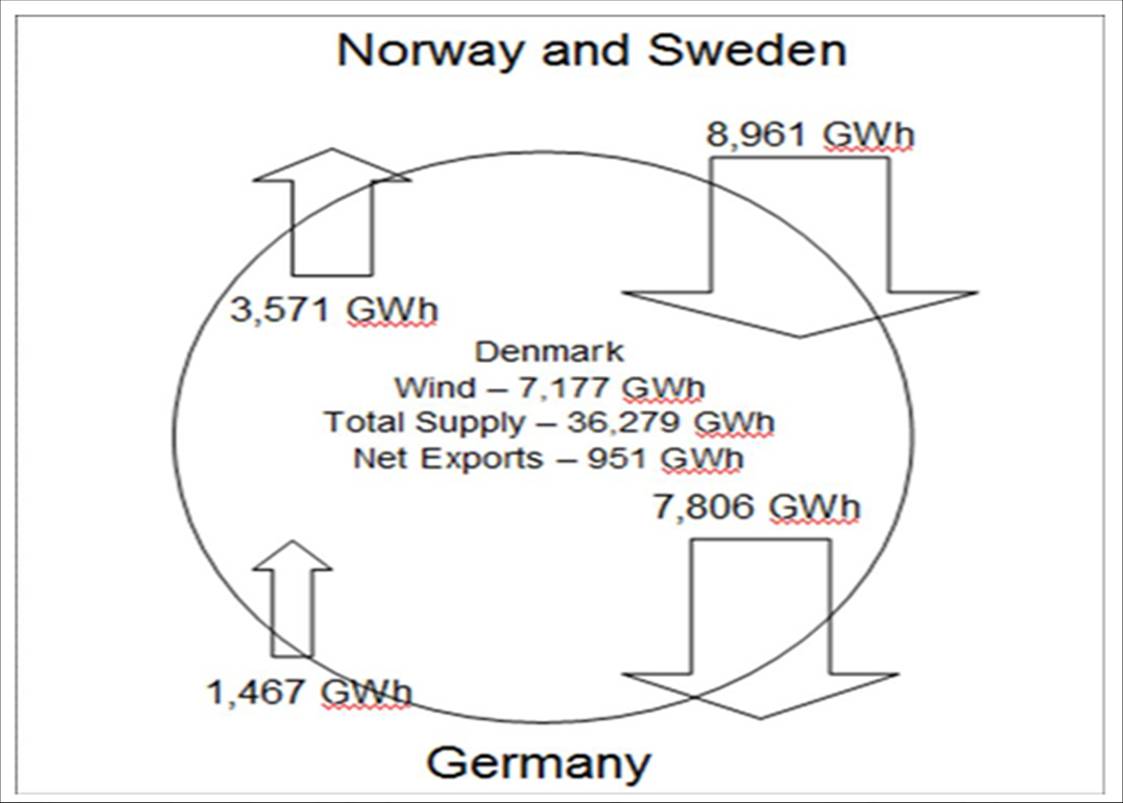
Figure 2 – Danish imports and exports of electricity in 2007, a wet year with Nordic water reservoirs full.
The exports from Denmark to Norway/Sweden could easily all be from wind-generated electricity in Denmark. Bach calculates that only about 48% of wind from West Denmark is exported. Wind in Denmark can be balanced with hydro from the north.
2007 was a year of high winds. In this year Denmark is still a net exporter of electricity, but only just. There is an opportunity to export a maximum of only about 50% of its wind-generated electricity to Norway and Sweden, leaving almost 10% of total supply to be handled domestically, or some exported to Germany. As it is a wet year and Nordic water reservoirs are full, there is a flow of hydro-generated electricity from there to Denmark and Germany.
There are two questions not easily answered, which are illustrative of similar questions for all year types:
- How much Nordic hydro is consumed in Denmark and how much passed on to Germany?
- Given the limitation of the amounts taken by Norway and Sweden, how much wind-generated electricity is exported to Germany? The complicating factor here is that the German state just south of Denmark, Schleswig-Holstein, contains a concentration of German wind plants. Danish wind might still look attractive to Germany if it is firmed with hydro from Norway/Sweden (and possibly with Danish gas plants), and the price is low. Notably, Danish gas plant fleet efficiencies fall in wet years.
Figure 3 looks at a recent dry year, 2006, and Denmark is a strong exporter of electricity. It was also not windy.
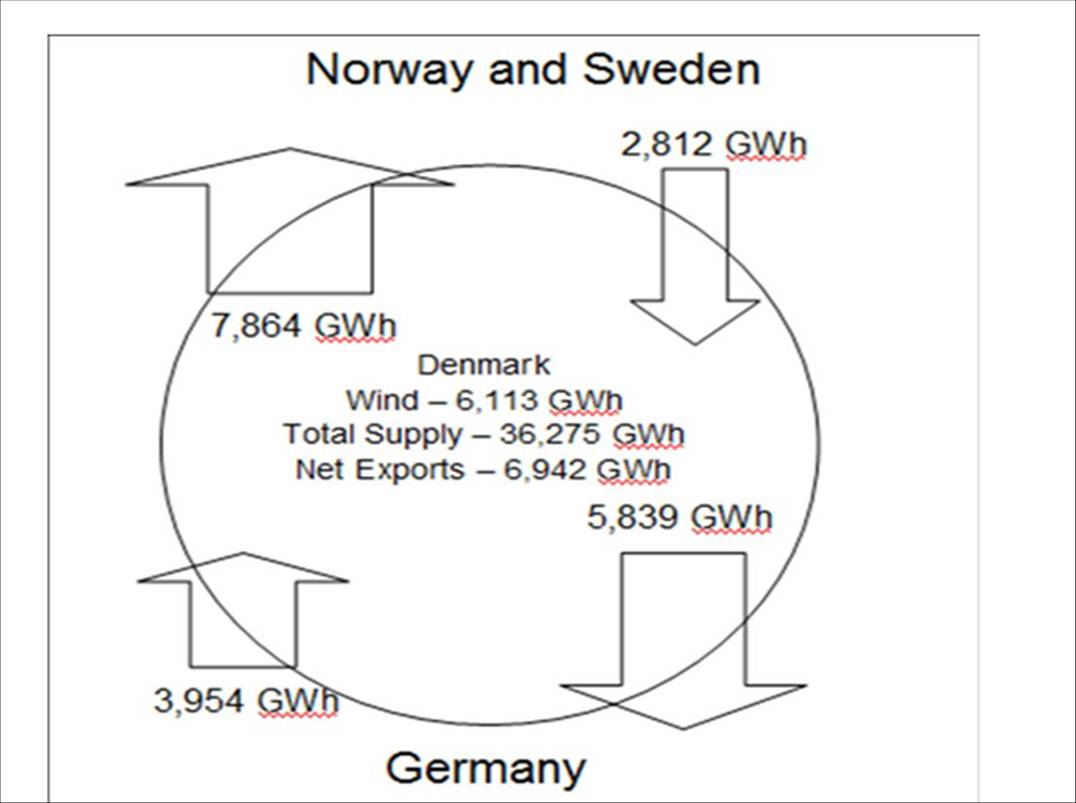
Figure 3 – Danish imports and exports of electricity in 2006, a dry year with Nordic water reservoirs not full.
There is a stronger north flow compared to a south one. Norway and Sweden likely take all the wind power they can from Denmark to conserve water in their reservoirs and, as in all types of year, the price is right. Bach calculates that about 70% of wind from West Denmark is exported. All exports from Norway/Sweden may flow through to Germany, or some may be used to balance wind within Denmark. The imports/exports with Germany are likely split between Denmark and Norway/Sweden. Denmark is importing German electricity (likely fossil-fuel generated) and possibly exporting fossil-fuel generated electricity to Germany. The reasons for both flows are likely largely timing of supply/demand coupled with price considerations. Wind in Denmark could still be balanced with some Norway/Sweden hydro. Net exports tend to be the greatest of all three year types by a large margin.
Another Analysis of Wind Exports/Imports
There appears to be no complete analysis that convincingly shows the reality of the Danish wind exports and hence actual domestic use of wind power. The following is an attempt to start to overcome this. It is not based on considerations of net exports alone, but takes actual imports/exports into account. In this connection, it must be remembered that without knowing the fuel mix of exports and imports any analysis remains in the area of speculation, but this still leaves open the consideration of plausible speculation. Further supporting the following analysis, as previously explained, there is considerable evidence indicating that a large proportion of Danish wind production is exported.
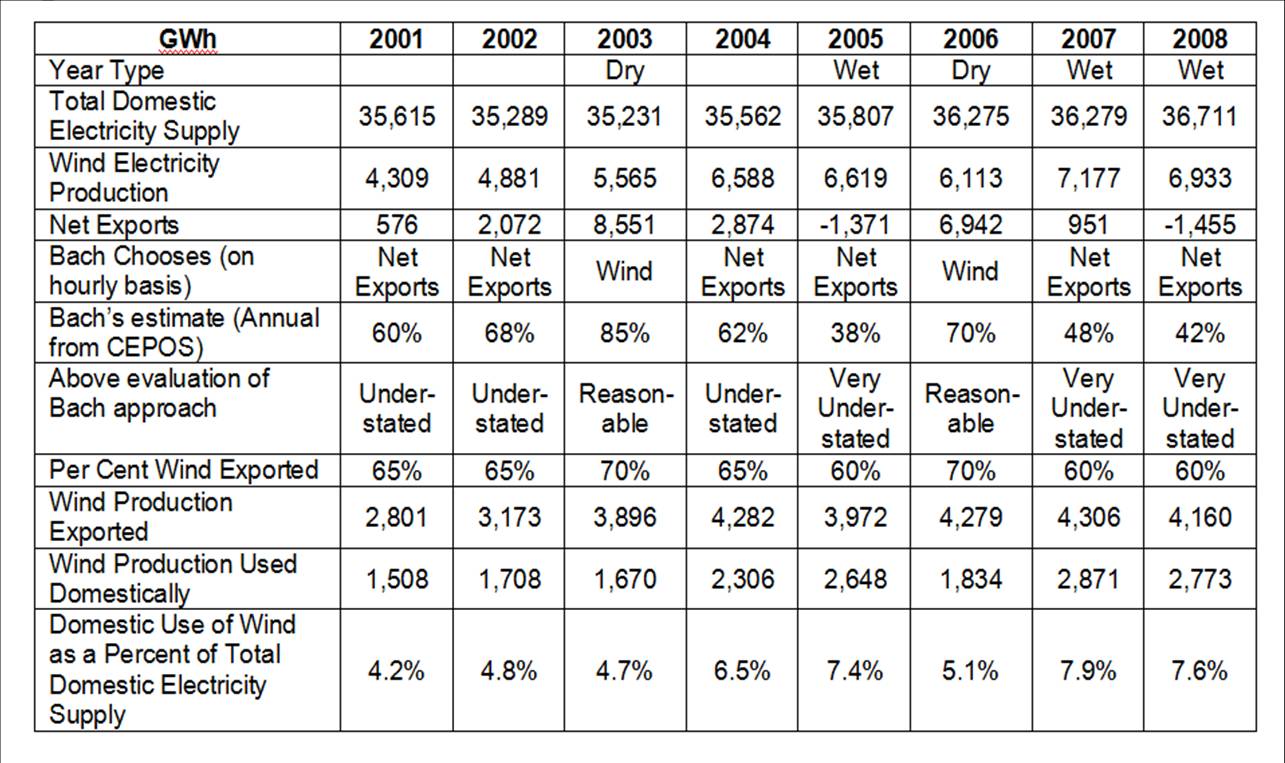
Bach’s approach in general is that, on an hourly basis, wind exports are the lesser of wind production or net exports. As reported by CEPOS, Bach determines the following approximate annual levels for wind exports:
- Normal years – 60-70% (understated)
- Wet years – 40-50% (very understated)
- Dry years – 70-80% (reasonable)
Taking some liberties in applying the effects of Bach’s hourly assumptions that were discussed at the beginning of this post to these annual numbers, the following values will be used for an analysis of wind exports:
- Normal years – Net exports are typically small relative to wind production and exports, so this approach might tend to understate the wind export level. The middle of the range of Bach’s numbers, 65%, will be used
- Wet Years – In wet years net exports are very small, and can be net imports, so this approach would produce a very low wind export number, and likely to the greatest degree of all three, so this probably significantly understates the case. Bach shows about 40-50% of wind electricity is exported. In the subsequent analysis 60% will be used.
- Dry Years – In dry years net exports are very large. In this case net exports still exceed wind production so the total wind production would be used, which likely to overstates the case. However Bach shows 70-80%, which appears reasonable, but a conservative 70% will be used.
Resulting values of Danish Wind-generated Electricity Used Within Denmark
Table 1 summarizes the results of applying the above factors to the Danish electricity production for the period 2001 to 2008, which are the years of Bach’s findings.
Table 1 – Summary of Danish Wind Used within Denmark
Readers are invited to consider the foregoing carefully and draw their own conclusions. Thoughtful comments are welcome.
The above analysis and the Denmark situation in general provide a strong indication of the upper limit of manageable wind penetration for a country, state or province.
Part IV will address the issue of the impact of Danish wind on CO2 emissions.
For ease of navigation, the other posts in this series are:
Part I – Introduction
Part II – Details of Exports and Imports
Part III – Wind Electricity Used in Denmark (this post)
Part IV – CO2 Emissions
Very useful. The prices are missing . Electricity is cheaper in Norway. What do they charge Denmark for Hydro exports? Round trip thru hydro costs 25% anyway. It is often said that Denmark sells its power at a loss, but no numbers. Perhaps they are not so dumb as that seems.
Let me attempt a fairly simple answer. Electricity pricing in the wholesale market is a fairly complex matter that is also time dependent (sometimes just hours), so there is no general price, but a continuously changing one. The wholesale price is that which system operators agree to pay/sell whether domestic or international on this sort of “real time” basis. Excess wind often drives this market to effectively zero price (sometimes negative) for a number of complicated reasons. This means that some domestic customers can actually be paid to use it, but this tends to be more to the benefit of international (or other jurisdiction) buyers. When Denmark buys it back it appears to happen when wholesale prices are normal, again for a number of reasons. One reason is the timing of wind – often excess wind at night when demand is low and low wind during the day when demand is high. This exchange is not seen by users within Denmark as they pay the Danish retail electricity rates, which are set. The Danes are not dumb. All this just gets lost in the swings and round-abouts, so to speak.
This does not mean the wind power is less expensive to produce – just sell. Someone has to pay the wind plant owner for his capital investment and operating costs, including maintenance. In this case the Danes do through their high electricity rates or taxes.
Why does the Danish government do this? One reason is that they have developed a wind turbine industry that is very dependent on international sales of wind turbine products and services. In effect they have saturated their domestic market and must export or lose jobs, which is what is currently happening, in part due to competition from China.